Article
Printed in Brazil - ©2017 Sociedade Brasileira de Química0103 - 5053 $6.00+0.00
*e-mail: [email protected]
Determination of Chlorophenol in Environmental Samples Using a Voltammetric
Biosensor Based on Hybrid Nanocomposite
Renata K. Mendes,*,a Beatriz S. Arruda,a Elizabeth F. de Souza,a Alessandra B. Nogueira,a Omar Teschke,b Luiz O. Bonuglib and Augusto Etchegaraya
aFaculdade de Química, Pontíficia Universidade Católica de Campinas, Rod. D. Pedro I, Km 136,
13086-900 Campinas-SP, Brazil
bLaboratório de Nanoestruturas e Interfaces, Instituto de Física Gleb Wataghin,
Universidade Estadual de Campinas (UNICAMP), 13083-859 Campinas-SP, Brazil
In this work, a simple electrochemical biosensor for 4-chlorophenol was developed based on laccase immobilized on a hybrid nanocomposite (ZnO nanoparticles/chitosan), and incorporated in a carbon paste electrode. There are few biosensors in the literature for this specific pollutant because it tends to form polymeric films on the electrode, causing surface passivation or even enzyme inactivation. The carbon paste allowed the surface to be easily renewed by polishing, which amends this limitation. To optimize the experimental conditions, we used cyclic voltammetry and hydroquinone as a representative of phenolic compounds due to the high toxicity of chlorophenol, thus avoiding the generation of hazardous residues. After optimization, a calibration curve was constructed for 4-chlorophenol using differential pulse voltammetry, and a linear response was obtained from 1 to 50 µM, with a lower detection limit of 0.7 µM. The obtained biosensor showed high accuracy when employed in the analysis of industrial wastewater.
Keywords: biosensor, laccase, hybrid nanocomposite, chitosan, 4-chlorophenol
Introduction
In recent years, we have seen a trend of generalized improvement of life quality, a process that requires higher criteria to attend the demands of technological advances and innovation. Although the advances in technology have brought on the one hand higher standards for comfort, on the other hand it may have used non-sustainable processes to obtain manufactured goods, for instance using unfriendly chemical routes that at industrial plants may represent a source of environmental contamination, if effluents are not appropriately treated. Therefore, the presence of certain compounds with carcinogenic or mutagenic properties in industrial effluents has been a matter of growing importance in the last decades for environmental scientists, since these substances, even at low levels, can cause deleterious environmental effects with undesired consequences to
public health.1 Amongst these substances, the phenols stand
out, specially the chlorinated species, which are widely used as preservatives at wood manufacturing industries,
as intermediates in the production of pesticides and at the
development of adhesives.2 In addition, chlorophenols
have strong odor and are resistant to biodegradation due to the presence of chlorine atoms linked to an aromatic ring,
which renders them a long persistence in the environment.3
For the environmental scientists, the research and development of selective and sensible methods for the detection of phenols has a progressive demand and is
of paramount importance.4 There are a number of such
methods based on chromatographic techniques,5,6 capillary
electrophoresis,7 and spectroscopy approaches.8 However,
all these techniques have disadvantages such as preparation time, difficult or complex manipulation, high cost, solvents and reagents’ consumption, and, additionally, require
well-trained analysts.9
Nowadays, the search for alternative, non-classical methods and that could be simple, fast and clean are preferable, considering for example the principles of
green analytical chemistry.10 In this context, biosensors
are excellent devices.11 They require minimal sample
sample; the analysis is carried out in seconds and they
present high selectivity.12 Selectivity also increases when
the recognizing element is an enzyme as in the case of
laccase, which is useful in detection of phenols.13
Currently there are few reports related to the determination of chlorophenols using biosensors due to difficulties arising from the fact that these compounds have the ability to generate intermediates, thus forming polymeric structures that crust on the electrode surface. Consequently, there is passivation of the sensor surface and/or enzyme inactivation.
Wang and Hasebe14 developed a biosensor based on
amperometric detection. The authors used flow injection analysis for a device that had the enzyme tyrosinase immobilized on a carbon felt, previously functionalized with the crosslinking reagent aminopropyltriethoxysylane (APTES) after ultrasonic treatment. The authors obtained 10 consecutive measurements with this device without any loss in the electrochemical signal and with good yields of
operational stability. In another work,15 a gold film was
electronically deposited on glassy carbon surface for the further immobilization of horseradish peroxidase (HRP). Analysis of the voltammograms obtained for 4-chlorophenol determination, with and without enzyme immobilization, indicated that the presence of hydrogen peroxide in the reaction medium raised the stability of the obtained device. These conditions allowed the development of 30 analytical cycles with a response signal permanence of 81.5% using a biosensor, in comparison with 9.9% of the carbon electrode that had just received a layer of gold. In addition, the
detection limit obtained with the biosensor was 0.39 µmol L-1.
On the other hand, in order to maintain the response of the electrochemical biosensors, enzymes must be efficiently immobilized on the electrode surface. If binding is not effective, the enzyme can leach out with time, thus reducing the response signal of the apparatus. Electrostatic interaction
is one of the most efficient immobilizing procedures.16 In
order to promote enzyme immobilization by opposing forces it is also necessary to add functional groups at the surface of the electrode. This can be carried out using biopolymers such as chitosan, which when added to the surface will form a layer exposing the N-terminal free amino groups of chitosan. Besides, when compared to other polymers, chitosan presents higher mechanical strength, in addition
to the advantage of being inexpensive and non-toxic.17 To
increase the performance of chitosan-based biosensors, the use of this material can benefit from its association with nanotechnology to produce nanocomposites and thus generate novel and interesting platforms for enzyme immobilization. Nanomaterials, especially nanoparticles, offer unique characteristics, as they produce fast and more
sensitive responses in comparison with planar surfaces.18
As a result of their small dimensions, their high superficial area and their consequent strong adsorption properties for any type of molecules, including biomolecules, have turned these materials the most widely used in the development of biosensors, especially for those that have
potentialities for miniaturization.19 In this work, zinc oxide
nanoparticles were used as solid support to offer a platform for the immobilization of the sensing molecule due to their
electronic and structural characteristics.20 Besides the latter
advantages, ZnO is a semiconductor with a wide band-gap (3.37 eV) at room temperature, high exciting binding
energy (62 meV) and large piezoelectric constant.21 Thus
ZnO nanoparticles are unique sensor materials, combining semiconductor and oxide properties, necessary for actuation as field-effect transducers (FET), an important feature when related to an electrochemical biosensor in which the
electronic characteristics is paramount.22 In addition, ZnO
nanoparticles present low toxicity and high biodegradability,
thus contributing to the generation of less dangerous wastes.23
The combination of chitosan, which is essentially organic, with metallic nanoparticles (inorganic), generates a type of hybrid nanocomposite, which is very appropriate for the construction of biosensors, considering that the biocompatibility given by the polymeric film will contribute
to maintain enzymatic activity.24
Within this context, the present work describes the development of a biosensor based on laccase immobilized on nanocomposite produced by the hybrid association of chitosan and zinc oxide nanoparticles. The device was successfully used to determine 4-chlorophenol in wastewaters.
Experimental
Reagents and solutions
All reagents (analytical grade) were purchased from Sigma-Aldrich and were used as received. Phosphate buffer solutions were obtained by mixing solutions of
0.1 mol L-1 Na
2HPO4 and 0.1 mol L-1 NaH2PO4 in ultrapure
water. All solutions were prepared with deionized water
(> 18 MΩ cm, Milli-Q, Millipore).
The wastewater was obtained from a chemical industry in a city of São Paulo State, Brazil.
Biosensor construction
Zinc dioxide (ZnO) nanoparticles were synthesized
according to the procedure of Daneshvar et al.,25 and after
nanoparticles were then washed with phosphate buffer
0.1 mol L-1, pH 7.0. Then, 200 µL of this suspension was
added to the 4.0 mg mL-1 chitosan aqueous solution, which
was incubated at 4 °C (in the fridge) for 15 min to obtain the nanocomposite. This was followed by the addition of 10 µL of
the enzyme solution (1 mg mL-1). The system was stirred for
1 min and allowed to stand in the fridge for another 30 min, in order to promote the electrostatic interaction of enzyme with the chitosan surface. After enzyme immobilization, 100 µL of the resultant suspension was added to 0.175 g of graphite powder, followed by the addition of mineral oil. A carbon paste was prepared by grinding this mixture using mortar and pestle. The obtained carbon paste was transferred to a glass tube that has a connecting Ni/Cu wire to allow electrical contact with a potentiostat.
Electrochemical measurements
Initial experiments involved the determination of hydroquinone, which was carried out using cyclic
voltammetry in 0.1 mol L-1 phosphate buffer pH 7.0 within
the range of −200 to 400 mV at 50 mV s-1. Experiments
were performed using an electrochemical cell equipped
with a Teflon® cap in which there are connecting dumps,
respectively for the attachment of the working electrode (biosensor), the reference electrode (Ag/AgCl) and the platinum counter electrode. Measurements with 4-chlorophenol involved differential pulse voltammetry, in the range of 100 to 850 mV with 25 mV amplitude at
25 mV s-1, in the same electrochemical cell. All experiments
were carried out in an AUTOLAB micropotenciostat (Metrohm) PGSTAT 101.
Atomic force microscopy (AFM) imaging
For AFM imaging, the suspensions of nanoparticles were applied on silicon surfaces (20 × 20 mm), and dried
in the air for at least 2 h at 20 °C under 60% humidity.
The silicon wafers (orientation <100>, 10 W cm-1, Virginia
Semiconductor, USA) were preliminarily etched in 50% m/m fluoridric acid and rinsed with Milli-Q water just before use. Non-contact mode topographic AFM images were obtained with a Thermo Microscope AutoProbe CP-Research. The ultra-low spring constant of its silicon
nitride (Si3N4) cantilever (ca. 0.03 N m-1), the use of small
curvature tips (ca. 5 nm radius), and the scan rate of 1 to 4 Hz, allowed us to scan the particles without promoting any physical damage. Measurements of the dimensions of particles were obtained with the AFM software.
Results and Discussion
Atomic force microscopy was used to estimate the size and morphology of the ZnO nanoparticles, before and after functionalization with the sensor element (laccase). As showed in Figure 1A, originally the ZnO nanoparticles were uniformly dispersed on the substrate, exhibiting spherical morphology with an average diameter (n = 6) of 0.196 ± 0.058 µm. Functionalization with chitosan, followed by enzyme immobilization, favors the agglomeration of the functionalized ZnO nanoparticles on the silicon surface during the process of drying the samples. However, it was still possible to see that it also caused a significant increase in particle diameter (0.430 ± 0.080 µm) and thickness (Figure 1B). Therefore, these images confirm the stepwise layering of this biosensor component.
Biosensor response
In the present work, we have prepared three different devices to test the enzyme immobilization methods in order to obtain the best configuration of the biosensor, considering its performance and sensitivity of detection. The different devices that were sequentially constructed
and analyzed consisted of: (i) a biosensor with the laccase
enzyme directly incorporated into a carbon paste;26 (ii) a
similar device in which laccase was immobilized directly on
ZnO nanoparticles by physical adsorption and (iii) a device
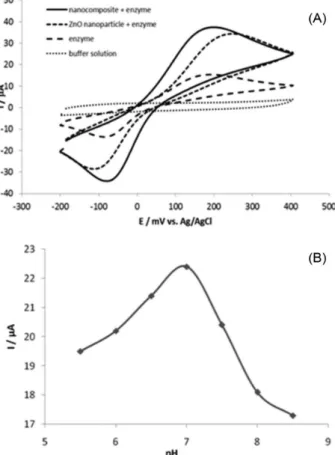
based on the preliminary development of a nanocomposite (chitosan-covered zinc oxide nanoparticles), followed by enzyme immobilization (Figure 2A). Chitosan is a natural polymer that has been widely used in the construction of biosensors, which has been shown to adsorb tightly at the
surface of several nanoparticles.27 Therefore, to obtain the
third device, initially the ZnO nanoparticles were treated with chitosan, which was physically adsorbed to produce nanoparticles with a layer of N-terminal amino groups on the surface. The laccase enzyme was then immobilized
by electrostatic interaction through of the –COO- groups
of amino acids located at the surface of the protein, with
free amino (–NH3+ groups) located at the chitosan layer.28
Enzyme immobilization was promoted at pH 7.0, given that it produces the best current values in the measurements (Figure 2B). In these conditions the net charge of laccase is negative as the enzyme’s isoelectric point is in the
range of 3 to 5.29 In addition, The pKa of chitosan is in the
range of 5 to 6, thus it has a positive charge at pH 7.0.28
Considering that the enzyme is bond to chitosan by salt bridge, an improvement in device performance was expected, since electrostatic forces are more resistant to variable experimental conditions, when compared with immobilization by van der Waals adsorption. In addition, chitosan is a biopolymer, providing a favorable environment
for enzyme activity.27
Analysis of the biosensor response signals shown in Figure 2A demonstrates that the biosensor containing only graphite powder with adsorbed laccase presents lower current values, when compared with the response in buffer solution. A significant increase in electrical signal is observed when the ZnO nanoparticles are added to the system. This is because nanoparticles have a high area/volume ratio, allowing the immobilization of larger quantities of enzyme molecules at
their exposed surface.30 In addition, the nanoparticles can
also contribute to increase the rate of electron transference, which is important in the case of electrochemical biosensors due to signal amplification. However, when the biosensor was assembled with the nanocomposite (chitosan/nanoparticle), there was considerable increase of current flow, indicating improvement in the sensitivity of the detecting device. Probably, in the latter case, the biomolecule immobilization on the sensing surface was more effective because, as mentioned above, chitosan creates a biocompatible environment, which favors the catalysis promoted by laccase.
Optimization of experimental conditions
In order to use the biosensor to probe the industrial effluents containing 4-chlorophenol, a previous study of optimization of experimental conditions was carried out. For instance, important parameters refer to the concentration of the enzyme in the system and the time required for coupling between nanocomposite and laccase, for best performance of the device. These factors influence the performance of the biosensor and can increase or decrease their sensitivity and/or stability. To examine these two effects simultaneously, we used a factorial
design 22 with central point. This tool is very important,
because it allows the collection of relevant data by running fewer experiments, thus reducing research time and more importantly generating less waste, therefore it is a green chemistry approach. The study was carried out in phosphate
buffer solution 0.1 mol L-1, pH 7.0, containing 0.4 mmol L-1
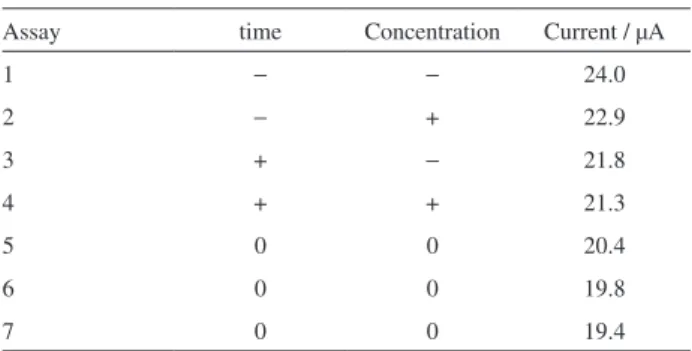
hydroquinone. The results are shown in Table 1.
Based on data in Table 1 and using a spreadsheet
developed by Teófilo and Ferreira,31 it was possible to
calculate the effects, associated errors and p-values for
Figure 2. (A)Cyclic voltammograms concerning the behavior of each biosensor in 0.1 phosphate buffer (pH 7.0), containing 1.0 mmol L-1 of
hydroquinone, between −200 and 400 mV. Scan rate 50 mV s-1. (B) Effect
coupling time (1) and enzyme concentration (2), variables that are involved in biosensor construction and presented in Table 2.
By looking at Table 2 it is possible to verify the effects of coupling time (1) and enzyme concentration (2). However, these are not significant, considering that the error is close
to the value of the effect and that the p-value is above 0.05.
Thus, it shows that both parameters have negative impact on the biosensor’s response, that is, as time and laccase concentration increase, the signal decreases. Therefore, the best settings, considering better response signals from the biosensor are: shorter coupling time (5 min)
and lowest enzyme concentration (1 mg mL-1). The value
of the interaction between time and concentration (12) is not significant, although it demonstrates a synergy (positive effect of 0.3). With this data, it is possible to write a mathematical model for this experimental design:
y = 21.37 − 0.95x1− 0.4x2 + 0.15x1x2.
Confirming the results obtained by the analysis of
the effects, as the coefficients of coupling time (x1) and
concentration (x2) in the mathematical model are negative,
it implies that in order to obtain higher signal values (y) it is necessary to have lower levels of both variables. Overall, these results indicate that higher enzyme concentration and coupling times with the nanocomposite probably promote higher enzyme loading at the nanocomposite surface, thus resulting in increased thickness of the biomolecule layer on
the electrode, therefore delaying substrate transport to the
surface32 with the consequent loss of electrochemical signal.
Thus, a laccase concentration of 1 mg mL-1 and a coupling
time of 5 min were selected for the production of biosensors. In addition, we decided to investigate the influence of chitosan concentration in the biosensor response. Four different concentrations of chitosan loading were evaluated:
1; 2; 3 and 4 mg mL-1. Furthermore, the coating time
of ZnO nanoparticles by chitosan was also investigated by testing an interval between 5 and 45 min. The most appropriate concentration and coating time were identified by measuring the current obtained in cyclic voltammetry for each concentration as presented in Table 3, also using
phosphate buffer 0.1 mol L-1 (pH 7.0) and hydroquinone
as substrate.
As shown in Table 3, there is a linear increase in current values as the concentration of chitosan is increased. Higher concentrations were not tested because the solution becomes very viscous and difficult to handle. Thus, the
concentration of 4 mg mL-1 was selected for further
experiments. Table 3 also shows that beyond 25 min, all the chitosan added to the medium was adsorbed on the ZnO nanoparticles since no significant change in current was detected. Therefore, we selected the coating time of 25 min for the binding of chitosan at the surface of the ZnO nanoparticles in order to obtain the nanocomposite used in the assembly of the laccase biosensor.
Analytical parameters
Due to 4-chlorophenol being highly toxic and hazardous to the environment, we used hydroquinone in order to optimize the experimental conditions. Hydroquinone is also a phenolic compound, but with lower toxicity.
Table 1. Influence of laccase concentration and coupling time with nanocomposite using 22 factorial design with central point
Assay time Concentration Current / µA
1 − − 24.0
2 − + 22.9
3 + − 21.8
4 + + 21.3
5 0 0 20.4
6 0 0 19.8
7 0 0 19.4
Maximum concentration: 5 mg mL-1 (+); minimum concentration:
1 mg mL-1 (
−). Maximum time: 60 min (+); minimum time: 5 min (−).
Central point: 25 mg mL-1 and 30 min (0).
Table 2. Effect values, associated errors and values of p26
Effect Error p-Value
Average 21.371 ± 0.19 0
(1) time −0.8 ± 0.50 0.25
(2) concentration −1.9 ± 0.50 0.06
(12) interaction 0.3 ± 0.50 0.61
Table 3. Current values obtained with different chitosan concentrations and coating times, using cyclic voltammetry between −200 to 400 mV at
50 mV s-1 in 40 µmol L-1 hydroquinone solution in 0.1 mol L-1 phosphate
buffer, pH 7.0
Assay Chitosan concentration / (mg mL-1) Current / µA
1 1 20.0
2 2 20.2
3 3 21.8
4 4 22.9
Coupling time / min Current / µA
1 5 19.0
2 15 18.5
3 25 22.9
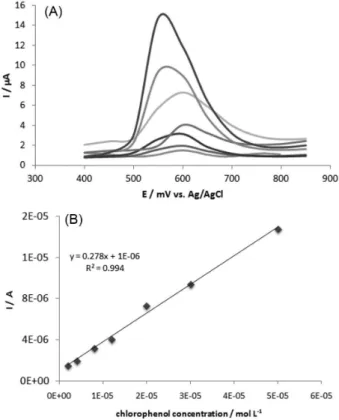
In addition, after adjustment of system performance, to obtain a calibration curve using 4-chlorophenol, cyclic voltammetry has been replaced by differential pulse voltammetry, which is known to be more sensitive, allowing lower concentrations to be detected. Figure 3A shows the biosensor performance with the increase of 4-chlorophenol concentration in the system and the corresponding analytical curve (Figure 3B).
Our studies have also shown that this type of phenol tends to adsorb strongly onto the electrode surface with the potential sweep, thus causing surface passivation after the third measurement with the developed biosensor. Some authors describe the electrochemical treatment to
renew the electrode’s surface.33,34 However, the recurrence
of voltammetric cycling to electrodes that are based on carbon may effectively consume the material, with serious consequences that include loss of sensitivity and instability. In this work, in order to obtain the calibration curve it was necessary to polish the electrode surface after each measurement. This process was carried out through mechanical polishing on bond paper, which was facilitated by using a carbon paste electrode.
The calibration curve shown in Figure 3B indicates that the developed biosensor has good linearity to the variation
of 4-chlorophenol concentration within the range of 1 to
50 µmol L-1. It was also shown that after these values, the
current remains constant, probably due to saturation of the system. A linear response was obtained given by equation
of y(A) = 0.2788x (mol L-1) + 1 × 10⁻⁶ (R2 = 0.9944). From
the calibration curve it was possible to calculate the limit
of detection (LOD) for the 4-chlorophenol of 800 nmol L-1
and a limit of quantification (LOQ) of 2.7 µmol L-1
(LOD = 3SD / slope and LOQ = 10SD / slope).
Biosensor selectivity
To demonstrate the selectivity of proposed biosensor for 4-chlorophenol determination, some substances possibly found in polluted waters, such as metals (Zn and Cd), toxins (microcystin) and other phenolic compounds (hydroquinone and cresol) were investigated by using differential pulse
voltammetry at 0.55 V. For this, 25 µmol L-1 of each
substance were added to a solution of 4-chlorophenol
(25 µmol L-1). In the absence of these substances, the
response of 4-chlorophenol using the biosensor was considered as 100%. Table 4 shows the results obtained after the addition of each possible interfering substance on the determination of 4-chlorophenol.
Observing Table 4, it is possible to verify that the other compounds have negligible effects in biosensor response for 4-chlorophenol detection, indicating that the dispositive presents high selectivity and that it can be successfully used on the determination of this important contaminant in environmental samples.
Biosensor stability
The stability of the biosensor was evaluated to verify the efficiency of the polishing step in 4-chlorophenol analysis. The biosensor presented good stability in 20 consecutive scans (using polishment after each measurement), wherein
Figure 3. (A) Differential pulse voltammograms of biosensor performance in different 4-chlorophenol concentrations in phosphate buffer pH 7.0, using 25 mV of amplitude at 25 mV s-1 and (B) the respective calibration
curve of the proposed biosensor.
Table 4. Study of biosensor selectivity for 4-chlorophenol in the presence of other substances in phosphate buffer pH 7.0, using 25 mV of amplitude at 25 mV s-1
Substance Relative response / %
4-Chlorophenol 100
Cresol + 4-chlorophenol 92
Hydroquinone + 4-chlorophenol 96
Cadmium + 4-chlorophenol 96
Zinc + 4-chlorophenol 88
Microcystin + 4-chlorophenol 86
the current value remains at 94.8%, as shown in Figure 4. At the end of 40 scans the current decreases around 77%, requiring the exchange of the paste on the electrode. This is because after 20 polishments, the amount of paste on electrode surface decreases, making it difficult to obtain reproducible current values.
Biosensor application
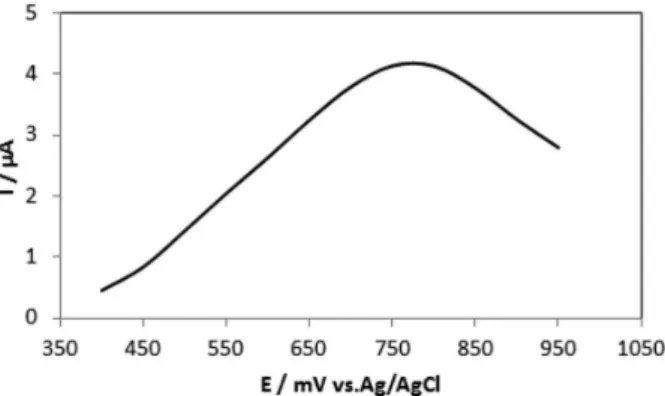
After construction of the calibration curve, the biosensor was used to quantify 4-chlorophenol in an industrial wastewater (pH corrected to 7.0), which was purposely
contaminated with 12 µmol L-1 of 4-chlorophenol. Figure 5
shows the differential pulse voltammograms obtained with the biosensor in this analysis.
Analysis of the wastewater was performed in triplicate
(4.13 × 10⁻⁶; 4.28 × 10⁻⁶; 4.29 × 10⁻⁶ A) giving the value of
11.6 µmol L-1 (relative standard deviation (RSD) = 3.3%)
of 4-chlorophenol with developed biosensor. The relative error obtained is low, which shows that the biosensor can
be used to analyze chlorophenols in environmental samples with accuracy, reliability and selectivity because the other substances present in the sample did not interfere in the quantification of the contaminant.
Conclusions
The toxic compound 4-chlorophenol is a persistent pollutant for which there are few sensitive detection methods available. For instance, electrochemical biosensors, which are very sensitive detection devices, are not currently used due to the undesired passivation that is promoted when the products from oxidation adsorb to the electrode surface, thus forming a layer that blocks electron transference. In the present work, we have successfully designed and assembled a specific biosensor for 4-chlorophenol, which circumvents this problem. This was accomplished by a simple mechanical polishment using bond paper. The device was developed using the commercially available fungal laccase that was immobilized to the electrode surface by electrostatic interactions. This was possible because we prepared a hybrid nanocomposite using chitosan adsorbed to ZnO nanoparticles.
The biosensor showed high sensitivity (µmol L-1), as well
as precision and accuracy as the relative errors were low, considering the type of analysis. Thus, the use of biosensor was shown to be an interesting alternative method for determining this important contaminant. In addition, the device was able to selectively detect 4-chlorophenol in the presence of other contaminants (organic and inorganic).
Acknowledgments
The authors acknowledge the financial support from FAPESP (2013/20570-6 and 2014/13763-5).
References
1. Gan, T.; Lv, Z.; Sun, J.; Shi, Z.; Liu, Y.; J. Hazard. Mater. 2016, 302, 188.
2. Wei, M.; Tian, D.; Liu, S.; Zheng, X.; Duan, S.; Zhou, C.; Sens. Actuators, B 2014, 195, 452.
3. Khanikar, N.; Bhattacharyya, K. G.; Chem. Eng. J. 2013, 233, 88.
4. Das, P.; Barbora, L.; Das, M.; Goswami, P.; Sens. Actuators, B
2014, 192, 737.
5. Saraji, M.; Ghani, M.; J. Chromatogr. A 2015, 1418, 45. 6. Fan, C.; Li, N.; Cao, X.; Food Chem. 2015, 174, 446. 7. Almeda, S.; Nozal, L.; Arce, L.; Valcárcel, M.; Anal. Chim.
Acta 2007, 587, 97.
8. Mukdasai, S.; Butwong, N.; Thomas, C.; Srijaranai, S.; Srijaranai, S.; Arabian J. Chem. 2016, 9, 463.
Figure 5. Differential pulse voltammogram obtained with the biosensor in a sample of industrial wastewater contaminated with 4-chlorophenol. Amplitude 25 mV and at 25 mV s-1.
9. Amiri, M.; Ghaffari, S.; Bezaatpour, A.; Marken, F.; Sens. Actuators, B 2012, 162, 194.
10. Galuszka, A.; Migaszewski, Z.; Namieśnik, J.; Trends Anal. Chem. 2013, 50, 78.
11. Cao, J.; Sun, T.; Grattan, K. T.; Sens. Actuators, B 2014, 195, 332.
12. Oliveira, T. M. B. F.; Barroso, M. F.; Morais, S.; Araújo, M.; Freire, C.; Lima-Neto, P.; Correia, A. N.; Oliveira, M. B. P. P.; Delerue-Matos, C.; Bioelectrochemistry 2014, 98, 20. 13. Nazari, M.; Kashanian, S.; Rafipour, R.; Spectrochim. Acta
2015, 145, 130.
14. Wang, Y.; Hasebe, Y.; J. Environ. Sci. 2011, 23, 1038. 15. Qiu, C.; Chen, T.; Wang, X.; Li, Y.; Ma, H.; Colloids Surf., B
2013, 103, 129.
16. Batra, B.; Kumari, S.; Pundir, C. S.; Enzyme Microb. Technol.
2014, 57, 69.
17. Anusha, J. R.; Raj, J. C.; Cho, B.-B.; Fleming, A. T.; Yu, K.-H.; Kim, B. C.; Sens. Actuators, B 2015, 215, 536.
18. Zhao, W.; Fang, Y.; Zhu, Q.; Wang, K.; Liu, M.; Huang, X.; Shen, J.; Electrochim. Acta 2013, 89, 278.
19. Hayat, A.; Catanante, G.; Marty, J. L.; Sensors 2014, 14, 23439. 20. Aini, B. K.; Siddiquee, S.; Ampon, K.; Rodrigues, K. F.;
Suryani, S.; Sens. BioSensing Res. 2015, 4, 46.
21. Adzhri, R.; Md Arshad, M. K.; Gopinath, S. C. B.; Ruslinda, A. R.; Fathil, M. F. M.; Ayub, R. M.; Nor, M. N. M.; Voon, C. H.; Anal. Chim. Acta 2016, 917, 1.
22. Arya, S. K.; Saha, S.; Ramirez-Vick, J. E.; Gupta, V.; Bhansali, S.; Singh, S. P.; Anal. Chim. Acta 2012, 737, 1.
23. Low, S. S.; Tan, M. T. T.; Loh, H.-S.; Khiew, P. S.; Chiu, W. S.; Anal. Chim. Acta 2016, 903, 131.
24. Han, E.; Yang, Y.; He, Z.; Cai, J.; Zhang, X.; Dong, X.; Anal. Biochem. 2015, 486, 102.
25. Daneshvar, N.; Aber, S.; Seyed Dorraji, M. S.; Khataee, A. R.; Rasoulifard, M. H.; World Acad. Sci. Eng. Technol. 2007, 29, 267.
26. Mendes, R. K.; Guilherme, J. P. P.; Moino, B. P.; Ferreira, D. C. M.; Etchegaray, A.; Nogueira, A. B.; Sens. Lett. 2014, 12, 177.
27. Shukla, S. K.; Mishra, A. K.; Arotiba, O. A.; Mamba, B. B.; Int. J. Biol. Macromol. 2013, 59, 46.
28. Kurukji, D.; Norton, I.; Spyropoulos, F.; Food Hydrocolloids
2016, 53, 249.
29. Viswanath, B.; Rajesh, B.; Janardhan, A.; Kumar, A. P.; Narasimha, G.; Enzyme Res. 2014, 2014, 21.
30. Vidotti, M.; Carvalhal, R. F.; Mendes, R. K.; Ferreira, D. C. M.; Kubota, L. T.; J. Braz. Chem. Soc. 2011, 22, 3.
31. Teófilo, R. F.; Ferreira, M. M. C.; Quim. Nova 2006, 29, 338. 32. Signori, C. A.; Fatibello-Filho, O.; Quim. Nova 1994, 17, 38. 33. Pontié, M.; Thouand, F. N.; Tapsoba, I.; Lherbette, S.;
Electroanalysis 2011, 23, 1579.
34. Sbai, M.; Essis-Tome, H.; Gombert, U.; Breton, T.; Pontié, M.; Sens. Actuators, B 2007, 124, 368.
Submitted: June 14, 2016
Published online: October 24, 2016