Numerical and Experimental Studies of Compression-Tested Copper: Proposal for a New
Friction Correction
Gabriel Torrentea*
Received: October 03, 2017; Revised: March 13, 2018; Accepted: April 04, 2018
New empirical relationship is proposed to calculate instantaneous maximum diameters on the sample during compression test. The proposal is a relationship between instantaneous maximum diameter, friction coefficient, initial dimensions of the sample and the displacement during the compression test. Seventeen compression tests were carried out to copper cylindrical samples without lubrication at room temperature to obtain this new empirical relationship. Numerical simulations were carried out taking into a count this new relationship for numerical validation. The maximum diameters calculated with this new empirical relationship are the same to the experimental measurements. The mechanical behavior calculated with this new relationship and with the friction corrections of Rowe and Dieter are similar. The simulations are similar to the experiments, with differences lower than 4.21%. The simulation shows higher hardening in the middle of the sample than on the bottom. Numerical simulations show that, possibly, the friction coefficient between sample and dies changes meanwhile the sample is hardening.
Keywords: Compression test, Barreling, Friction Correction, Copper.
*e-mail: [email protected]
1. Introduction
Compression test provides useful information to estimate power requirements and other characteristics of the manufacturing processes, especially for processes such as forging, rolling and extrusion.1
Compression test is usually carried out by compressing
a cylindrical sample between two flat dies. The friction
between dies and sample avoids the free expansion of surfaces, causing the barreling of the sample.1
Barreling is the change of the cross-sectional area in the samples with the height during the compression tests, which makes it difficult to obtain the curves of Stress vs. Strain. Additionally, the friction dissipates energy, so the compression force is greater than it would be.1
Two friction corrections have been widely accepted2; the friction correction proposed by Rowe3 and the friction correction proposed by Dieter4. These friction corrections can be written as the equations 1 and 2, respectively:
(1)
(2)
ri is the instantaneous radius, σ and σz are the axial stresses without and with friction, respectively; f is the Tresca Friction Coefficient and can be written as
,
f= 3n Cf is the Coulomb stress distribution and
can be written as Cf = 2μr/h. These equations are for cylindrical sample and they assume that the barreling is negligible.2
Ettouney et al.5 in 1983 used the Bridgman correction factor6 for compression tests of aluminum alloys. They determined an approximate solution for cylindrical samples with presence of barreling. They proposed that
the effective stress, σ can be writer by equation 3:
(3)
And
(4)
L is the compression load and R the bulge radius. They calculated the bulged radius using the equation proposed by Kulkarni and Kalpakgian7, where R can be written by equation 5.
(5)
De, Dm and H are the bottom diameter, the maximum diameter the height of the sample.
Ebrahimi et al.8 in 2004 proposed a new friction correction for hot compression tests carried out to cylindrical samples of Ti-IF-steel. They proposal an average friction coefficient like a function of dimensions of the deformed samples, see equation 6 and 7.
aDepartamento de Mecánica, Universidad Simón Bolívar, Valle de Sartenejas, Apartado 89000,
Caracas, Venezuela
h fr
1 3 3
2
i i Z
v= v
+
U Z
( ) exp C C
C
2 f f 1
f Z 2
v= v
-
-" %
( )Z ave 1 2DR ln1 2DR m
m 1
v= v -
-# & # &
G J
( )
D L
4 Z ave
m 2
v
r
=
( )
( )
R
D D
H D D
4 m e m e
2 2
=
(6)
And
(7)
ΔR is the difference between the maximum and bottom radius (Rm-Re), the theoretic radius Rvcp is calculated with the volume conservation principle, being R0, H0
the initial radius and initial height, respectively, and H
is the actual height
(8)
The equations 7 and 8 and experimental measurements of the radius (Rm and Re) are needed to calculate the average friction factor.
Ebrahimi et al.8 proposed an equation to calculate the radius on the bottom. See equation 9.
(9)
Li et al.9 in 2009 studied the hot compression tests carried out to cylindrical samples of IHS38MSV steel. They proposed for hot compression test a non-constant friction
coefficient µs, and a way to find it, see equation 10.
(10)
µ0, A, and ε0 are constants values calculated experimentally. Joardar et al.10 in 2013 presented a manuscript about compression tests carried out to cylindrical samples of composite (LM6/SiCp). They found a linear relationship between the logarithm of instantaneous maximum diameter and the logarithm of instantaneous height and proposed a relationship between the bulge radius, R, and the stress:
(11)
σ is the true axial stress, A and m are empirical constants. Altinbalik et al.11 in 2011 studied the compression tests carried out to cylindrical samples of AA6082. They
proposed a simple empirical expression to find the stress,
see equation 12.
(12)
σ is the compressive stress, L is the load, H0 and D0
are the initial height and the initial diameter of the sample,
Dm and H are the maximum diameter and the height of the sample after each stage of load.
2. Experimental Procedure
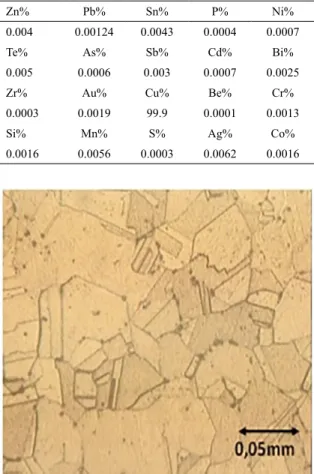
The copper was characterized by atomic spectroscopy with a SpectroLAb Junior and observed with metallographic microscope, see Table 1 and Figure 1. The surface roughness of samples and dice are N712.
b H R b 3 4 3 3 2 avg vcp n = -T T Y Y
b 4RR HH
vcp
T T
=
R
vcp=
R
0H
H
0Re 3HH R 2Rm
0 0 2 2 = -exp A s 0 0
n n f
f
= -
S
X
R A m
v = -H H D D L 3 8 m
0 02 2
v r
=
-S
X
Table 1. Atomic Emission Spectroscopy of the copper samples (W W)
Zn% Pb% Sn% P% Ni%
0.004 0.00124 0.0043 0.0004 0.0007
Te% As% Sb% Cd% Bi%
0.005 0.0006 0.003 0.0007 0.0025
Zr% Au% Cu% Be% Cr%
0.0003 0.0019 99.9 0.0001 0.0013
Si% Mn% S% Ag% Co%
0.0016 0.0056 0.0003 0.0062 0.0016
Figure 1. Photomicrography of copper attacked with H2O2 / NH4OH
Seventeen compression tests at room temperature were carried out without lubrication with a speed of 0.028 mm/s. The compression tests were carried out according to ASTM E 9-09A13 with the universal testing machine MTS-312.31/227. The samples of cooper were 12.6 mm of diameter and 20 mm of height, a slenderness ratio of 1.60.
The final displacement of the sample was the variable. The first test was made until a displacement of 2 mm, in this
way the displacement was increasing, and so on until reach
14 mm of final displacement at the last test.
The diagrams of Load vs. Displacement are showed in the Figure 2.
The final dimensions of the samples experimentally measured (see figure 3) are presented in the Table 2. Figure 4
Figure 2. Load vs. Displacement of the seventeen compression tests
Figure 3. Experimental measurements of the sample: H: height, Dm: diameter in the middle, and De: diameter on the bottom
Figure 4. Photo of some deformed samples
Table 2. Experimental measurements of the samples tested
Test Maximum Load
Kgf(N) He (mm) Dm (mm) De (mm)
1 -0 (0) 20.00 12.60 12.60
2 -4075 (-39935) 18.46 13.50 12.96
3 -4096 (-40141) 18.48 13.46 13.04
4 -4160 (-40768) 18.50 13.50 13.02
5 -4829 (-47324) 16.58 14.52 13.44
6 -4878(-47804) 16.60 14.52 13.54
7 -5834(-57173) 14.52 15.52 14.22
8 -5878(-57604) 14.58 15.50 14.22
9 -7152(-70090) 12.56 16.78 15.52
10 -8748(-85730) 10.78 18.16 16.48
11 -8771(-85956) 10.68 18.06 16.58
12 -8839(-86622) 10.68 18.10 16.38
13 -11012(-107918) 9.20 19.98 18.24
14 -11194(-109701 8.40 19.96 18.84
15 -16067(-157457) 7.26 22.34 21.16
16 -16549(-162180) 7.36 22.35 22.56
17 -16793(-164571) 7.30 22.53 21.30
*The lengths are +/- 0.02 mm
Figure 5. Relationship between logarithm of actual height/initial height and the logarithm of actual maximum diameter/initial diameter
Figure 5 is the linear relationship proposed by Joardar
et al.10 taking the measurements reported by Ebrahimi et
al.8 and the final dimensions of the samples measured in this work (Table 2).
Ebrahimi et al.8, Ettouney et al.5, Joardar et al.10 and Altinbalik et al.11 found that the barreling depends mainly on the geometric of the sample and the friction.
A new linear relationship between the maximum diameter (Dm) and the diameter calculated with volume conservation principle (Dvcp) is proposed, see Figure 6.
The empirical relationship for the compression test of copper without lubrication can be written by equation 13.
(13)
Figure 7 shows a comparison between equation 13 and the experimental measurements.
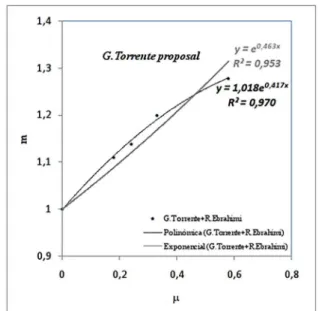
Figure 8 are the slopes m (Figure 6) vs. the friction
coefficients µ reported by Ebrahimi et al.8, for the slope m =1.199, obtained in this work, the friction coefficient took is 0.36, sliding friction coefficient between copper and mild
steel reported in the references14. .
D D
D D 1 199
vcp m
0 0
Figure 6. Relationship between maximum diameter and the diameter calculated by volume conservation principle
Figure 7. Middle or Maximum diameter measured of experiments and the Middle or Maximum diameter (Dm) calculated with the new empirical relationship (Equation 13)
Figure 8. Relationship between the friction coefficient (µ) and the slope (m)
A new empirical relationship (equation 14) is proposed
to find the maximum diameter (Dm ) of the deformed samples
during the compression tests, assuming that the coefficient
of friction is constant and the slenderness ratio of the sample is close to 1.6.
(14)
D D
D D
e. vcp
m 0
0 0 463
-- = n
The stress vs. strain curve calculated with this new proposal for friction correction (equations 4, 13 and 15) is the black curve in Figure 9.
(15)
ln DD
2 m
0
f= T Y
Figure 9. True Stress vs. True Strain of compression test of copper
with different friction correction (Volume Conservation Principle,
G.Rowe, G.Dieter, T.Altinbalick, O.Ettouney and G.Torrente)
The empirical relationship 13 allows calculate the Dm
sample without experimental instant measurements of diameters. These instant values of Dm allow obtain true stress, taking into account the barreling, for example, with the equations 4 and 15 (black curve in Figure 9), with the friction correction of Ettouney et al.5 (purple curve in Figure 9) or with the friction correction of Altinbalik et al.11 (gray curve in Figure 9).
Figure 9 is the Stress vs. Strain obtained from equation
13 and with different friction corrections.
A recent work of Wang et al.15, using inverse method combined with finite element analysis, shows that the magnitude of barreling increases with increasing friction coefficient.
Yao et al.16 and Duran et al.17 found a relationship between the barreling, the friction and the slenderness ratio. They said that, possibly, the hardening exponent of the work material
has a little effect over the barreling.
This work was made for a slenderness ratio of 1.6 and the
effect of hardening exponent is neglected in the equation 14.
3. Numerical Analysis
The numerical analysis was made with finite elements
models. The mesh was made in Gmsh 18 with a size element factor of 1.75. The finite element simulations were made
in Calculix19. The mesh size element factor was checked. The dies were simulated like rigid.
The copper was simulated like an isotropic elastic material until yield stress; and then it was simulated like an incremental plasticity material with hardening.20
The elastic behavior of copper was simulated with a Young modulus E = 11000 Kgf/mm2 (107800 MPa),21, 22 and a Poisson ratio of ν = 0.3323. See equations 16 and 17, where ε is the strain. These values were determined from
references and experimental measurements, see Figure 9.
(16)
(17)
The behavior of incremental plasticity material with hardening was calculated with the tests. The Stress vs. Strain was calculated from the experimental measurements of load and displacement (Figure 2), the maximum diameters were calculated with the new empirical relationship (equation 13)
to avoid errors by friction coefficient estimation, and the
stress and the strain were calculated with equations 4 and 15 (black curve in Figure 9).
The numerical analysis is static with SGI Solver and supposes a symmetrical behavior of the sample; therefore the control volume is the half of the sample. See Figure 10.
The simulation has boundary conditions in three surfaces (see Figure 10):
a) The surface in middle of the copper sample. This surface is free to move and on it a compression load is applied. The compression load goes from 0 to -16000 Kgf (159906 N). Another condition on this surface is the multiple point constraint of the type plane (MPC-PLANE).19 This second condition avoids fake flash on this surface.24
b) The surface on the bottom of the copper sample.
This surface is free to move and complete the contact pair with the bottom die, mortar contact with coulomb friction.
c) The top surface of the bottom dice. This surface has
not freedom degrees and it was defined to complete the
contact pair with the copper sample.
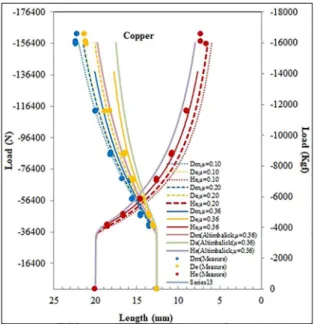
Figure 11 is a comparison between the sample dimensions obtained with the simulation and the experimentally measured.
Figure 11 shows that the friction coefficient has a strong effect over the diameter on the bottom and a minor effect
over the height and the middle diameter of the sample. Figure 11 shows that the sample dimensions obtained
from the simulation with a friction coefficient of 0.36 are the
same as experimental measurements, but for bigger strains,
the sample dimensions obtained with friction coefficients of
0.20 or 0.10 are nearest to the experimental measurements,
with differences less than 4.21%.
The aim of this works is propose an empirical equation to
find instant maximum diameters during the compression test. The empirical relationship 14 supposes friction coefficient constant,
but the numerical simulations (Figure 11) show that, possibly, the
friction coefficient decreases meanwhile the sample is hardening.
Numerical simulation shows that, possibly, the hardening
of the sample has a little effect on the friction coefficient,
and therefore on the barreling, such as was observed by Yao
et al.16 and Duran et al.17 E
v= f
v dd
Z X
f f
(306-322 MPa), stress values for a strain of 0.67 (Figure 9), strain observed in the middle of the sample, near the zones known as Intense Shear and Moderate Deformation (Figure 12).
Figure 11. Simulation results for a compression test of copper and main lengths measured on the deformed samples
Figure 11 shows that the simulation made with this new proposal is nearer to the experimental tests than the simulation made with the corrections of Dieter and Rowe.24
Figures 12 and 13 are cuts of the samples and show the Von Mises equivalent strain and Von Mises Stress for a load of
-8740 Kgf (-85590 N). and with a friction coefficient of µ=0.36.
Figure 12. Simulation results, Von Mises Equivalent Strain for a
friction coefficient 0.36 and a load of -8740Kgf (-85590 N)
Figure 12 shows the friction effect over the strain in
the sample. The strain has a minimum on the bottom and a maximum in the middle. This behavior was described by Dieter.25 He described three zones of deformation: Dead metal zone on the bottom, Intense Shearing in the middle and Moderate Deformation on the edges in the middle.
Figure 13 is Von Mises stress in the sample. This figure
shows a Von Mises stress between 31.9 and 32.9 Kgf/mm2
Figure 13. Simulation results, Von Mises Stress (Kgf/mm2or MPa)
for a friction coefficient of0.36 and a load of -8740Kgf (-85590 N)
4. Conclusions
The friction corrections proposed by Rowe et al., Dieter
et al., Ebrahimi et al., Ettouney et al., Joardar et al. and Altinbalik et al. are functions of the sample dimension and
friction coefficients. This work proposes a new friction
correction that also depended of the dimension of the sample
and the friction coefficient.
The proposal is a new empirical relationship to obtain the instantaneous maximum diameters of the sample directly from compression tests data and initial dimensions of sample.
The friction correction proposed in this work takes into account the barreling of sample during the compression test. This new proposal gives mechanical behavior similar to those obtained by the friction correction of Dieter and Rowe.
The simulation made with this new proposal for friction correction give results very closed to the experiments, with
differences minor to 4.21%.
Numerical simulations show that, possibly, the friction
coefficient change with the hardening of the sample.
The numerical simulation shows a greater strain in the middle than on the bottom.
5. Acknowledgments
6. References
1. Kalpakjian S, Schimd S. Manufactura, Ingeniería y Tecnología. 5a ed. Mexico: Pearson; 2008.
2. Li Y, Akihiko C. Aplication of Smart Hot Forging Technique
in Producing Biomedical Co-Cr-Mo Artificial Implants. In:
Niinomi M, Narushima T, Nakai, M, eds. Advances in Metallic Biomaterials: Processing and Applications. Berlin, Heidelberg: Springer; 2015. p. 57-83. DOI: 10.1007/978-3-662-46842-5.
3. Rowe G. An Introduction to the Principles of Metalworking. London: Edward Arnold; 1965.
4. Dieter GE. Mechanical Metallurgy. 3rd ed. New York: McGraw-Hill; 1986.
5. Ettouney O, Hardt DE. A Method for In-Process Failure Prediction in Cold Upset Forging. Journal of Engineering for Industry. 1983;105(3):161-167.
6. Bridgman PW. Studies in Large Plastic Flow and Fracture. New York: McGraw-Hill; 1952.
7. Kulkarni KM, Kalpakjian S. A study of Barreling as an Example of Free Deformation in Plastic Working. Journal of Engineering for Industry. 1968;91(3):743-754. DOI: 10.1115/1.3591680
8. Ebrahimi R, Najafizadeh A. A new method for evaluation
of friction in bulk metal forming. Journal of Materials
Processing Technology. 2004;152(2):136-143. DOI: 10.1016/j. jmatprotec.2004.03.029
9. Li YP, Onodera E, Matsumoto H, Chiba A. Correcting the Stress-Strain Curve in Hot Compression Process to High Strain Level. Metallurgical and Materials Transactions A. 2009;40(4):982-990. DOI: 10.1007/s11661-009-9783-7
10. Joardar H, Das N, Sutradhar G, Singh S. Barreling of solid composite (LM6/SiCp) cylinders under uniaxial compressive load. International Journal of Applied Sciences and Engineering
Research. 2013;2(4):435-445. DOI: 10.6088/ijaser.020400006
11. Altinbalik T, Çan Y. An upper bound analysis and determination of
the barrelling profile in upsetting. Indian Journal of Engineering & Materials Sciences. 2011;18(6):416-424.
12. International Organization for Standardization (ISO). ISO
468:1982 - Surface roughness -- Parameters, their values and
general rules for specifying requirements. Geneva: ISO; 1982.
13. ASTM International. ASTM E 9-09A - Standard Test Method
for the Compression Testing of Metallic Materials at Room
Temperature. West Conshohocken: ASTM International; 2009
14. Davis JR, eds. Concise Metals Engineering Data Book. Materials Park: ASM International; 1997.
15. Wang X, Li H, Chandrashekhara K, Rummel SA, Lekakh S, Van Ecken DC, et al. Inverse finite element modeling of the barreling effect on experimental stress-strain curve for high temperature steel compression test. Journal of
Materials Processing Technology. 2017;243:465-473. DOI: 10.1016/j.jmatprotec.2017.01.012
16. Yao Z, Mei D, Shen H, Chen Z. A Friction Evaluation Method Based on Barrel Compression Test. Tribology Letters. 2013;51(3):525-535. DOI 10.1007/s11249-013-0164-4
17. Duran D, Karadogan C. Determination of Coulomb's Friction Coefficient Directly from Cylinder Compression Tests.
Strojniski Vestnik. 2016;62(4):243-251. DOI: 10.5545/ sv-jme.2015.3141
18. Geuzaine C, Remacle JF. Gmsh: a three-dimensional finite
element mesh generator with built-in pre- and post-processing facilities. International Journal for Numerical Methods in Engineering. 2009;79(11):1309-1331.
19. Dhondt G. CalculiX CrunchiX USER'S MANUAL version 2.7. Available from: <http://web.mit.edu/calculix_v2.7/CalculiX/ ccx_2.7/doc/ccx/index.html>. Access in: 25/04/2018.
20. Dunne F, Petrinic N. Introduction to Computational Plasticity. Oxford: Oxford University Press; 2005.
21. Gordon J. Estructuras o Porque Las Cosas No Se Caen. Madrid: Calamar Ediciones; 2004.
22. Ortiz Berrocal L. Elasticidad. Madrid: McGraw-Hill; 1998.
23. Schackelford JF. Introdución a la Ciencia de Materiales para Ingenieros. Madrid: Pearson; 1995.
24. Torrente-Prato JG. Numerical and experimental studies of compression-tested copper, mortar contact method. Dyna. 2017;84(202):255-262. DOI: 10.15446/dyna.v84n202.61832