Abstract— The purpose of this paper is to present the methodology of experimental strength testing of compressed sawdust under the effect of heat. The subject has been inspired by practical engineering experience in the design of machines for compression of natural materials classified as biomass, the example of which is wood sawdust. It is a structurally complex material and investigation of its strength properties is necessary to determine the critical values depending on the thermo-mechanical properties of the material. The paper presents the test facility designed for experimental testing of shear stresses in loose materials exposed to heat. Moreover, compressed sawdust was tested with the purpose to determine the relationship between the degree of compression and the applied force, the results of which are presented together with the functions illustrating how shear stresses are related to strain and normal stresses. The output of research relates to the processes involved in compression of natural waste materials with the purpose to obtain renewable sources of energy and environment-friendly fuels.
Index Terms— biomass, compression (densification), shear strength, testing methodology.
I. INTRODUCTION
IOMASS includes all biodegradable materials derived from plants or animals. In short we can define biomass as all organic matter which can be found on Earth. The types of biomass range from wood processing waste (wood chips, wood waste, sawdust, bark), farming waste (straw, hay, turf, haulm, nut shells, empty pods, seeds) to municipal and industrial waste. When carefully and efficiently planned biomass combustion does not increase the amount of carbon dioxide and may be an environmentally safe and efficient method of heat and power generation. Depending on the type, biomass materials may be used as an alternative to coal, crude oil, diesel oil or industrial gasses. The subject of this paper is to acquire the information needed for modelling of densification of waste materials, specifically sawdust. The purpose of densification is to increase the material density to facilitate transport, storage and feeding [1,2,3].
The machines used for this are called briquetting press machines. The most popular are mechanically driven piston and rod systems.
I. Malujda is with the Chair of Basics in Machine Design, Poznań
University of Technology, Poland, e-mail: [email protected] K. Talaśka is with the Chair of Basics in Machine Design, Poznań
University of Technology, Poland, e-mail: [email protected]
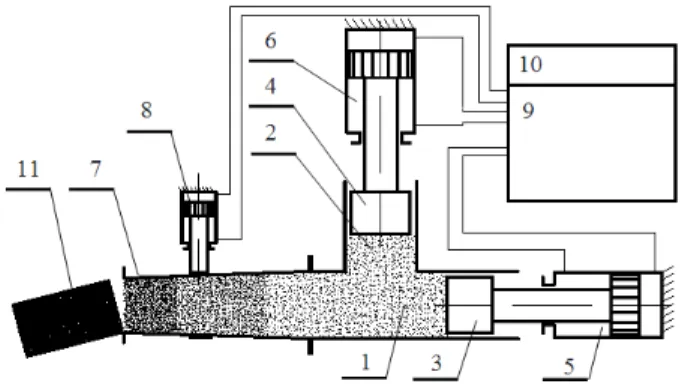
High production rate, which is their main advantage, is obtained at the cost of service lifetime. Compaction by ramming results in relatively quick wearing of the machine parts. There are also briquetting press machines based on hydraulically driven mechanism. This provides the required compaction pressure while eliminating the impacts in the extruding system, which has a good effect on reliability and silent operation of the system (Fig. 1).
Fig. 1 Kinematic diagram of the briquetting mechanism, where: 1 – main chamber, 2 – compression chamber, 3 – main piston, 4 – pre-compression piston, 5 – main cylinder, 6 – pre-pre-compression cylinder, 7 – die, 8 – resistance control device, 9 – hydraulic power unit, 10 – control system, 11 – finished briquette.
The idea underlying the design was to combine together and synchronise the operation of two perpendicular mechanisms: the first one for initial compression and the other one for final compression of the material. The pre-compression mechanism consists of the following components: pre-compression chamber (2), pre-compression piston (4) and hydraulic cylinder (6). The final compression assembly consists of the main chamber (1), main piston (3), hydraulic cylinder (5) and die (7) equipped with compression resistance adjustment device (8). The hydraulic cylinders (5) and (6) are connected with the hydraulic power unit (9) by high pressure tubing. The system is controlled from the control cabinet (10). The design of the main chamber (1) and the die (7) is critical to the processing efficiency. The bore of the main chamber (1) converges at a specific, fixed angle in the direction of travel of the briquette. The other element, the die (7) consists of two pieces, which allows for adjusting the angle of convergence and thus increase pushing resistance. Also the length of travel is relevant, as it determines the time needed to achieve the required cohesion of the finished briquette.
For optimisation, higher production output and better efficiency of machines the above-mentioned processes must be modelled and analysed as precisely as possible. Investigation of the thermo-mechanical properties is
Testing of the Shear Strength of Compressed
Material at Increased Temperature
I. Malujda, K.Tala
ś
ka
B
Proceedings of the World Congress on Engineering 2011 Vol III WCE 2011, July 6 - 8, 2011, London, U.K.
ISBN: 978-988-19251-5-2
ISSN: 2078-0958 (Print); ISSN: 2078-0966 (Online)
prerequisite to defining effective parameters of the shaping process and the relevant machine design requirements.
This paper presents the testing methodology aimed at establishing the strength properties of wood sawdust, in particular in shearing. The fundamental constituent element of a mathematical model describing the process of agglomeration is experimental determination of shear strength of the compressed material.
II. DEFINITIONOFTHETESTEDMATERIAL The specimens were prepared from two types of pinewood sawdust having different densities: A - 1.37kg/m3 and B - 6.55kg/m3. The test material is presented in Fig. 2.
a)
b)
Fig. 2 Pinewood sawdust: a) sawdust A, b) sawdust B.
III. TESTINGMOTHODOLOGY
The objective of testing was to determine the shear stresses in sawdust specimens compressed to different densities and heated to a pre-defined temperature. A special test facility was designed and built and it is presented in Fig. 3 below.
Fig. 3 Test facility for testing of strength parameters of compressed sawdust 1 – hydraulic power unit, 2 – shearing cylinder, 3 – compression cylinder.
The test facility was equipped with an appropriate set of sensors connected to a computer via. data acquisition card.
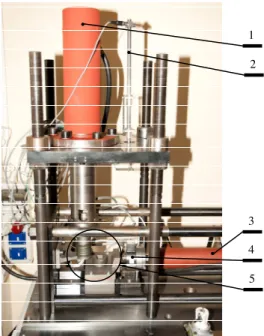
Fig. 4 Test facility for testing of strength properties of compressed sawdust 1 – load cylinder for compression, 2 – cylinder position sensor, 3 – load cylinder for shearing, 4 – shearing force sensor, 5 – shearing assembly.
Fig. 5 presents the shearing assembly where sawdust is compressed, heated up to the pre-defined temperature and finally sheared. A schematic diagram of the test facility is presented in Fig. 6.
Fig. 5 Shearing assembly of the test facility 1 – shear force sensor, 2 – cylinder position sensor, 3 – ball bearing slides, 4 – fixed tube, 5 – moving tube, 6 – upper heating coil, 7 – lower heating coil.
Fig. 6 Schematic diagram of the test facility 1 – rolling-element bearing, 2 – moving tube, 3 – compressed sawdust, 4 – fixed tube, 5 – compression piston, 6 – compression force, 7 – shear force, 8 – upper heating element, 9 – temperature sensor 1, 10 – temperature sensor 2, 11 – temperature sensor 3, 12 – lower heating element.
The extrusion die consists of the moving tube (2) and the fixed tube (4) forming a chamber enclosed with the compression piston (5). As soon as sawdust is fed into the tube the compression piston is pushed downwards by cylinder thus compressing the material. It is the force applied by the compression piston that determines the compression ratio of the material. The pressure of oil is continuously measured in the cylinder chamber, which allows determination of the compression force on the basis
1 2
3 4
6
5
7
1
2
5 4 3
1 2 3
Proceedings of the World Congress on Engineering 2011 Vol III WCE 2011, July 6 - 8, 2011, London, U.K.
ISBN: 978-988-19251-5-2
ISSN: 2078-0958 (Print); ISSN: 2078-0966 (Online)
of the piston surface area. Moreover, piston travel is recorded by the position sensor (2) (Fig. 4). Following compression sawdust is heated up to the desired temperature with heating elements (8) and (12). Temperature sensors (10) and (11) are fitted on both tubes to monitor the temperature during heating up. Each series of tests was preceded by determination of the amount of time required for stabilisation of temperature throughout the specimen and for this purpose an auxiliary sensor (9) was inserted into the specimen. When the time needed for heating up to the desired temperature and compression ratio were determined, sensor (9) was no longer needed and, therefore, omitted in the subsequent tests. Shearing took place as soon as the conditions have stabilised. Then the moving tube (2) was set in motion by the cylinder in relation to the fixed tube (4), shearing the specimen on the way. The value of shear force and travel of the shear cylinder were recorded during the test to derive the shear stress-strain curve. The specimen had cross-section area of 20 mm x 30 mm. The specimen height was also controlled to measure ca. 40 mm, split equally between the fixed and moving tubes. In order to eliminate random (a.k.a. accidental) errors the tests were done in series of at least 3 No. each [5,6].
IV. TESTSRESULTSANDTHEIRANALYSIS The tests allowed determination of the compression ratio in relation to the compression force. This relationship is presented in Fig. 7.
Fig. 7 Compression ratio vs. compression force.
Fig. 8 Shearing of sawdust B at 200C with a shear force of 39.25kN.
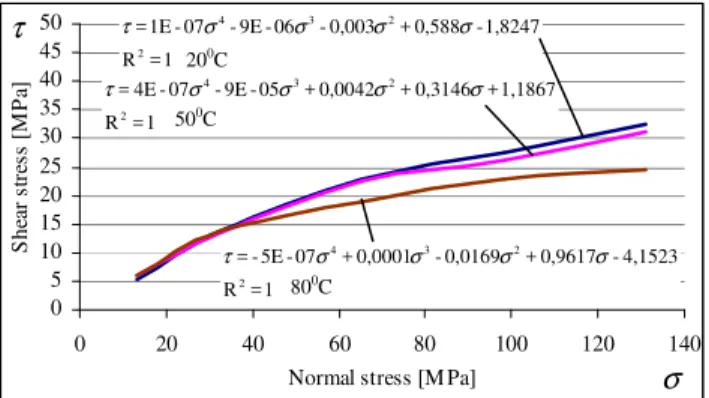
The relationships between shear and normal stresses at different temperatures are represented by the respective curves in Fig 9 (sawdust B) and Fig. 10 (sawdust A).
Fig. 9 Shear stresses vs. normal stresses in sawdust B at different temperatures.
Fig. 10 Shear stresses vs. normal stresses in sawdust A at different temperatures.
The above curves show a characteristic decrease of shear stresses with the increase of temperature. The effect of the initial density of sawdust on the value of shear stresses is also evident. Specimens of sawdust type B featuring higher initial density have lower shear strength, in particular at higher temperatures. This is related to the decrease of the strength of wood itself at higher temperatures, as it has been shown by the earlier testing of solid wood specimens. The test results were subjected to measurement error analysis with the following formula [4]:
∑
= ∆
= n
i i i
i x x a y dy 1 (1)
V. FINALCONCLUSIONS
The research results presented in this paper are part of a wider testing programme focusing on strength properties of compressed materials and covering also determination of the friction coefficient between compressed sawdust and the relevant contact surfaces in the process of extrusion of briquette. Also the effect of heat was investigated. The testing methodology presented in this paper may be used as a reference in planning of strength testing of similar materials. Moreover, the results given in this paper may help understand how the shear strength of wood sawdust changes with the increase of temperature. The resulting material functions presented in Figs. 7, 8, 9 were used in the mathematical model describing the processes involved in compression of crushed natural materials. This model allows determination of the critical force depending on the thermo-mechanical properties of the material and the main process parameters, whose value defines the effectiveness of the softening process. The force value obtained in this way is used as the primary design input parameter and the model
0 5 10 15 20 25 30 35 40 45 50
0 20 40 60 80 100 120 140
Normal stress [M Pa]
S h ea r st re ss [ M P a] 1 = R 4,1523 -0,9617 + 0,0169 -0,0001 + 07 -5E -= 2 2 3
4 σ σ σ
σ τ 1 = R 1,1867 + 0,3146 + 0,0042 + 05 -9E -07 -4E = 2 2 3
4 σ σ σ
σ τ 1 = R 1,8247 -0,588 + 0,003 -06 -9E -07 -1E = 2 2 3
4 σ σ σ
σ τ
200C
500C
800C
σ τ 0 5 10 15 20 25 30 35 40 45 50
0 20 40 60 80 100 120 140
Normal st ress [MP a]
S h e a r st re ss [ M P a ] σ τ 1 = R 3,8485 -0,9608 + 0,0163 -0,0001 + 07 -3E -= 2 σ σ σ σ τ 1 = R 4,0443 -0,9407 + 0,0157 -0,0001 + 07 -4E -= 2 3
4 σ σ σ
σ τ 1 = R 1,2333 -0,6517 + 0,0072 -05 -4E + 08 -4E -= 2
3 σ σ
σ σ τ
200C
500C
800C
0 5 10 15 20 25
0 0,05 0,1 0,15 0,2 0,25
Strain [%] S h e ar s tr e ss [ M P a] ε τ 0,9972 = R 0,7473 + 309,18 + 1745,2 -3380,7 = 2 2
3 ε ε
ε τ 0 5 10 15 20 25 30 35 40
0 20 40 60 80
Comp ression force P [kN]
C o m p re ss io n r at io X Sawdust A Sawdust B 978 . 0 2292 . 0 ) ln( 7157 . 2 2= − = R P X 1 R 2.4982 + 2.302P + 0.0706P -0.001P + 06P --5E 2 2 3 4 = = X
Proceedings of the World Congress on Engineering 2011 Vol III WCE 2011, July 6 - 8, 2011, London, U.K.
ISBN: 978-988-19251-5-2
ISSN: 2078-0958 (Print); ISSN: 2078-0966 (Online)
developed in this research may be used in numerical simulations and calculations.
REFERENCES
[1] Franz F.P. Kollmann, Wilfred A. Cote Jr.: Principles of wood science and technology: Solid wood, Springer – Verlag Berlin Heidelberg, New York 1968.
[2] Hobler, T., Heat transfer and heat exchangers, WNT Press, Warszawa 1968 (in Polish).
[3] Kania S.: Flow heat in wood materials; Wrocław University of Technology, Wrocław, Poland 1990 (in Polish).
[4] Kokociński W.: Wood, measurements of physical and mechanical
features; Published by PRODRUK, Poznań, Poland 2004 (in Polish).
[5] Malczewski J.: Mechanics of loose materials. Warsaw University of Technology, Warsaw 1994, (in Polish).
[6] Malujda I.: Plasticization of a bounded layer of anisotropic and loose material, XI International Conference Komputer Simulation In Machine Design – COSIM, Krynica Zdrój, 2006.
Proceedings of the World Congress on Engineering 2011 Vol III WCE 2011, July 6 - 8, 2011, London, U.K.
ISBN: 978-988-19251-5-2
ISSN: 2078-0958 (Print); ISSN: 2078-0966 (Online)