Dietary lipid level affects growth performance and nutrient utilisation
of Senegalese sole (Solea senegalensis) juveniles
Pedro Borges
1,2, Beatriz Oliveira
2, Susana Casal
2, Jorge Dias
3, Luis Conceic¸a˜o
3and Luı´sa M. P. Valente
1*
1CIMAR/CIIMAR, Centro Interdisciplinar de Investigac¸a˜o Marinha e Ambiental and ICBAS, Instituto de Cieˆncias Biome´dicas de
Abel Salazar, Universidade do Porto, Rua dos Bragas, 177, 4050-123 Porto, Portugal
2REQUIMTE, Servic¸o de Bromatologia, Faculdade de Farma´cia da Universidade do Porto, R. Anı´bal Cunha 164, 4050-047 Porto,
Portugal
3CIMAR/CCMAR, Centro de Cieˆncias do Mar do Algarve, Universidade do Algarve, Campus de Gambelas, 8005-139 Faro,
Portugal
(Received 19 January 2009 – Revised 9 March 2009 – Accepted 12 March 2009 – First published online 27 April 2009)
Over the last few years, several aspects of Senegalese sole (Solea senegalensis) culture have been developed and optimised but the dietary lipid level for optimal growth has never been determined. Hence, five isonitrogenous diets (56 % dietary protein) with increasing dietary lipid levels (4, 8, 12, 16 and 20 % DM) were fed to satiation to triplicate groups of twenty fish (mean initial weight 10 g). Fifteen tanks were randomly assigned one of the five diets. Feed was distributed using automatic feeders, and fish were fed over a 16-week period. At the end of the experiment the fish fed on diets containing the two lowest dietary lipid levels (4 and 8 %) showed a 3-fold body-weight increase with a significantly higher daily growth index than fish fed higher lipid levels (1·2 v. 0·8). Moreover, these fish displayed a significantly lower dry feed intake (12 g/kg per d) and feed conversion ratio (1·0) compared with fish fed higher lipids levels (16 – 19 g/kg per d; feed conversion ratio 2·0). Low dietary lipid levels (, 12 %) significantly improved nutrient retention and gain and hence growth, without major effects on whole-body composition. Despite the slight alteration in n-3 PUFA muscle content in the fish fed low-fat-diets, this fish fed low dietary lipid still remains a rich n-3 PUFA product and generally maintained its nutritional value. These results evidenced a low lipid tolerance of Senegalese sole juveniles and suggest a maximal dietary inclusion level of 8 % lipids for both optimal growth and nutrient utilisation without compromising flesh quality.
Lipid nutrition: Flatfish: Dietary lipid tolerance: Protein-sparing effect
The aquaculture industry has expanded in Europe over the last decades, but few marine fish species have contributed to this growth. The successful development of Southern European aquaculture has resulted in increased production of gilthead seabream (Sparus aurata), sea bass (Dicentrarchus labrax) and turbot (Psetta maxima), leading to market saturation and reduced prices. For these reasons, great efforts have recently been devoted to find new candidate species, to improve diver-sity and to ensure sustainable development of the industry.
Senegalese sole (Solea senegalensis) is a promising flatfish species for marine farming, especially due to its high market value. Over the last few years significant advances have been accomplished on Senegalese sole weaning techniques
and larvae feeding(1 – 3). However, little is known about the
nutritional needs of this flatfish species during its juvenile
stage(4,5). The protein requirement for maximum protein
accretion in Senegalese sole has been estimated at 600 g/kg
diet(5), but, so far, no studies concerning the optimal dietary
lipid level have been carried out.
Dietary formulations in aquaculture tend to increase lipid content as a non-protein source for enhancing growth and
sparing protein, and for reducing organic matter and N
losses(6 – 10). Nevertheless, in flatfish species positive results
on protein sparing are limited and controversial. High dietary lipids enhanced growth and protein utilisation in plaice
(Pleur-onectes platessa)(11), whereas no beneficial effects were
reported in halibut (Hippoglossus hippoglossus)(12 – 17) and
Senegalese sole(4). Moreover, turbot (Psetta maxima and
Scophtalmus maximus) was negatively affected by dietary
lipids(17,18).
The quantity, quality and body fat stores vary widely among fish species and mainly depend on dietary factors. In salmo-nids, fat deposition occurs mainly in the viscera and to a
lesser extent in the muscle(19), whereas in flatfish species,
such as turbot, the marginal body parts and subdermal fat
con-stitute the most important lipid deposition sites(18,20).
Increas-ing the dietary lipid levels can alter body composition and slaughter quality, particularly through an increase in lipid
deposition(11 – 12,16,19) affecting flesh organoleptic properties
and final consumer’s acceptance.
The aim of the present study was to determine the optimal dietary lipid level that can simultaneously improve growth
* Corresponding author: Dr Luı´sa M. P. Valente, fax þ 351 22 340 18 38, email [email protected] Abbreviations:HF, high-fat; LF, low fat.
qThe Authors 2009
British
Journal
of
Nutrition
https://www.cambridge.org/core . Universidade do Algarve , on 10 Sep 2019 at 16:26:27, subject to the Cambridge Core terms of use, available at
https://www.cambridge.org/core/terms
.
without compromising final flesh quality in Senegalese sole juveniles. The effects of increasing dietary lipid levels (4 to 20 %) on growth, feed efficiency, whole-body composition, nutrient and energy retention and tissue lipid deposition were evaluated in Senegalese sole juveniles over a 16-week period.
Materials and methods Experimental diets
Five isonitrogenous (56 % DM) experimental diets were for-mulated to contain increasing lipid levels (4, 8, 12, 16 and 20 % DM; L4, L8, L12, L16 and L20, respectively). The diet-ary protein fraction was achieved by means of a variable blend of practical ingredients such as fishmeal, soyabean meal, maize gluten and wheat gluten, whereas increasing lipid levels were obtained by increasing fish oil inclusion.
Ingredients and proximate composition are presented in Table 1. Ingredients were finely ground, mixed and pelleted dry without steaming using a laboratory pelleting machine (C-300 model; California Pellet Mill, San Francisco, CA, USA) with a 2·0 mm die. The diets were dried at 378C for 24 h and stored in a refrigerator (4 ^ 18C) until use.
Growth trial
Experiments were directed by trained scientists (following FELASA category C recommendations) and were conducted according to the European Economic Community animal experimentation guidelines directive of 24 November 1986 (86/609/EEC). The study was performed at the experimental facilities of CIIMAR (Porto, Portugal), with Senegalese sole (Solea senegalensis) juveniles supplied from a commercial fish farm (Alrogal, La Corun˜a, Spain). After arrival at the
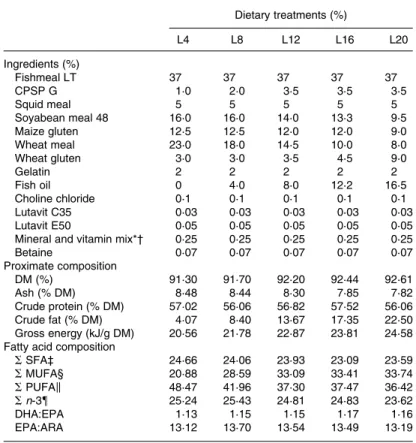
Table 1. Ingredients, proximate composition and fatty acid composition (g/100 g fatty acids) of the experimental diets with different levels of dietary lipids
Dietary treatments (%) L4 L8 L12 L16 L20 Ingredients (%) Fishmeal LT 37 37 37 37 37 CPSP G 1·0 2·0 3·5 3·5 3·5 Squid meal 5 5 5 5 5 Soyabean meal 48 16·0 16·0 14·0 13·3 9·5 Maize gluten 12·5 12·5 12·0 12·0 9·0 Wheat meal 23·0 18·0 14·5 10·0 8·0 Wheat gluten 3·0 3·0 3·5 4·5 9·0 Gelatin 2 2 2 2 2 Fish oil 0 4·0 8·0 12·2 16·5 Choline chloride 0·1 0·1 0·1 0·1 0·1 Lutavit C35 0·03 0·03 0·03 0·03 0·03 Lutavit E50 0·05 0·05 0·05 0·05 0·05
Mineral and vitamin mix*† 0·25 0·25 0·25 0·25 0·25
Betaine 0·07 0·07 0·07 0·07 0·07 Proximate composition DM (%) 91·30 91·70 92·20 92·44 92·61 Ash (% DM) 8·48 8·44 8·30 7·85 7·82 Crude protein (% DM) 57·02 56·06 56·82 57·52 56·06 Crude fat (% DM) 4·07 8·40 13·67 17·35 22·50 Gross energy (kJ/g DM) 20·56 21·78 22·87 23·81 24·58 Fatty acid composition
SSFA‡ 24·66 24·06 23·93 23·09 23·59 SMUFA§ 20·88 28·59 33·09 33·41 33·74 SPUFAk 48·47 41·96 37·30 37·47 36·42 Sn-3{ 25·24 25·43 24·81 24·83 23·62 DHA:EPA 1·13 1·15 1·15 1·17 1·16 EPA:ARA 13·12 13·70 13·54 13·49 13·19
LT, low temperature; CPSP G, fish soluble protein concentrate (hydrolysed fishmeal); ARA, arachidonic acid.
* Vitamins (per kg diet): vitamin A, 8000 IU (2·4 mg); vitamin D3, 1700 IU (0·04 mg); vitamin K3, 10 mg; vitamin B12, 0·02 mg; vitamin B1, 8 mg; vitamin B2, 20 mg; vitamin B6, 10 mg; folic acid, 6 mg; biotin, 0·7 mg; inositol, 300 mg; nicotinic acid, 70 mg; pantothenic acid, 30 mg; vitamin E (Lutavin E50), 300 mg; vitamin C (Lutavin C35), 500 mg; betaine (Betafin S1), 500 mg.
† Minerals (per kg diet): Mn (manganese oxide), 20 mg; I (potassium iodide), 1·5 mg; Cu (copper sulfate), 5 mg; Co (cobalt sulfate), 0·1 mg; Mg (magnesium sulfate), 500 mg; Zn (zinc oxide), 30 mg; Se (sodium selenite), 0·3 mg; Fe (iron sulfate), 60 mg; Ca (calcium carbonate), 2·15 g; dibasic calcium phosphate, 5 g; KCl, 1 g; NaCl, 0·4 g.
‡ S SFA ¼ sum of 12 : 0, 14 : 0, 15 : 0, 16 : 0, 17 : 0, 18 : 0, 20 : 0, 22 : 0 and 24 : 0. § S MUFA ¼ sum of 16 : 1, 18 : 1, 20 : 1 and 22 : 1.
k S PUFA ¼ sum of 18 : 2n-6, 18 : 3n-6, 18 : 3n-3, 20 : 2n-6, 20 : 3n-3, 20 : 6, 20 : 5n-3, 22 : 4n-6, 22 : 5n-3 and 22 : 6n-3. { S n-3 ¼ sum of 18 : 3n-3, 20 : 3n-3, 20 : 5n-3, 22 : 5n-3 and 22 : 6n-3.
British
Journal
of
Nutrition
https://www.cambridge.org/core . Universidade do Algarve , on 10 Sep 2019 at 16:26:27, subject to the Cambridge Core terms of use, available at
https://www.cambridge.org/core/terms
.
experimental unit fish were acclimatised to the new rearing facilities for 2 weeks. For each treatment, triplicate groups
of twenty fish (average initial body weight 9·9 (SD 1·8) g)
were distributed among fifteen fibreglass tanks (50 £ 35 cm;
initial fish density 1 kg/m2). Each tank was supplied with
filtered, heated (20 ^ 18C) seawater (30 ‰), at a flow rate of 2 litres per min. The most important physical and chemical parameters (temperature, dissolved O2, salinity, pH and nitrogenous compounds) were monitored during the entire trial and maintained at levels within limits recommended for marine species. Fish were exposed to an artificial photoperiod of 12 h light – 12 h dark. At the beginning and end of the exper-iment individual fish weights were recorded. Fish were fed by automatic feeders 24 h per d. The ration offered was daily adjusted based on the feed losses in each tank. Each day, all tanks were monitored to be certain that all feed was eaten and hence, no feed lost was registered. When some uneaten food remained in the bottom of the tank, the total amount of feed distributed each day was reduced by 10 %, until no feed losses were recorded. When no feed losses were observed the amount of food was maintained for 4 d and then augmen-ted 10 % during all the experiment.
At the beginning of the experiment, a pooled sample of ten fish from the initial stock was sampled and stored at 2 208C for subsequent whole-body composition analysis. Liver and viscera weights were also recorded. At the end of the trial, four fish from each tank were sampled for the same purpose. Liver, viscera, dorsal muscle and skin were removed from
three fish per tank, frozen in liquid N2 and stored at 2 808C
for lipid analysis. All fish sampled were killed by a sharp blow on the head.
Analytical methods
Whole fish from each tank were ground, pooled and moisture content was determined (1058C for 24 h). Fish and tissues were subsequently freeze-dried before further analysis. Feed and whole-body samples were analysed for ash by combustion in a muffle furnace (Nabertherm L9/11/B170; Bremen, Germany; 5508C for 6 h), crude protein (Kjeldatherm TR and Vapodest 40; Gerhardt, Ko¨nigswinter, Germany; micro-Kjeldahl; N £ 6·25) after acid digestion, lipid content by pet-roleum ether extraction using a Soxtherm Multistat/SX PC (Gerhardt, Ko¨nigswinter, Germany; 40 – 608C) and gross energy in an adiabatic bomb calorimeter (Werke C2000; IKA, Staufen, Germany).
The extraction of total lipids in diets and tissues was carried
out following the Folch et al.(21)method with chloroform –
methanol (2:1) and gravimetric determination. Liver, viscera, muscle and skin samples were analysed individually. Fatty acid methyl esters (FAME) were prepared by acid-catalysed transmethylation of total lipids using boron trifluoride
metha-nol according to Shantha & Ackman(22)and were analysed in
a Chrompack CP 9001 gas chromatograph (Middelburg, The Netherlands). The chromatograph was equipped with a CP-Sil 88 fused silica capillary column (Varian, Middelburg, The Netherlands; 50 m £ 0·25 mm internal diameter, film thickness 0·2 mm). The gas carrier used was He (120 kPa) and the thermal gradient was 58 minimum at 1408C, 1408C to 2208C at 58C per min and a constant temperature of 2208C during 15 min. Injector and detector temperatures
were 2508C and 2708C, respectively. FAME were identified by comparison with standard mixtures (FAME 37 and PUFA 3; Supelco, Bellefonte, PA, USA) and data analysed using CP-Maitre software (version 2.5; Chrompack Inter-national, Bergen op Zoom, The Netherlands).
Statistical analysis
Statistical analyses followed methods outlined by Zar(23). All
data were tested for homogeneity of variances by Levene’s tests, and then submitted to a one-way ANOVA with the SPSS 15.0 package (SAS Institute, Inc., Cary, NC, USA). When data did not meet the assumptions of ANOVA, the non-parametric ANOVA equivalent (Kruskal – Wallis test) was performed. When these tests showed significance, individ-ual means were compared using Tukey or Mann – Whitney tests. Significant differences were considered when P# 0·05. Results
At the end of the trial (112 d) average body weight showed a threefold increase for all dietary treatments. Final body weight, daily growth index, feed conversion ratio, protein effi-ciency ratio and nutrient intake are summarised in Table 2. High-fat (HF) diets (L12, L16 and L20) resulted in significant lower final body weight (29 – 33 g) when compared with the two low-fat (LF) diets (L4 and L8) (about 43 g). Daily growth index varied between 0·8 and 1·2 and was significantly affected by dietary lipid levels. Fish fed the HF diets showed significantly lower growth rates compared with those fed the LF diets.
Feed conversion ratio values ranged from 1·0 (L4) to 2·2 (L20) with fish fed L4 and L8 showing the best feed conver-sion ratio and fish fed L20 being significantly less efficient than all the others. Protein efficiency ratio varied from 0·8 to 1·7 with the highest and lowest values being, again, found in fish fed the LF (L4 and L8) and L20 diets, respect-ively. DM intake varied significantly among treatments, increasing with the lipid dietary level, and hence affecting significantly the intake of all other nutrients. The LF diets displayed the lowest nutrient intake, whereas fish fed L20 showed an opposite trend.
At the end of the trial, whole-body moisture, energy and ash contents were similar among treatments (Table 3). However, fish fed L16 or L20 displayed significantly lower whole-body protein than fish fed L8, and higher lipid content than fish fed L4. Nutrient and energy retention (Table 3) were sig-nificantly affected by the inclusion of dietary fat. Fish fed the LF diets displayed higher protein, lipid and energy retention than those fed the HF diets. A similar trend was observed for protein, but not for lipid gain.
The hepatosomatic index varied from 0·8 to 1 % and liver lipid content ranged from 8·0 to 10·1 %. The hepatosomatic index was significantly higher in fish fed L16 than in those fed the L8 and L12 diets. The viscerosomatic index varied from 2·1 to 3·6 % and was significantly higher in fish fed the HF diets than in those fed the LF ones (Table 4).
Senegalese sole muscle, liver and viscera lipid content are reported in Table 4. Skin and intestine were the preferential tissues for lipid deposition. Dietary lipid level significantly affected viscera and skin, but not muscle or liver lipid
British
Journal
of
Nutrition
https://www.cambridge.org/core . Universidade do Algarve , on 10 Sep 2019 at 16:26:27, subject to the Cambridge Core terms of use, available at
https://www.cambridge.org/core/terms
.
contents. Viscera fat content ranged from 3·3 to 7·7 % wet weight whereas skin fat values varied from 1·7 to 2·3 % wet weight, and significant differences were observed among treat-ments. Fish fed the L16 and L20 diets presented significantly higher viscera and skin lipid contents than those fed with L4. Although muscle total lipids did not vary among dietary treat-ments, the muscle of fish fed the L4 diet exhibited signifi-cantly higher percentages of SFA when compared with the muscle of fish fed the other diets (26 v. about 23 – 24 %). A totally different trend was observed in MUFA, with values
ranging from 22 to 29 %, and L12 exhibiting the highest con-tent. Moreover, neither PUFA nor DHA:EPA and EPA:arachi-donic acid ratios were affected by the dietary lipid levels, whereas n-3 fatty acids were highest in fish fed L20.
Discussion
At the end of the growth trial, final body weight was about tri-plicate in all treatments, and dietary lipid levels higher than 8 % were shown to significantly depress growth performance
Table 3. Whole-body composition, nutrient retention and gain of Senegalese sole (Solea senegalensis) fed increasing dietary lipid levels for 112 d*
(Mean values and standard deviations (n 3))
L4 L8 L12 L16 L20
Dietary treatment. . .
Mean SD Mean SD Mean SD Mean SD Mean SD
Whole-body composition
Moisture (% wet weight) 76·43 0·80 75·07 1·28 76·25 0·63 76·56 0·66 75·65 0·27
Ash (% wet weight) 1·79 0·19 1·73 0·27 1·89 0·41 1·63 0·16 1·59 0·08
Protein (% wet weight) 17·69a,b 0·35 18·24a 1·04 16·93a,b 0·47 15·98b 0·54 16·18b 0·42
Lipids (% wet weight) 3·72b 0·22 5·02a,b 0·44 5·14a,b 0·10 5·69a 0·84 5·84a 0·66
Energy (kJ/g wet weight) 5·61 0·13 6·17 0·33 5·82 0·03 5·85 0·38 5·98 0·11
Retention (% feed intake)†
DM 22·57a 0·12 21·92a 1·36 14·19b 0·21 13·71b 0·63 11·34b 1·12
Protein 30·23a 0·61 28·89a 2·07 17·87b 0·25 15·97b,c 0·42 12·99c 1·63
Lipids 82·47a 1·84 53·57b 4·67 23·9c 1·95 21·24c 4·19 13·47c 1·8
Energy 26·14a 0·50 25·14a 1·43 15·39b 0·72 14·65b,c 1·32 11·50c 1·04
Gain‡
DM (g/kg ABW per d) 2·61a,b 0·08 2·78a 0·16 2·25b,c 0·12 2·19b,c 0·16 2·10c 0·18
Protein (g/kg ABW per d) 2·00a 0·09 2·06a 0·13 1·61b 0·08 1·47b 0·07 1·35b 0·15
Lipids (g/kg ABW per d) 0·39 0·001 0·57 0·07 0·52 0·01 0·59 0·13 0·56 0·09
Energy (kJ/kg ABW per d) 0·62a,b 0·03 0·70a 0·05 0·56a,b 0·01 0·56a,b 0·06 0·52b 0·05
ABW, average body weight.
a,b,cMean values within a row with unlike superscript letters were significantly different (P, 0·05).
* Initial body composition was: moisture, 75·65 % wet weight; ash, 2·49 % wet weight; protein, 17·22 % wet weight; lipids, 4·53 % wet weight; energy, 5·81 kJ/g wet weight.
† Retention ¼ 100 £ (final body weight £ final carcass nutrient content 2 initial body weight £ initial carcass nutrient content)/nutrient intake. ‡ Nutrient gain ¼ (nutrient in final carcass 2 nutrient in initial carcass)/average body weight/days.
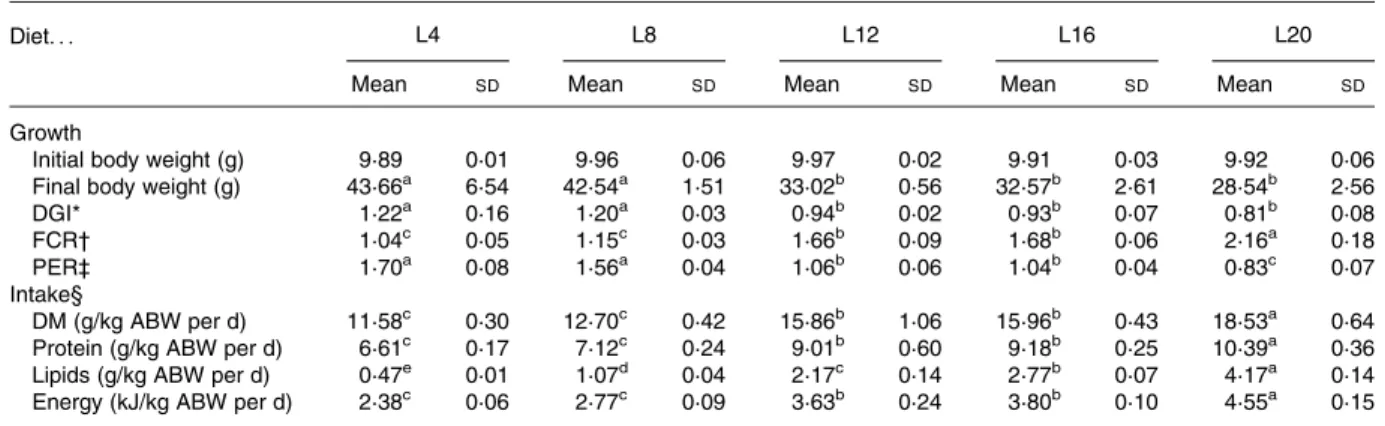
Table 2. Effect of different dietary lipids in Senegalese sole (Solea senegalensis) growth and intake after 112 d (Mean values and standard deviations (n 3))
L4 L8 L12 L16 L20
Diet. . .
Mean SD Mean SD Mean SD Mean SD Mean SD
Growth
Initial body weight (g) 9·89 0·01 9·96 0·06 9·97 0·02 9·91 0·03 9·92 0·06
Final body weight (g) 43·66a 6·54 42·54a 1·51 33·02b 0·56 32·57b 2·61 28·54b 2·56
DGI* 1·22a 0·16 1·20a 0·03 0·94b 0·02 0·93b 0·07 0·81b 0·08
FCR† 1·04c 0·05 1·15c 0·03 1·66b 0·09 1·68b 0·06 2·16a 0·18
PER‡ 1·70a 0·08 1·56a 0·04 1·06b 0·06 1·04b 0·04 0·83c 0·07
Intake§
DM (g/kg ABW per d) 11·58c 0·30 12·70c 0·42 15·86b 1·06 15·96b 0·43 18·53a 0·64 Protein (g/kg ABW per d) 6·61c 0·17 7·12c 0·24 9·01b 0·60 9·18b 0·25 10·39a 0·36 Lipids (g/kg ABW per d) 0·47e 0·01 1·07d 0·04 2·17c 0·14 2·77b 0·07 4·17a 0·14 Energy (kJ/kg ABW per d) 2·38c 0·06 2·77c 0·09 3·63b 0·24 3·80b 0·10 4·55a 0·15 DGI, daily growth index; FCR, feed conversion ratio; PER, protein efficiency ratio; ABW, average body weight.
a – eMean values within a row with unlike superscript letters were significantly different (P, 0·05). * DGI ¼ 100 £ ((final body weight)1/3
2(initial body weight)1/3)/days. † FCR ¼ dry feed intake/weight gain.
‡ PER ¼ weight gain/crude protein intake.
§ Nutrient intake ¼ nutrient intake/average body weight ((initial body weight þ final body weight)/2)/days.
British
Journal
of
Nutrition
https://www.cambridge.org/core . Universidade do Algarve , on 10 Sep 2019 at 16:26:27, subject to the Cambridge Core terms of use, available at
https://www.cambridge.org/core/terms
.
(final body weight and daily growth index). In spite of the dietary protein fraction being achieved by means of a variable blend of practical ingredients such as fishmeal, soyabean meal, maize gluten and wheat gluten, the higher inclusion of veg-etable protein sources in the LF diets improved growth and nutrient retention, suggesting a good acceptance of plant sources by solea juveniles. Therefore, the observed differences in growth performance among treatments seem to be mainly due to the dietary lipid levels. This is in agreement with pre-vious studies in turbot that reported a decline in growth rate with diets containing increasing dietary fat levels either in
juvenile(17)or commercial-sized fish(18). A growth depression
was also observed when halibut juveniles were fed a diet
con-taining 30 % lipid and a low level of carbohydrates(15).
Never-theless, increasing dietary fat levels from 11 % to 21 % in
Senegalese sole juveniles during 90 d(4) or from 8 to 28 % in
different Atlantic halibut size classes did not seem to affect
growth performance(12 – 14,16,24). Unlike salmonids or marine
fish species where a protein-sparing effect has been clearly
demonstrated(6 – 8,10,25), no beneficial effects on overall
growth performance were observed in Senegalese sole juven-iles fed high dietary lipid levels.
The high nutrient intake (12 – 19 g/kg average body weight per d) and low feed conversion ratio (1 – 2) values observed in this trial reflect the good acceptability of the diets by
sole. Dias et al.(4) reported similar growth performance of
Senegalese sole juveniles fed either 11 or 21 % lipids for 90 d, although the registered feed conversion ratio (2·4 – 3) was clearly inferior to that observed in the present stsudy. The 11 % fat included in those diets did not induce significant differences among dietary treatments, although a slight decrease in weight gain was also noticed in fish fed 21 % lipids. This trend could have resulted in significant differences
among dietary treatments if a longer trial duration had been carried out. The high feed conversion ratio values could be related to distinct feeding protocols. In its natural habitat sole remains inactive and buried in the sand the whole day, and carries out all its activity, particularly feeding, during
the night(26). Hence, instead of feeding animals 18 h per d as
adopted by Dias et al.(4) it seems advisable to feed fish 24 h
per d to achieve maximal growth performance and improve feed conversion. In the present trial, the dietary lipid levels strongly affected both intake and nutrient utilisation, the LF diets being the most efficient in displaying the lowest nutrient intake but best feed conversion ratio and protein efficiency ratio. In fact, the increase in the input of non-protein energy substrates has a deleterious effect on fish growth performance which seems to be related to their poor utilisation by Senega-lese sole.
Senegalese sole is considered a lean fish with low
whole-body fat contents (, 6 %)(4,5). In the present study
whole-body lipid content varied from 4 to 6 %, with the L4 diet inducing significantly lower whole-body fat content than L16 and L20 diets. Similarly, in turbot such an effect has been observed when dietary fat levels increased from 10 to
25 %(17). Dias et al.(4) has also reported an increased fat
content in sole fed HF diets (10 v. 21 %), but only when
associated with low-digestible carbohydrates. Increased
whole-body fat content due to an increase in dietary fat has
been widely reported in salmonids(8), or other marine teleosts,
such as seabass(27), gilthead sea bream(28) or Atlantic
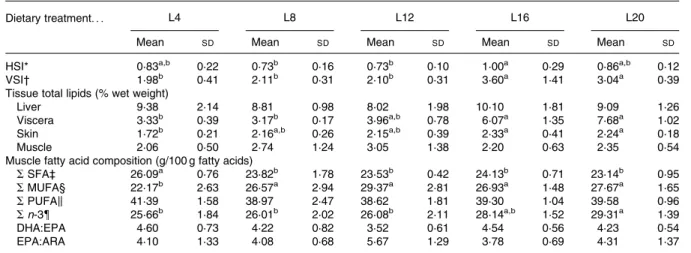
hali-but(12,13,16), although all these species display significantly higher whole-body fat contents compared with sole. Increas-ing dietary lipid levels in Senegalese sole resulted in decreased lipid retention, but without any significant effects on fat gain. On the other hand, both protein gain and retention Table 4. Somatic indexes (%), tissue total lipids and muscle fatty acids classes of Senegalese sole (Solea senegalensis) fed increasing dietary lipid levels for 112 d
(Mean values and standard deviations (n 6, except for somatic indexes, where n 9))
L4 L8 L12 L16 L20
Dietary treatment. . .
Mean SD Mean SD Mean SD Mean SD Mean SD
HSI* 0·83a,b 0·22 0·73b 0·16 0·73b 0·10 1·00a 0·29 0·86a,b 0·12
VSI† 1·98b 0·41 2·11b 0·31 2·10b 0·31 3·60a 1·41 3·04a 0·39
Tissue total lipids (% wet weight)
Liver 9·38 2·14 8·81 0·98 8·02 1·98 10·10 1·81 9·09 1·26
Viscera 3·33b 0·39 3·17b 0·17 3·96a,b 0·78 6·07a 1·35 7·68a 1·02
Skin 1·72b 0·21 2·16a,b 0·26 2·15a,b 0·39 2·33a 0·41 2·24a 0·18
Muscle 2·06 0·50 2·74 1·24 3·05 1·38 2·20 0·63 2·35 0·54
Muscle fatty acid composition (g/100 g fatty acids)
SSFA‡ 26·09a 0·76 23·82b 1·78 23·53b 0·42 24·13b 0·71 23·14b 0·95 SMUFA§ 22·17b 2·63 26·57a 2·94 29·37a 2·81 26·93a 1·48 27·67a 1·65 SPUFAk 41·39 1·58 38·97 2·47 38·62 1·81 39·30 1·04 39·58 0·96 Sn-3{ 25·66b 1·84 26·01b 2·02 26·08b 2·11 28·14a,b 1·52 29·31a 1·39 DHA:EPA 4·60 0·73 4·22 0·82 3·52 0·61 4·54 0·56 4·23 0·54 EPA:ARA 4·10 1·33 4·08 0·68 5·67 1·29 3·78 0·69 4·31 1·37
HSI, hepatosomatic index; VSI, viscerosomatic index; ARA, arachidonic acid.
a,bMean values within a row with unlike superscript letters were significantly different (P, 0·05). * HSI ¼ 100 £ (liver weight/body weight) (%).
† VSI ¼ 100 £ (viscera weight/body weight) (%).
‡ S SFA ¼ sum of 12 : 0, 14 : 0, 15 : 0, 16 : 0, 17 : 0, 18 : 0, 20 : 0, 22 : 0 and 24 : 0. § S MUFA ¼ sum of 16 : 1, 18 : 1, 20 : 1 and 22 : 1.
k S PUFA ¼ sum of 18 : 2n-6, 18 : 3n-6, 18 : 3n-3, 20 : 2n-6, 20 : 3n-3, 20 : 4n-6, 20 : 5n-3, 22 : 4n-6, 22 : 5n-3 and 22 : 6n-3. { S n-3 ¼ sum of 18 : 3n-3, 20 : 3n-3, 20 : 5n-3, 22 : 5n-3 and 22 : 6n-3.
British
Journal
of
Nutrition
https://www.cambridge.org/core . Universidade do Algarve , on 10 Sep 2019 at 16:26:27, subject to the Cambridge Core terms of use, available at
https://www.cambridge.org/core/terms
.
were improved by the decrease in dietary lipid. In contrast,
Dias et al.(4) observed that Senegalese sole fed diets with
20 % dietary lipids showed similar protein gain but a signifi-cantly higher fat gain (P, 0·05) when compared with fish fed diets with 10 % lipids. Similarly, in other flatfishes such
as turbot(18) and Atlantic halibut(16), protein utilisation was
not improved by an increase in dietary lipids. However, other studies with Atlantic halibut reported a protein-sparing
effect with increasing dietary lipids(12,24), though the diets
were not isonitrogenous. In species such as salmon(8),
trout(10), gilthead seabream(28)and European seabass(25),
pro-tein retention may be improved by partly replacing dietary protein by lipids, but in flatfish species this protein sparing seems to be controversial. In Senegalese sole such a wide diet-ary lipid range (4 – 20 %) has never been evaluated before, but the obtained results suggest a poor utilisation of the lipid frac-tion that warrants further investigafrac-tion. The determinafrac-tion of nutrients’ apparent digestibility coefficients could help clarify-ing this point. Several attempts for faeces collection have been carried out; nevertheless neither decantation methods nor fish stripping have been proven to be feasible for this species, due to the physical properties of the faeces and the morphology of the intestine. The dissection of the intestine seems to be the only way to recuperate faeces, but a great number of juveniles or larger-sized fish are required. Moreover, in the present study, the lack of a protein-sparing effect by dietary lipid might also be related to the high protein level of the
exper-imental diets. Dias et al.(25) reported that, in sea bass, an
increase in lipid level from 10 to 18 % only was beneficial at low protein levels (40 %). This suggests the need to opti-mise the dietary protein:lipid ratio to the metabolic needs of Senegalese sole juveniles.
Liver lipid content ranged from 8·0 to 10·1 % of liver wet weight, and was unaffected by dietary lipid level. Overall, liver lipids contribute to 0·1 % of final body weight and 1·7 % of total lipid content. Higher liver lipid contents were
reported by Dias et al.(4) in this species and in species such
as turbot(18)and Atlantic halibut(16). Moreover, Dias et al.(4)
observed that elevated levels of dietary lipids in Senegalese sole increased liver lipid content and depressed the lipogenic enzymic activity. Different results were reported in turbot, where the absence of any change in hepatic lipogenic enzymes was associated with a low lipid deposition and relative absence of response to high dietary lipid levels. In the present study, significant differences were found for hepatosomatic index among dietary treatments, but there was no clear associ-ation with dietary lipid level since L4 and L20 were similar. Hepatosomatic index values reported are in accordance with
those found by Dias et al.(4) in Senegalese sole but lower
than other flatfish species such as turbot(18)and Atlantic
hali-but(12,16,24) and other marine teleosts such as European
sea-bass(25)and gilthead seabream(29).
Both the viscerosomatic index and viscera total lipids of Senegalese sole increased with dietary lipid levels but were generally lower than values previously found in other teleosts
including flatfish species(4,18,29,30). Lipid content of the viscera
represents 0·1 – 0·2 % of body weight and 4 % of the whole-body lipids. Despite the higher values observed in other marine species, it is clear that Senegalese sole tends to accumulate part of the fat in the viscera. Moreover, fish fed HF diets exhibit a significantly higher viscerosomatic index,
essentially due to increased fat deposition in the viscera. This is in general accord with earlier observations by
Aksnes et al.(12)that reported similar results in halibut with
increasing dietary lipids. Nevertheless, lower values of fat in the viscera (0·2 – 0·8 %) were previously reported in
Senega-lese sole(4) and could not induce viscerosomatic index
differ-ences among treatments. In halibut, it was observed that a high
dietary lipid level (13 to 32 %) decreased slaughter quality(12),
but that was not found in turbot(18). In the present study,
vis-cera total lipids decreased with the LF diets, contributing to a significant decrease of whole-body lipid composition but an increase in the protein content. These results suggest a poor utilisation of dietary lipids and the potential value of such LF diets in improving Senegalese sole growth potential.
The content of total lipids of dorsal muscle ranged from 2·1 to 3·1 % on a fresh-weight basis, representing 1·3 % of whole-body weight and 27 % of total whole-whole-body lipids. Neverthe-less, contrarily to the viscera, muscle total lipids were not affected by increasing dietary lipid levels. These results are in agreement with earlier observations in flatfish species
such as halibut(13,16), turbot(18) and Senegalese sole(4), and
suggest that other tissues such as skin and subdermal adipose tissue or other carcass fraction (fins, brain, bones) might be important fat-storage sites. In the present study, Senegalese sole subdermal fat only represented about 0·2 % of whole-body weight and 4 % of total whole-body lipids, showing that lipids are probably being accumulated under the skin like in
turbot(18)and between the dorsal and ventral fins and around
the belly flap like in halibut(31).
Besides being energy-providing nutrients, dietary lipids are important in marine fish as a source of essential fatty acids, especially 20 : 5n-3 (EPA), 2220 : 6n-3 (DHA) and 2020 : 4n-6
(arachidonic acid)(32). The fatty acid compositions of tissue
lipids in fish are well known to be influenced by the fatty acid
composition of dietary lipids(32). This was the case in the present
study, where a linear correlation existed between the trations of given fatty acids in dietary lipids and their concen-trations in flesh total lipids. Taking into account that no significant differences were found in muscle total lipids among dietary treatments, fish fed the L4 diet effectively contained lower levels of n-3 fatty acids if compared with L20-fed ones. Additionally, the L4 diet induced a lower MUFA con-tent, probably leading to the mobilisation of the n-3 fatty acids for energetic proposes. Nevertheless, the L20 diet reduced growth and did not improve nutrient utilisation in this species and hence does not seem to be suitable for Senegalese sole juven-iles. Despite the slight alteration in n-3 muscle content in the fish fed the LF diets, this fish still remains an n-3-rich product contri-buting to the human health benefits associated with fish
consump-tion, especially regarding DHA and EPA(33,34). In fact, even at
dietary lipid levels as low as 4 %, Senegalese sole DHA:EPA and EPA:arachidonic acid ratios remained unchanged and hence muscle maintained its nutritional value. Moreover, in southern European countries this fish is generally consumed grilled without removing the skin. As the skin is one of the preferential organs for fat deposition in flatfish, it could be suspected that some lipid migration of the fat deposited in the subdermal adipose tissue could occur during the cooking process, increasing even further the nutritional value of the flesh. In conclusion, the results of the present study evidenced a low lipid tolerance by Senegalese sole juveniles and suggest
British
Journal
of
Nutrition
https://www.cambridge.org/core . Universidade do Algarve , on 10 Sep 2019 at 16:26:27, subject to the Cambridge Core terms of use, available at
https://www.cambridge.org/core/terms
.
a maximal dietary inclusion level of 8 % lipids for both opti-mal growth and nutrient utilisation. Future studies are required to ascertain whether the absence of a clear protein-sparing effect by dietary lipids holds up at lower dietary protein levels or in large-sized fish. Concerning the lipid metabolism of this flatfish, it would be worthwhile investigating which are the mechanisms responsible for the apparent poor utilisation of the dietary lipids. A better understanding of the metabolic changes induced by the dietary protein:lipid ratio should allow adjustment of the diet composition to the metabolic capacities of Senegalese sole juveniles.
Acknowledgements
The present study was supported by IDEIA project ‘Optidie-tas’ (Ageˆncia de Inovac¸a˜o, Portugal, with the support of the European fund FEDER).
P. B. carried out the main experimental work and wrote the draft under the direction of the project designer and leader L. M. P. V.; B. O., J. D. and L. C. assisted with the experimen-tal design and draft writing; S. C. assisted fatty acid determi-nation and draft writing.
There are no conflicts of interest in connection with the pre-sent study.
References
1. Conceic¸a˜o LEC, Ribeiro L, Engrola S, et al. (2007) Nutritional
physiology during development of Senegalese sole (Solea sene-galensis). Aquaculture 268, 64 – 81.
2. Imsland A, Foss A, Conceic¸a˜o L, et al. (2003) A review of the
culture potential of Solea solea and S. senegalensis. Rev Fish Biol Fish 13, 379 – 407.
3. Villalta M, Este´vez A, Bransden MP, et al. (2008) Arachidonic
acid, arachidonic/eicosapentaenoic acid ratio, stearidonic acid and eicosanoids are involved in dietary-induced albinism in Senegal sole (Solea senegalensis). Aquac Nutr 14, 120 – 128.
4. Dias J, Rueda-Jasso R, Panserat S, et al. (2004) Effect of dietary
carbohydrate-to-lipid ratios on growth, lipid deposition and metabolic hepatic enzymes in juvenile Senegalese sole (Solea senegalensis, Kaup). Aquac Res 35, 1122 – 1130.
5. Rema P, Conceic¸a˜o LEC, Evers F, et al. (2008) Optimal dietary
protein levels in juvenile Senegalese sole (Solea senegalensis). Aquac Nutr 14, 263 – 269.
6. Cho CY, Hynes JD, Wood KR, et al. (1994) Development of
high-nutrient-dense, low-pollution diets and prediction of aqua-culture wastes using biological approaches. Aquaaqua-culture 124, 293 – 305.
7. Company R, Calduch-Giner JA, Perez-Sanchez J, et al. (1999)
Protein sparing effect of dietary lipids in common dentex (Dentex dentex): a comparative study with sea bream (Sparus aurata) and sea bass (Dicentrarchus labrax). Aquat Living Resour 12, 23 – 30.
8. Hillestad M & Johnsen F (1994) High-energy/low-protein diets
for Atlantic salmon: effects on growth, nutrient retention and slaughter quality. Aquaculture 124, 109.
9. Kaushik SJ (1998) Nutritional bioenergetics and estimation of
waste production in non-salmonids. Aquat Living Resour 11, 211 – 217.
10. Lee DJ & Putnam GB (1973) The response of rainbow trout to
varying protein/energy ratios in a test diet. J Nutr 103, 916 – 922.
11. Cowey CB, Adron JW, Brown DA, et al. (1975) Studies on
nutrition of marine flatfish – metabolism of glucose by plaice (Pleuronectes platessa) and effect of dietary energy-source on protein utilization in plaice. Br J Nutr 33, 219 – 231.
12. Aksnes A, Hjertnes T & Opstvedt J (1996) Effect of dietary
protein level on growth and carcass composition in Atlantic halibut (Hippoglossus hippoglossus L). Aquaculture 145, 225 – 233.
13. Berge GM & Storebakken T (1991) Effect of dietary fat level on
weight gain, digestibility, and fillet composition of Atlantic halibut. Aquaculture 99, 331 – 338.
14. Grisdale-Helland B & Helland SJ (1998) Macronutrient
utiliz-ation by Atlantic halibut (Hippoglossus hippoglossus): diet digestibility and growth of 1 kg fish. Aquaculture 166, 57 – 65.
15. Hamre K, Øfsti A, Næss T, et al. (2003) Macronutrient
compo-sition of formulated diets for Atlantic halibut (Hippoglossus hippoglossus, L.) juveniles. Aquaculture 227, 233 – 244.
16. Martins DA, Valente LMP & Lall SP (2007) Effects of dietary
lipid level on growth and lipid utilization by juvenile Atlantic halibut (Hippoglossus hippoglossus, L.). Aquaculture 263, 150 – 158.
17. Caceres-Martinez C, Cadena-Roa M & Metailler R (1984)
Nutritional requirements of turbot (Scophthalmus maximus): I. A preliminary study of protein and lipid utilization. J World Maricult Soc 15, 191 – 202.
18. Regost C, Arzel J, Cardinal M, et al. (2001) Dietary lipid level,
hepatic lipogenesis and flesh quality in turbot (Psetta maxima). Aquaculture 193, 291 – 309.
19. Corraze G (2001) Lipid nutrition. In Nutrition and Feeding of
Fish and Crustaceans, pp. 111 – 130 [J Guillaume, S Kaushik and K Me´tailler et al., editors]. Chichester, UK: Springer Praxis.
20. Andersen NG & Alsted NS (1993) Growth and body
compo-sition of turbot (Scopthalmus maximus) in relation to different lipid/protein ratios in the diet. In Fish Nutrition in Practice, pp. 479 – 491 [SJ Kaushik and P Luquet, editors]. Biarritz, France: INRA.
21. Folch J, Lees M & Sloane Stanley GH (1957) A simple method
for the isolation and purification of total lipides from animal tissues. J Biol Chem 226, 497 – 509.
22. Shantha NC & Ackman RG (1990) Nervonic acid versus
trico-sanoic acid as internal standards in quantitative gas chromato-graphic analyses of fish oil longer-chain n-3 polyunsaturated fatty acid methyl esters. J Chromatogr Biomed Appl 533, 1 – 10.
23. Zar JH (1999) Biostatistical Analysis, 4th ed. London: Prentice
Hall.
24. Helland SJ & Grisdale-Helland B (1998) Growth, feed
utiliz-ation and body composition of juvenile Atlantic halibut (Hippo-glossus hippo(Hippo-glossus) fed diets differing in the ratio between the macronutrients. Aquaculture 166, 49 – 56.
25. Dias J, Alvarez MJ, Diez A, et al. (1998) Regulation of hepatic
lipogenesis by dietary protein/energy in juvenile European sea-bass (Dicentrarchus labrax). Aquaculture 161, 169 – 186.
26. Kruuk H (1963) Diurnal periodicity in the activity of the
common sole, Solea vulgaris. Neth J Sea Res 2, 1 – 28.
27. Peres H & Oliva-Teles A (1999) Effect of dietary lipid level on
growth performance and feed utilization by European sea bass juveniles (Dicentrarchus labrax). Aquaculture 179, 325 – 334.
28. Vergara JM, Lopez-Calero G, Robaina L, et al. (1999) Growth,
feed utilization and body lipid content of gilthead seabream (Sparus aurata) fed increasing lipid levels and fish meals of different quality. Aquaculture 179, 35.
29. Santinha PJM, Medale G, Corraze EFS, et al. (1999) Effects of
the dietary protein: lipid ratio on growth and nutrient utilization in gilthead seabream (Sparus aurata L.). Aquac Nutr 5, 147 – 156.
British
Journal
of
Nutrition
https://www.cambridge.org/core . Universidade do Algarve , on 10 Sep 2019 at 16:26:27, subject to the Cambridge Core terms of use, available at
https://www.cambridge.org/core/terms
.
30. Oliva-Teles A, Gouveia AJ, Gomes E, et al. (1994) The effect of different processing treatments on soybean meal utilization by rainbow trout, Oncorhynchus mykiss. Aquaculture 124, 343 – 349.
31. Haug T, Ringo E & Pettersen GW (1988) Total lipid and
fatty-acid composition of polar and neutral lipids in different tissues of Atlantic halibut, Hippoglossus-hippoglossus (L). Sarsia 73, 163 – 168.
32. Sargent JR, Tocher DR, Bell JG, et al. (2002) The lipids. In Fish
Nutrition, 3rd ed., pp. 181 – 257. San Diego: Academic Press.
33. Ruxton CHS, Reed SC, Simpson MJA, et al. (2004) The health
benefits of omega-3 polyunsaturated fatty acids: a review of the evidence. J Hum Nutr Diet 17, 449 – 459.
34. Simopoulos AP (1999) Essential fatty acids in health and
chronic disease. Am J Clin Nutr 3, Suppl., 560S – 569S.
British
Journal
of
Nutrition
https://www.cambridge.org/core . Universidade do Algarve , on 10 Sep 2019 at 16:26:27, subject to the Cambridge Core terms of use, available at
https://www.cambridge.org/core/terms
.