http://www.uem.br/acta ISSN printed: 1679-9275 ISSN on-line: 1807-8621
Doi: 10.4025/actasciagron.v35i4.16430
Early selection in sugarcane family trials via BLUP and BLUPIS
procedures
Ricardo Augusto de Oliveira1*, Edelclaiton Daros1, Marcos Deon Vilela de Resende2, João Carlos Bespalhok Filho1, José Luis Camargo Zambon1 and Lucimeris Ruaro1
1
Departamento de Fitotecnia e Fitossanitarismo, Setor de Ciências Agrárias, Universidade Federal do Paraná, Rua dos Funcionários, 1540, 80035-050, Curitiba, Paraná, Brazil. 2Empresa Brasileira de Pesquisa Agropecuária, Colombo, Paraná, Brazil. *Author for correspondence. E-mail: [email protected]
ABSTRACT. The objective of this study was to compare early selection in sugarcane families through the best linear unbiased prediction (BLUP) and simulated individual best linear unbiased prediction (BLUPIS) procedures. We tested 80 full-sib families in an incomplete block experimental design. Statistical analyses were performed using the mixed model methodology. The following traits were determined from the first rattoon: tons of stalks per hectare (TSH), percentage of soluble solids w/w in the juice (Brix), and tons of brix per hectare (TBH). Variance components were estimated by restricted maximum likelihood (REML), and the genotypic values of the families were predicted by BLUP and BLUPIS. The BLUPIS procedure suggested the selection of 30 families with a total of 344 individuals for TBH and gain with a selection intensity of 28%. The correlation between BLUPIS and true BLUP was 0.83, 0.93 and 0.91, for Brix, TSH and TBH, respectively, being validated with data from sugarcane. The BLUPIS procedure demonstrated an advantage in selecting families based on the total harvest of the plot, different from the BLUP procedure that requires the measurement of all individuals present in the plot.
Keywords: Saccharum spp., plant breeding, mixed models, family selection, full-sib families.
Seleção precoce em famílias de cana-de-açúcar via procedimentos BLUP e BLUPIS
RESUMO. O objetivo deste trabalho foi comparar a seleção precoce de famílias através da melhor predição linear não viesada (BLUP) correlacionando-se os resultados com o procedimento BLUP individual simulado (BLUPIS). Foram testadas 80 famílias de irmãos-germanos conduzidas a campo em delineamentos em blocos incompletos. As análises estatísticas foram realizadas utilizando os modelos mistos. As variáveis determinadas no ciclo de cana-soca foram: toneladas de colmos por hectare (TCH), porcentagem de sólidos solúveis no caldo da cana (Brix) e toneladas de brix por hectare (TBH). Os componentes de variância foram estimados utilizando a máxima verossimilhança restrita (REML) e os valores das famílias foram preditos pelos procedimentos BLUP e BLUPIS. O procedimento BLUPIS indicou a seleção de 30 famílias com um total de 344 indivíduos para a variável TBH e ganho com a seleção de 28%. A correlação entre o BLUPIS e BLUP foi de 0,83; 0,93 e 0,91 para Brix, TCH e TBH, respectivamente, sendo validado o procedimento BLUPIS com dados em cana-de-açúcar. O procedimento BLUPIS demonstra vantagem na seleção de famílias, pois se baseia na colheita total de parcela, diferente do procedimento BLUP que exige a mensuração de todos os indivíduos presente na parcela.
Palavras-chave: Saccharum spp., melhoramento vegetal, modelos mistos, seleção de famílias, famílias de irmãos-germanos. Introduction
In sugarcane, selection is practiced in all phases of the breeding, in the choice of genitors, the choice of crosses, the selection of individuals derived from the crosses and in clonal selection. In the first phase of genetic breeding, experimental precision is very low due to the lack of replication and competition effects among the individuals. These factors contribute to reduced selection efficiency. When mass selection is used, it tends to be based on indirect production traits, with lower selective efficiency (KIMBENG; COX, 2003; SKINNER et al., 1987).
traits, the use of the best linear unbiased prediction (BLUP) procedure has been recommended (HENDERSON, 1975; KIMBENG; COX 2003; RESENDE, 2002).
BLUP is considered a preferred procedure because it offers more precision for various experimental conditions, and it maximizes the correlation between the true and predicted genotypic values and the predicted genotypic value relative to other methodologies, which is essential for the breeder (FURLANI et al., 2005; PIEPHO et al., 2008; RESENDE, 2002). One important characteristic of the BLUP procedure is the ‘shrinkage’ effect that shifts the results of the progeny in the direction of the observed mean; this is a desirable statistical property for an estimator with relatively high accuracy (COPAS, 1983).
The ideal procedure for the selection of individuals for cloning in the initial stages of the sugarcane improvement program is individual BLUP that simultaneously considers information from the individual, the family, the experimental design and the pedigree (BARBOSA et al., 2005; ATKIN et al., 2009). However, this information is not obtained when evaluating the families, which are analyzed based on the total harvest of the plots. Resende and Barbosa (2005) proposed a simulated individual BLUP procedure (BLUPIS), which represents the evolution of sequential selection in sugarcane. In this procedure, the progenies are evaluated based on the total harvest of plots, and the numbers of families that are above the experimental mean and the estimated numbers of individuals to be selected within each family are determined afterwards (RESENDE; BARBOSA, 2006).
The objective of this study was to compare early selection in the sugarcane family through BLUP and BLUPIS procedures. To reach these goals, the following steps were performed: i) estimation of compounds of variance and genetic parameters of the 80 families of full-sib families; ii) prediction of the genotypic values of the families through BLUP procedure, based on production traits, to determine relative genotypic value; iii) comparison of the BLUP and BLUPIS procedures.
Material and methods
Eighty full-sib families were tested in the field, in an experimental area in São Tomé city, Paraná state, Brazil. The region is located between the geographical co-ordinates 23°34’02.75” south latitude, and 52°38’53.87” west longitude, and has an average altitude of 450 meters. The experimental sugarcane was planted in March 2004, and manually
harvested in March 2005. The number of stalks per plant (NSP) and Brix (%), which expresses the content of soluble solids in the juice, were determined from the first rattoons harvested in April 2006. The average mass of the plants (MP) was determined based on each individual as NSP x SW (kg), in which SW refers to the measured weight of one stalk per plant from ten plants in the plot referring to the family. The tons of stalks per hectare (TSH, mg ha-1) was estimated as (SW x 10) x 0.7, in
which 0.7 is the area for each plant in square meters, adapted from Chang and Milligan (1992) based on weight values measured in the field. The sugar yield per hectare (TBH, mg ha-1) was calculated as (TSH
x Brix) 100-1 (LEITE et al., 2009).
The experiment used an incomplete block design, with 80 full-sib families and five repetitions per family. Each experimental parcel was composed of 10 seedlings planted in rows with 0.50 m between plants and 1.40 m between rows.
Statistical analyses were performed using the mixed model methodology. Variance components were estimated by restricted maximum likelihood (REML), and the genotypic values of families were predicted by best linear unbiased prediction (BLUP) using Selegen-REML/BLUP (RESENDE, 2007) software. The mixed model associated with the full-sib family evaluation at individual level per plot was: y = Xr + Za + Wp + Sf + Tb + e, where y is the data vector, r is the repetition effect vector (assumed to be fixed) added to the general average; a is the additive genetic effect vector (assumed to be random); p is the parcel effect vector (random); f is the genetic effect of dominance associated to full-sib families (assumed to be random); b is the vector of the incomplete block effects (random); e is the vector of errors (random) and X, Z, W, S and T represent the incidence matrices for the effects of r,
a, p, f and b, respectively.
Distributions and structures of means and variances:
) , ( ~ ,V N XrV r
y
) , 0 ( ~
, a2 N A a2 A
a
) , 0 (
~ 2
2
p
p N I
p
) , 0 (
~ 2
2
f
f N I
f
) , 0 (
~ 2
2
b
b N I
b
) , 0 (
~ 2
2
e
e N I
Cov (a, p’)=0; Cov (a, f’)=0; Cov (a, b’)=0, Cov (a, e’)=0;
Cov (p, f’)=0; Cov (p, b’)=0; Cov (p, e’)=0; Cov (f, b’)=0;
Cov (f, e’)=0; Cov (b, e’)=0, or else:
0 0 0 0 0 Xr e b f p a y E ; Var 2 2 2 2 2 2 2 2 2 2 2 2 2 2 2 0 0 0 0 0 0 0 0 ' 0 0 0 0 ' 0 0 0 0 ' 0 0 0 0 ' e e b b f f p p a a e b f p a I I TI T I I S I I W I A Z A I TI SI WI ZA V e b f p a y
V = Var(Y)= 2 ' 2 ' 2 ' 2 ' 2
e b f p
aZ WI W SI S TI T I
ZA ,
where:
A is the genetic additive relationship matrix between the parents used in a cross.
Mixed model equations:
4 3 2 1 1 ' ' ' ' ' ' ' ' ' ' ' ' ' ' ' ' ' ' ' ' ' ' ' ' ' I T T S T W T Z T X T W S I S S W S Z S X S T W S W I W W Z W X W T Z S Z W Z A Z Z X Z T X S X W X Z X X X y T y S y W y Z y X b f p a r ' ' ' ' ' ˆ ˆ ˆ ˆ ˆ where: 2 2 2 2 2 2 2 1 1 h b f p h a
e
2 2 2 2 2 2 2 2 1 p b f p h p
e
2 2 2 2 2 2 2 3 1 f b f p h f
e
2 2 2 2 2 2 2 4 1 b b f p h b
e
2 2 2 2 2 2 2 e b f p a a h
Individual heritability coefficient in the
narrow-sense; 2 2 2 2 2 2 2 e b f p a p p
: coefficient of
determination the effects of the parcel;
2 2 2 2 2 2 2 e b f p a f f
: coefficient of
determination the effects of the specific combining ability; 2 2 2 2 2 2 2 e b f p a b b
: coefficient of
determination the effects of the blocks; 2
a
: variance of genetic additive;
2f : variance of specific combining ability among full-sib families;2
b
: variance between blocks;
e2: residual variancebetween plots and
e2: residual variance.The variance components were obtained by the REML method and used to calculate the heritability coefficient estimates at the individual level and at the level of full-sib family means.
Iterative estimators of the components of variance by Reml via EM algorithm:
' ˆ' ' ˆ' ' ˆ' ' ˆ' ' ˆ' '
( )
ˆ2 x r N y T b y S f y W p y Z a y X r y y
e
aA a etr A C
qa ˆ' ˆ ˆ ( )
ˆ2 1 2 1 22
133 2
2 ˆ ˆ
' ˆ
ˆpar p p etrC s
f f etrC
t f44 2
2 ˆ'ˆ ˆ
ˆ
255 2 2 ˆ'ˆ ˆ
ˆb bb etrC s
where:
C22, C33, C44 and C55 are derived fron C. C:
matrix of the coefficients of the mixed model equations; tr: matrix trace operator; r(x): rank of the X matrix. N, q, s1, t e s2: total number of data, of
parents, of parcel, of crossings and of blocks, respectively.
repetition effect vector (assumed as fixed) added to the general average; a is the additive genetic effect vector (assumed as random); f is the genetic effect of dominance associated to full-sib families (assumed as random); b is the vector of the incomplete block effects (random); e is the vector of errors (random) and X, Z, W and U represent the incidence matrices for the effects of r, a, f and
b, respectively.
Distributions and structures of means and variances:
)
,
(
~
,
V
N
Xr
V
r
y
;)
,
0
(
~
,
a2N
A
a2A
a
;)
,
0
(
~
2 2 ff
N
I
f
;) , 0 ( ~ 2 2 b
b N I
I
b
;) , 0 ( ~ 2 2 e
e N I
I
e
.Cov (a, f’)=0: Cov (a, b’)=0; Cov (a, e’)=0 Cov (f, b’)=0; Cov (f, e’)=0; Cov (b, e’)=0, or else:
;
0
0
0
0
Xr
e
b
f
a
y
E
Var
2 e 2 e 2 b 2 b 2 f 2 f 2 a 2 a 2 e 2 b 2 f 2 aI
0
0
0
I
0
UI
0
0
'
I
0
0
I
0
'
I
0
0
0
A
'
A
I
UI
WI
ZA
U
W
Z
V
e
b
f
a
y
V = Var(Y)=
ZA
a2Z
'
WI
2fW
'
UI
b2U
'
I
e2,where:
A is the genetic additive relationship matrix between the individuals.
Mixed model equations:
3 2 1 1 ' ' ' ' ' ' ' ' ' ' ' ' ' ' ' '
I U U W U Z U X U U W I W W Z W X W U Z W Z A Z Z X Z U X W X V X X X ;
b
f
a
r
ˆ
ˆ
ˆ
ˆ
y
U
y
W
y
Z
y
X
'
'
'
'
, where: 2 2 2 2 2 2 11
h
b
f
h
ae
; 2 2 2 2 2 2 2 1 f b f h fe
; 2 2 2 2 2 2 3 1 b b f h be
; 2 2 2 2 2 2 e b f a ah
:individual heritability coefficient in the narrow-sense; 2 2 2 2 2 2 e b f a f
f
:coefficient of determination the effects of the specific combining ability;
2 2 2 2 2 2 e b f a b
b
:coefficient of determination the effects of the blocks; 2
a
: variance of genetic additive; 2f
: variance of specific combining ability among full-sib families;2
b
: variance between blocks; and
e2: residual variance.Iterative estimators of the components of variance by Reml via EM algorithm:
' ˆ' ' ˆ' ' ˆ' ' ˆ' '
( )
ˆ2
x r N y U b y W f y Z a y X r y y
e
a A a etr A C
qa ˆ' ˆ ˆ ( )
ˆ2 1
2 1 22
133 2
2 ˆ ˆ
' ˆ
ˆf f f
e trC s
244 2
2 ˆ'ˆ ˆ
ˆb bb
e trC s
where: 22
C
,C
33 eC
44 are derived fron C. matrix of the coefficients of the mixed model equations; tr: matrix trace operator; r(x): rank of the X matrix. N,q, s1, e s2: total number of data, of parents, of
crossings and of blocks, respectively.
The estimators of the component of variance of dominance among families are given by
2
2 ˆ
ˆd f
, that is, it is equal to the component of variance associated with the specific combining ability. In this case, ˆ2
f
is 1/4 of the genetic variance of total dominance present in the population.
The BLUPIS algorithm used to generate real genotypic values for non-evaluated individuals, considering individual i from family j, was u + gij
= u + gj + gi/j, in which u is the general mean; gij
is the genotypic effect of the individual ij; gj is the
genotypic effect of the family j; and gi/j is the
genotypic effect within the family of the individual ij. This procedure, denominated ‘simulated individual BLUP (BLUPIS)’, was determined dynamically. The number of individuals nk selected in each family k is given by
k j
jk gˆ gˆ n
n , in which
gˆ
j refers to the genotypicvalue of the best family and nj is equal to the
number of individuals selected in the best family. The determination of nj involves the concept of
effective population size. Alternatively, this expression can be given as
j k j
j
k j
jk 1 gˆ gˆ gˆ n gˆ gˆ n
n . The latter
expression shows that nk depends on the
differences among the genotypic effects of the two families as a proportion of the best family’s genotypic effect. The method automatically eliminates the families with negative genotypic effects, i.e., those below the general mean of the experiment (RESENDE; BARBOSA, 2006).
The correlations between the BLUPIS and BLUP procedures were calculated based on the number of potential clones identified by both methodologies, as described in the formula:
blup blupis blup blupis blup
blupis Cov
r ; ( ; )/ , in which:
) ; (blupis blup
Cov : covariance between blupis and blup;
blupis
: standard deviation for the variable blupis; and
blup
: standard deviation for the variable blup.
Results and discussion
The estimates of the individual heritability coefficient in the restricted sense (ˆ2
a
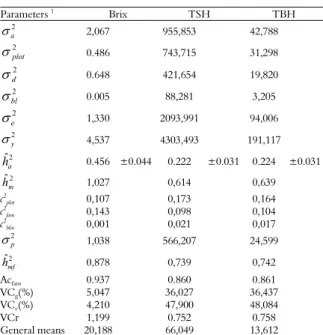
h ) for Brix, TSH and TBH (Table 1) indicated that only the Brix had a significant magnitude (0.45 ± 0.04); for the traits TSH and TBH, the individual heritability coefficient in the restricted sense was of moderate magnitude (0.22 ± 0.03). These estimates were accurate, as demonstrated by their respective standard errors. However, considering the respective heritability coefficient in the restricted sense (< 0.50) and the family level heritability coefficient (> 0.70), it may still be advantageous to use family information to select for these traits because the heritability coefficient of the mean of the families was > 0.73 (RESENDE, 2002). In this study, the average familial heritability coefficients for Brix, TSH and TBH were of high magnitude, varying between 0.73 and 0.87, as estimated with the BLUP procedure (Table 1). These results suggest that there is genetic variability among full-sib families and that it is possible to select the best families through individual selection. Kimbeng and Cox (2003) report that several researchers and simulation studies show that a combination of family and individual clone selection is a practical and efficient selection method for the first phase of selection.
Table 1. Estimations of variance compounds and genetic parameters for Brix, TSH (mg ha-1) and TBH (mg ha-1).
Parameters 1
Brix TSH TBH
2
a
2,067 955,853 42,788
2
plot
0.486 743,715 31,298
2
d
0.648 421,654 19,820
2
bl
0.005 88,281 3,205
2
e
1,330 2093,991 94,006
2
y
4,537 4303,493 191,117
2 ˆ
a
h 0.456 ±0.044 0.222 ±0.031 0.224 ±0.031
2 ˆ
m
h 1,027 0,614 0,639
c2
plot 0,107 0,173 0,164
c2
fam 0,143 0,098 0,104
c2
bloc 0,001 0,021 0,017
2
p
1,038 566,207 24,599
2 ˆ
mf
h 0,878 0,739 0,742
Acfam 0.937 0.860 0.861
VCg(%) 5,047 36,027 36,437
VCe(%) 4,210 47,900 48,084
VCr 1,199 0.752 0.758 General means 20,188 66,049 13,612
1Individual heritability coefficient in the restricted sense (ˆ2
a
h), individual heritability coefficient in the broad sense (ˆ2
m
h), heritability coefficient of the mean of the families in the broad sense (ˆ2
mf
h ), additive genetic variance (a2), variance between plots (2plot), genetic variance of dominance between families (d2), variance between b.
These results highlight the possibility of selecting families based on these traits, due to the presence of genetic variability. The selection of superior families based on production traits, such as selection for TSH and TBH, is a strategy that has been used in initial stages and allows a greater genetic gain (KIMBENG; COX, 2003) with advantages for the evaluation of the performance of the families together with robust BLUP estimates (ATKIN et al., 2009; COX et al., 1994), and individual clone selection in the first rattoon was shown to be an efficient method for obtaining new sugarcane cultivars (PEDROZO et al., 2011).
The number of families indicated for selection for Brix was 44; these families had genotypic values above the general mean (20.19) and therefore the potential for higher precocity and early harvest. The selection of these 44 families would enable a gain of 3.47%, considering that these families represent 57.5% of those evaluated. For TSH, we identified 30 families with genotypic values above the general mean of 66.05 (mg ha-1). These families correspond to 37.5% of
the total of families evaluated. For TBH variable, the gain with the selection of the 30 above-mean families (13.61 mg ha-1) would be approximately
28%. Of these, 29 families present higher values (Table 2). Overall, family selection tends to be
more effective at identifying genotypes that have significant potential to affect quantitative traits (KIMBENG; COX, 2003).
Table 2. The genotypic values of 80 full-sib families of sugarcane determined via BLUP and relative genotypic value determined via BLUPIS for the variables Brix, TSH (mg ha-1
) and TBH (mg ha-1
).
Brix TSH TBH Families Gv1
grelative 2
Families Gv grelative Families Gv grelative
6219 22.23 1.00 449 171.48 1.00 449 36.65 1.00 5222 22.04 0.64 1910 137.79 0.68 1910 29.32 0.68 435 21.89 0.59 6645 118.43 0.50 6645 25.39 0.51 4426 21.73 0.53 5811 114.89 0.46 5811 23.74 0.44 4948 21.68 0.51 1417 112.05 0.44 4341 22.95 0.41 4419 21.55 0.47 6114 105.51 0.37 1417 22.27 0.38 232 21.51 0.45 4341 105.35 0.37 1217 21.01 0.32 2715 21.50 0.45 1217 99.40 0.32 6114 20.64 0.31 3528 21.47 0.44 435 90.72 0.23 435 20.04 0.28 4341 21.44 0.43 6013 90.56 0.23 1727 19.07 0.24 4846 21.44 0.43 578 90.13 0.23 4426 18.97 0.23 2822 21.42 0.42 1727 89.92 0.23 4419 18.40 0.21 4929 21.30 0.38 4426 87.45 0.20 578 17.84 0.18 4620 21.28 0.38 4419 85.80 0.19 6013 17.67 0.18 2812 21.27 0.37 1340 84.73 0.18 6219 17.64 0.18 4130 21.21 0.35 4422 81.57 0.15 1340 17.56 0.17 6748 21.21 0.35 1714 81.00 0.14 4422 17.36 0.16 1527 21.20 0.35 3946 80.07 0.13 6147 16.63 0.13 6645 21.16 0.34 6147 78.51 0.12 2812 16.61 0.13 6143 21.14 0.33 6219 78.35 0.12 3946 16.51 0.13 449 21.13 0.33 4331 78.17 0.12 4331 15.98 0.10 4422 21.12 0.32 491 77.58 0.11 1714 15.88 0.10 2146 21.09 0.31 6542 76.86 0.10 6542 15.70 0.09 514 21.07 0.31 2812 76.36 0.10 497 15.38 0.08 4921 21.06 0.30 497 72.83 0.06 491 15.30 0.07 524 20.99 0.28 2146 70.40 0.04 2146 14.95 0.06 1727 20.98 0.27 4620 67.91 0.02 4620 14.58 0.04 6147 20.89 0.24 566 67.27 0.01 4929 14.17 0.02 2432 20.84 0.23 4537 66.49 0.01 2835 14.07 0.02 2433 20.75 0.20 2835 66.32 0.01 566 13.84 0.01 497 20.73 0.19 - - - 1835 13.09 0.04 154 20.72 0.18 - - - 1837 10.84 0.04 1217 20.62 0.15 - - - 5222 9.10 0.03 1910 20.59 0.14 - - - 2146 11.03 0.02 4331 20.44 0.09 - - - 4537 12.28 0.02 1340 20.39 0.07 - - - - 2835 20.38 0.07 - - - - 2324 20.36 0.06 - - - - 1835 20.34 0.05 - - - - 1923 20.34 0.05 - - - - 3224 20.30 0.04 - - - - 3518 20.24 0.02 - - - - 5811 20.24 0.02 - - - - 5140 20.24 0.02 - - - -
1Genotypic value; 2 n
j = 50, number of selected individuals within the best family; nk = ,
where refers to the predicted genotypic value of family k and to the genotypic values of the best family (number 1 in the ranking).
Of the number of families with positive genotypic values predicted by BLUPIS, 44, 28 and 30 families contributed to the selection of specific individuals for Brix, TSH and TBH, representing 53, 35 and 37% of the tested families, respectively. An additional advantage to the selection of these individuals is in the possibility of directing the selection to quantitative traits with low heritability coefficients because the first phase of the selection originated from directed crosses.
the families. Based on this value, we were able to determine the number of individuals to be selected within each family (Table 3). For the variables Brix, TSH and TBH, the number of individuals were 390, 299 and 326, respectively. The numbers of individuals indicated by BLUPIS were 467, 343 and 344 for Brix, TSH and TBH, respectively.
Table 3. The number of selected individuals within the sugarcane families determined via BLUP and BLUPIS procedures, for the variables Brix, TSH (mg ha-1) and TBH (mg
ha-1), based on 80 full-sib families.
Brix TSH TBH
Families Nº 1
Nº 2
Families Nº 1
Nº 2
Families Nº 1
Nº 2
154 5 3 435 9 12 435 11 14 435 31 29 449 39 50 449 39 50 449 44 50 491 10 5 491 9 4
491 15 19 497 5 3 497 4 4
497 13 17 566 1 1 566 9 1
524 6 1 578 8 11 578 12 9
566 1 1 1217 10 16 1217 9 16
578 6 11 1340 9 9 1340 16 9
1217 17 25 1417 19 22 1417 16 19
1340 11 11 1714 6 7 1714 4 5
1417 13 13 1727 12 11 1727 11 12 1714 3 2 1910 17 34 1910 17 34
1727 16 18 2146 5 2 2146 5 3
1835 5 6 2812 9 5 2812 9 6
1910 17 30 3946 8 7 2835 8 1
2146 5 3 4331 6 6 3946 8 6
2731 7 5 4341 13 19 4331 5 5
2812 7 7 4419 6 9 4341 15 20
2835 6 4 4422 4 7 4419 10 10
3425 8 5 4426 6 10 4422 4 8 3946 6 16 4620 2 1 4426 7 12 4130 3 1 5811 20 23 4620 3 2 4331 8 11 6013 9 12 4929 3 1 4341 6 30 6114 18 19 5811 19 22
4419 1 1 6147 9 6 6013 9 9
4422 12 15 6219 6 6 6114 15 15
4426 9 11 6542 9 5 6147 9 7
4620 12 14 6645 24 25 6219 9 9
4921 3 3 6542 9 5
4929 6 6 6645 22 26
4948 2 2
5811 20 20
6013 9 11
6114 19 20
6143 3 6
6147 11 11
6645 24 29
Total 390 467 299 343 326 344
1Number of individuals indicated by the selection via BLUP procedure; 2Number of
individuals indicated by the selection via BLUPIS procedure.
In this study, high correlations were observed between BLUP and BLUPIS for the variables Brix, TSH and TBH, confirming the high precision of clone indication via the BLUPIS procedure. The values were r2 = 0.83** for Brix, r2 = 0.93** for TSH and r2 =
0.91** for TBH. Correlations were significant in all cases. For TSH and TBH, it was verified that the selection through BLUPIS indicated only 13 and 5% of below mean individuals, respectively, leading to a coincidence among individuals in excess of 87% (Table 4).
Table 4. Estimated coefficients of correlation, coincidence, corrected coincidence and proportions of indicated individuals between the individual BLUP and BLUPIS selection methodologies, based on 80 full-sib sugarcane families.
Estimations Brix TSH TBH
Correlation BLUP vs. BLUPIS 0.83** 0.93** 0.91**
1
Coincidence BLUP vs. BLUPIS 0.85 0.87 0.95
2Corrected coincidence BLUP vs. BLUPIS 0.71 0.81 0.85 3
Proportion BLUPIS 0.15 0.13 0.05 *, **Significant at 5 and 1%, respectively. 1Number of coincident individuals between
two selection methodologies. 2Coincidence of the same selected individuals between
two selection methodologies. 3Proportion of individuals indicated by BLUPIS below
the general mean.
These results indicate high precision for the selection of individuals within the best families via simulated individual BLUP procedure (BLUPIS) and confirm the results obtained by Resende and Barbosa (2006). Therefore, the best families can be exploited through individual selection, considering the expressive genotypic value of these hybridizations. This is desirable because it produces a higher probability of selecting individuals with these traits that can be fixed by vegetative propagation (BARBOSA et al., 2004).
The corrected coincidence between the BLUP and BLUPIS selection procedures was verified to be above 0.81. For the family selection aiming to increase TBH, the coincidence was 0.85, which indicates a high probability of selecting the potentially ideal individuals for this characteristic using the BLUPIS procedure. The main advantage of this procedure is its ability to estimate the genotypic values of the families based on the total harvest of the plots. This differs from the BLUP procedure, which requires the measurement of all individuals present in the plot (RESENDE; BARBOSA, 2005). These results indicate that the combination of full-sib family selection with the BLUPIS procedure and individual clone selection in the rattoon is efficient and may provide an improvement in resource use for obtaining new sugarcane cultivars. These results confirm those obtained by Pedrozo et al. (2011) by studying families and environments.
Conclusion
The use of BLUP or individual BLUPIS enables increased selection efficiency to advance the clonal selection phases. However, BLUPIS is operationally easier than family selection, with its use of individual information. Therefore, it can be considered appropriate to recommend the use of BLUPIS in sugarcane improvement programs.
References
values in a sugarcane breeding program. Theoretical and Applied Genetics,v. 119, n. 3, p. 555-565, 2009.
BARBOSA, M. H. P.; RESENDE, M. D. V.; BRESSIANI, J. A.; SILVEIRA, L. C. I.; PETERNELLI, L. A. Selection of sugarcane families and parents by
Reml/Blup. Crop Breeding and Applied
Biotechnology, v. 5, n. 4, p. 443-450, 2005.
BARBOSA, M. H. P.; RESENDE, M. D. V.; PETERNELLI, L. A.; BRESSIANI, J. A.; SILVEIRA, L. C. I.; SILVA, F. L.; FIGUEIREDO, I. C. R. Use of Reml/Blup for the selection of sugarcane families
specialized in biomass production. Crop Breeding and
Applied Biotechnology, v. 4, n. 2, p. 218-226, 2004. CHANG, Y. S.; MILLIGAN, S. B. Estimating the potential of sugarcane families to produce elite genotypes using univariate cross prediction methods. Theoretical and Applied Genetics, v. 84, n. 5/6, p. 662-671, 1992. COPAS, J. B. Regression, prediction and shrinkage.
Journal of the Royal Statistical Society, v. 45, n. 3, p. 311-354, 1983.
COX, M. C.; HOGARTH, D. M.; HANSEN, P. B. Breeding and selection for high early season sugar content
in a sugarcane (Saccharum spp. hybrids) improvement
program. Australian Journal of Agricultural Research, v. 45, n. 7, p. 1569-1575, 1994.
FURLANI, R. C. M.; MORAES, M. L. T.; RESENDE, M. D. V.; FURLANI JUNIOR, E.; GONCALVES, P. S.; VALÉRIO FILHO, W. V.; PAIVA, J. R. Estimation of variance components and prediction of breeding values in rubber tree breeding using the REML/BLUP procedure.
Genetics and Molecular Biology, v. 28, n. 2, p. 271-276, 2005.
HENDERSON, C. R. Best linear unbiased estimation and prediction under a selection model. Biometric, v. 31, n. 2, p. 423-477, 1975.
JACKSON, P. A. Breeding for improved sugar content in sugarcane. Field Crops Research, v. 92, n. 2-3, p. 277-290, 2005.
JACKSON, P. A.; MCRAE, T. A. Gains from selection of broadly adapted and specifically adapted sugarcane families.
Field Crops Research, v. 59, n. 3, p. 151-162, 1998. JACKSON, P. A.; MCRAE, T. A. Selection of sugarcane clones in small plots: effects of plot size and selection criteria. Crop Science, v. 41, n. 2, p. 315-322, 2001. KIMBENG, C. A.; COX, M. C. Early generation selection of sugarcane families and clones in Australia. Journal of the
Americam Society of Sugarcane Technologists, v. 23, p. 20-39, 2003.
LEITE, M. S. O.; PETERNELLI, L. A.; BARBOSA, M. H. P.; CECON, P. R.; CRUZ, C. D. Sample size for
full-sib family evaluation in sugarcane. Pesquisa
Agropecuária Brasileira, v. 44, p. 1562-1574, 2009. OLIVEIRA, R. A.; RESENDE, M. D. V.; DAROS, E.; BESPALHOK-FILHO, J. C.; ZAMBON, J. L. C.; IDO, O. T.; WEBER, H.; KOEHLER, H. S. Genotypic evaluation and selection of sugarcane clones in three environments in the State of Paraná. Crop Breeding and Applied Biotechnology, v. 5, n. 4, p. 426-434, 2005. PEDROZO, C. A.; BARBOSA, M. H. P.; SILVA, F. L.; RESENDE, M. D. V.; PETERNELLI, L. A. Repeatability of full-sib sugarcane families across harvests and the efficiency of early selection. Euphytica, v. 182, n. 3, p. 423-430, 2011.
PIEPHO, H. P.; MÖHRING, J.; MELCHINGER, A. E.; BÜCHSE, A. BLUP for phenotypic selection in plant breeding and variety testing. Euphytica, v. 161, n. 1/2, p. 209-228, 2008.
RESENDE, M. D. V. Genética, biométrica e
estatística: no melhoramento de plantas perenes. Brasília: Embrapa Informação Tecnológica, 2002.
RESENDE, M. D. V. O software Selegen Reml/Blup.
Campo Grande: Embrapa Informação Tecnológica, 2007. RESENDE, M. D. V.; BARBOSA, M. H. P.
Melhoramento genético de plantas de propagação assexuada. Colombo: Embrapa Informação Tecnológica, 2005.
RESENDE, M. D. V.; BARBOSA, M. H. P. Selection via simulated individual BLUP based on family genotypic effects in sugarcane. Pesquisa Agropecuária Brasileira, v. 41, n. 3, p. 421-429, 2006.
SKINNER, J. C.; HOGARTH, D. M.; WU, K. K. Selection methods, criteria and indices. In: HEINZ, D. J.
(Ed.). Sugarcane improvement through breeding.
Amsterdam: Elsevier, 1987. p. 409-453.
Received on March 21, 2012. Accepted on July 19, 2012.