Single-cell qPCR facilitates the optimization
of hematopoietic differentiation in hPSCs/OP9
coculture system
Haide Chen
1,2, Mengmeng Jiang
2, Lei Xiao
1,2and He Huang
2,31
College of Animal Science, Zhejiang University, Hangzhou, China 2
School of Medicine, Zhejiang University, Hangzhou, China 3
The 1st Affiliated Hospital, Zhejiang University School of Medicine, Hangzhou, China
Abstract
Human pluripotent stem cells (hPSCs)/OP9 coculture system is a widely used hematopoietic differentiation approach. The limited understanding of this process leads to its low efficiency. Thus, we used single-cell qPCR to reveal the gene expression profiles of individual CD34+ cells from different stages of differentiation. According to the dynamic gene expression of hematopoietic
transcription factors, we overexpressed specific hematopoietic transcription factors (Gata2, Lmo2, Etv2, ERG, and SCL) at an early stage of hematopoietic differentiation. After overexpression, we generated more CD34+cells with normal expression level ofCD43
and CD31, which are used to define various hematopoietic progenitors. Furthermore, these CD34+cells possessed normal
differentiation potency in colony-forming unit assays and normal gene expression profiles. In this study, we demonstrated that single-cell qPCR can provide guidance for optimization of hematopoietic differentiation and transient overexpression of selected hematopoietic transcription factors can enhance hematopoietic differentiation.
Key words: Single-cell qPCR; Human pluripotent stem cells; Hematopoietic differentiation; OP9-GFP; Transcription factors
Introduction
Since the establishment of human pluripotent stem cells (hPSCs) in 1998 (1–3), it is well known that hPSCs can differentiate into a variety of tissue cells for replacement therapy of human diseases and for studying development. Many differentiation strategies have been established for various tissue cells, such as lung organoids (4), corneal epithelial cells (5), intestinal tissue (6), retinal tissue (7), liver (8), and blood cells (9). The transplantation of blood cells offers hope for the treatment of a variety of blood and immune system diseases. Because of the critical shortage of blood cells in clinical settings, several strategies have been established to generate hematopoietic stem cells (HSCs) and mature blood cells from hPSCs (10,11).
The hPSCs/OP9 coculture system is a widely used approach to generate CD34+ hematopoietic cells from
hPSCs without additional cytokine (9,12,13). Our limited understanding of this differentiation process is responsible for the low efficiency of CD34+hematopoietic cell
produc-tion (only 10–15% are CD34+). Thus, it is necessary to analyze the differentiation process in detail for further optimization. Signaling molecules provided by OP9 have been identified and analyzed by proteomic analysis (14).
Molecular profiling reveals gene expression characteris-tics of various hematopoietic progenitors identified by hema-topoietic markers (15,16). However, these studies provide limited guidance for further optimization.
Recent advances in single-cell-based gene expression analysis allow us to reveal the dynamic gene expression of individual CD34+ cells derived from hPSCs (17).
Single-cell qPCR, which can analyze specific gene expression at the single-cell level, has been used to reveal the hetero-geneity of blood cells effectively (18,19). In our study, single-cell qPCR was used to track the dynamic gene expression of individualCD34+cells from different stages
of differentiation. We clustered CD34+cells according to
the different gene expression characteristics. After transient overexpression of hematopoietic transcription factors (TFs), we generated moreCD34+cells with normal expression
level of CD43 and CD31, which were used to define hematopoietic progenitors in hPSCs/OP9 coculture system (15). Furthermore, these CD34+ cells possessed normal
differentiation potency in colony-forming unit (CFU) assays and normal gene expression profiles in single-cell gene expression analysis.
Correspondence: He Huang<[email protected]>
The purpose of our study was to optimize hemato-poietic differentiation in hPSCs/OP9 coculture system.
Material and Methods
Cell culture
hPSCs (NIH Codes: WA01, H1) were maintained on irradiated CF1 feeder cells as described in our previous paper (20). Before lentiviral transduction and hematopoi-etic differentiation, hPSCs were maintained in chemically defined mTeSRt1 medium (StemCell Technologies, Canada) without feeder as described previously (21). The 293T cells were maintained in DMEM medium (Invitrogen, USA) supplemented with 10% fetal bovine serum (FBS, Hyclone, USA). GFP-labeled OP9 (OP9-GFP) cells were maintained ina-MEM medium (Gibco, USA) supplemented with 20% FBS (Gibco) (12). hPSCs (H1 or H1+TFs) monolayers at 70% confluence were cultured in X-Vivo 15 medium (Lonza, Switzerland) sup-plemented with 1mg/mL doxycycline (Dox), 1 mM sodium pyruvate (Sigma-Aldrich, USA), 1x non-essential amino acids (Invitrogen), 2 mM L-glutamine (Invitrogen), 50 mM 2-mercaptoethanol (Sigma-Aldrich), and the four growth factors, including 50 ng/mL recombinant human bone morphogenetic protein-4 (rhBMP-4, R&D, USA), 50 ng/mL recombinant human vascular endothelial growth factor (rhVEGF, R&D), 50 ng/mL recombinant human granulo-cyte-macrophage colony-stimulating factor (rhGM-CSF, R&D), and 20 ng/mL recombinant human stem cell factor (rhSCF, R&D). After a 4-day culture, cells were collected forflow cytometry analysis.
Gene cloning and lentiviral vectors construction
The gene sequences were downloaded and managed by CLC sequence Viewer 7 (Qiagen, Germany) for primers design. Pfx (Invitrogen) was used to amplify gene open reading frames (ORFs) from 10-day Embryoid Body cDNAs of H1 or cDNAs bought from YouBio (China). ORFs were cloned into pEASY-Blunt Simple Vectors (Transgen Biotech, China) for sequence verification. Correct ORFs were subcloned into our Lv-ef1a-eGFP-tre-genes backbone (22). The cloned genes are listed in Supplementary Table S1.
Lentiviral packaging
We packaged lentivirus as previously described (22). Lentiviral vectors and two helper vectors (D8.91 and pVSVG) were transfected into 293T with FuGENE HD (Roche, Switzerland). Packaged lentiviral units were col-lected at 48 and 72 h post-transfection. After titering, lentiviral units were stored in–80°C.
Lentiviral transduction of hPSCs
After rinsing with PBS, hPSCs of 70% confluence were disaggregated to single cells by Accutase (Gibco). Cells (4105) were seeded on Matrigel (BD, USA) coated
6-well plates with 2 mL of mTeSRt1 medium supplemented with 10mM Y-27632 ROCK inhibitor (Selleck, USA). After 48-h incubation, the original medium was replaced with fresh virus-containing mTeSRt1 medium (multiplicity of infection of 5–10) supplemented with 10mg/mL polybrene (Sidansai, China). Virus-containing medium was removed 12 h after transduction. Lentivirus of specific genes (Lv-ef1a-eGFP-tre-genes) and rtTA (Lv-ef1a-rtTA-IRES-puro) were transduced simultaneously and 0.5mg/mL puromy-cin was used to enrich positive cells. Genomic PCR was used to confirm virus integration. Forty-eight hours after treatment with 1mg/mL Dox, qPCRs were used to confirm the transgene mRNA expression. Primers are listed in Supplementary Tables S2 and S3.
Reverse transcription-polymerase chain reaction (RT-PCR) and real-time polymerase chain reaction (qPCR)
Total RNA prepared by RNeasy kit (Qiagen) was used as the templates for RT-PCR as described in our previous paper (23). qPCR was performed in LightCycler 480 (Roche) with SYBR Green-based PCR Master mix (Toyobo, Japan). Ct (threshold cycle) values of samples were analyzed by DDCt method withACTB as reference gene. The primers are listed in Supplementary Tables S3 and S4.
Hematopoietic differentiation of hPSCs in hPSCs/OP9 coculture system
enriched using EasySept CD34 positive selection kit (StemCell Technologies) for CFU assays, single-cell qPCR, andflow cytometry analysis.
Flow cytometry analysis of cell phenotype
Cells suspended in Recommended Medium were labeled with antibodies at 4°C for 30 min. Antibodies used were PE-Cyt7 Mouse Anti-Human CD34 (BD), PE anti-human CD43 (BioLegend, USA), and PE anti-human CD31 (BioLegend). After staining, cells were analyzed by CytomicstFC 500 (Beckman, USA) with FlowJo soft-ware (Tree Star, USA).
Single-cell specific target amplification
Primers pool was prepared as described previously (18). Primers used are listed in Supplementary Table S4. Individual cells were picked up into 8-strip PCR tubes with 5mL RT-PreAmp Master Mix (1.9mL nuclease free water, 2.5mL Reaction Mix, and 0.1mL RT/Taq enzyme were mixed with 0.5 mL primers pool; Single Cell Sequence Specific Amplification Kit, Vazyme, China) by special Pasteur pipettes (Brand, Germany). Eight-strip PCR tubes were immediately frozen in–80°C refrigerator for 2 min. After brief centrifugation (300 g, 4°C, 3 min), tubes were immediately moved to PCR machine fol-lowing kit instructions. After preamplification, samples were diluted 100-fold with double distilled water prior to qPCR.
Gene expression analysis using single-cell qPCR
Single-cell qPCR was performed in LightCycler 480 (Roche) with SYBR Green-based PCR Master Mix (Toyobo). The primers are listed in Supplementary Table S4. A back-ground Ct (30) was used for single-cell samples correspond-ing to log2 gene expression (log2 gene expression=30-Ct). Single-cell samples with outliers of ACTBgene expression were removed from the dataset. MeV (MultiExperiment Viewer, Dana-Farber Cancer Institute, USA) was used for analysis of hierarchical clustering (HCL) and non-negative matrix factorization (NMF). The ggplot2 and base plot package of R software (R Core Team, New Zealand) were used for plot drawing.
CFU assays
CFU assays were performed using MethoCulttH4435 Enriched (StemCell Technologies) following manufacturer’s instructions. Three milliliters MethoCulttwith 5103/mL CD34+cells and penicillin-streptomycin were added onto
35-mm low-adherent plastic dishes. CFUs were counted and identified after 10–14 days of incubation according to the guide provided by StemCell Technologies.
Statistical analysis
Data were analyzed by Prism 5 software (GraphPad, USA). Data are reported as means±SE. Significant differ-ences were based on Po0.05 for all experiments.
Results and Discussion
Hematopoietic differentiation of H1 in hPSCs/OP9 coculture system
Hematopoietic differentiation ability of H1 in hPSCs/ OP9 coculture system was confirmed (Figure 1A) as described previously (12). Usingflow cytometry analy-sis, we could easily distinguish H1 from OP9 because of the expression of GFP in OP9. After 8–9 days of differentiation, there were 10–15% CD34+ cells. After magnetic cell sorting, the isolatedCD34+cells, which
ranged around 90% of the enriched fraction, were used in CFU assays and the following experiments (Figure 1B). The morphology of different CFUs was observed, includ-ing macrophage (M), granulocyte and macrophage (GM), granulocyte, erythroid, macrophage, and megakaryocyte (GEMM), and erythroid (E) (Figure 1C). Thus, our H1/OP9 coculture system was stable for the following study of hematopoietic differentiation.
Single-cell gene expression analysis of CD34+cells derived from H1/OP9 coculture system
To study the process of hematopoietic differentiation in H1/OP9 coculture system, we used single-cell gene expression analysis. CD34+ cells appeared as early as
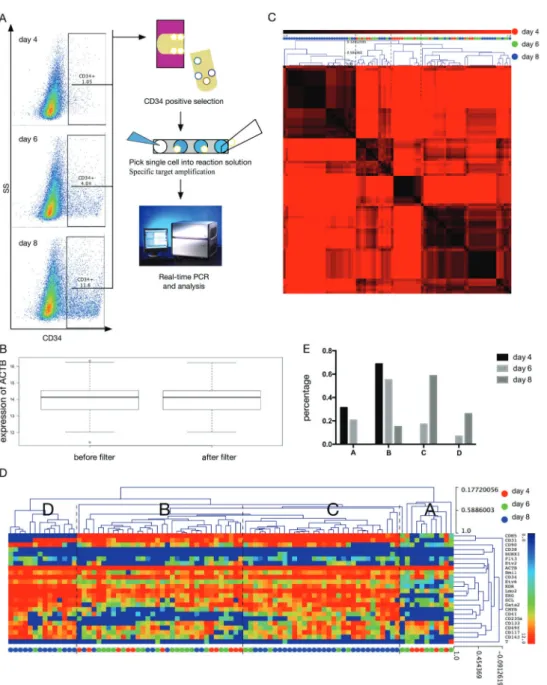
days 3 and 4 of coculture and the proportion increased during differentiation (Figure 2A) (12). Individual CD34+
cells were enriched and picked up at days 4 (n=24), 6 (n=36), and 8 (n=48; Figure 2A). Because the complex-ity and percentage of CD34+ cells increased during
differentiation (15), more individual cells were analyzed at days 6 and 8. Because we used magnetic cell sorting to enrich CD34+ cells, we could not catch cells with
low or no expression of CD34, which were important for the hematopoietic differentiation study at the initial stage. All human cells (CD34positive or negative) derived from hPSCs can be analyzed by high-throughput single-cell RNA-sequencing in our further research, which will help us study the differentiation process beforeCD34+cells appear.
After single-cell specific target amplification, single-cell qPCR was performed to check the expression level of CD34andACTB.We removed the samples withoutCD34 expression, which corresponded to empty tubes or false positive cells. Then, we filtered samples based on the expression level ofACTB(Figure 2B). Lower and higher expression level of ACTB indicated RNA degradation and multicellular interference, respectively. Afterfiltering, 91 samples (day 4, n=16; day 6, n=29; day 8, n=46) were qualified with stable expression trends of ACTB and CD34from days 4 to 8 (Figure 3B).
We used single-cell qPCR to measure the expression level of endothelial/hematoendothelial markers and hema-topoietic TFs. Individual CD34+ cells from days 4, 6,
differentiation were well clustered into 4 groups (A, B, C, and D; Figure 2D and E). The heatmap of NMF, which showed cell-to-cell correlation, also had a high score with factorization rank 4 (Figure 2C). Group A was com-posed of single-cell samples from day 4 (5/16=31.3%) and day 6 (6/29=20.7%; Figure 2E). The expression level of endothelial/hematoendothelial markers (CD34, CDH5, KDR, andCD31) and hematopoietic TFs (Bmi1,Etv6,Lmo2, ERG,SCL,Gata2,CMYB, etc.) was low in most of group A (Figure 2D). With few features of endothelial/hematoendothe-lial cells (24), theseCD34+cells might be at the
mesodermal-to-endothelial phase. Group B was composed of individual CD34+cells from days 4 (11/16=68.7%), 6 (16/29=55.2%),
and 8 (7/46=15.2%; Figure 2E). Compared to group A, group B had a higher expression level of endothelial/hematoen-dothelial markers, which indicated the enendothelial/hematoen-dothelial commit-ment (Figure 2D) (24); the expression level of hematopoietic TFs increased moderately. Compared to group B, both group C (day 6, 5/29=17.2%; day 8, 27/46=58.7%) and group D (day 6, 2/29=6.9%; day 8, 12/46=26.1%; Figure 2E) had higher expression levels of hematopoietic TFs (Figure 2D).
Group D did not expressCDH5and may indicate the com-mitment of hematopoietic progenitors from hematoendothelial cells.
The gene heatmap of NMF with factorization rank 3 shows the gene-to-gene correlation (Figure 3A). CD41 (a marker of megakaryocytes),CD235a, andCMYBwere clustered together because of their similar expression dynamics (Figure 3A). They were highly expressed in both groups C and D with similar cell distribution (Figure 2D); their expression trends from days 4 to 8 were similar (Figure 3B). This relationship could also be found in pre-vious reports. Double positive ofCD41andCD235awas used to define erythro-megakaryocytic progenitors (E/Mk-HP) as reported previously (16). BloodSpot database also showed that CD41, CD235a, and CMYB were mainly located in E/Mk-HP of healthy samples (25) (Figure 3C). Both groups C and D had individual cells with high expres-sion levels of CD41 and CD235a, but the expression distribution ofCD31andCDH5was different in groups C and D. It is possible thatCD41+CD235a+CD31+CDH5+
(C group) cells down regulated the expression of CD31
and CDH5 to become CD41+CD235a+CD31 -CDH5 -(D group) cells in the process of differentiation and maturation.
We also found that some hematopoietic TFs were gradu-ally up-regulated during the differentiation (Figure 2D).
OP9 coculture system was enough to up-regulate these TFs at day 8. We wanted to explore the possibility that overexpression of these hematopoietic TFs at early stage of differentiation could improve the efficiency of hemato-poietic differentiation in this coculture system.
Induced expression of hematopoietic transcription factors enhanced hematopoietic differentiation
The TFs were overexpressed using Tet-On inducible expression system as shown in our previous papers (22,23). This approach possessed the advantage that hPSCs could retain their pluripotency and self-renewal ability after lentivirus transduction; exogenous genes did not express until Dox was added. After 48 h of Dox treatment, we induced the expression of mCherry in H1 transduced by mCherry lentivirus (Figure 4A). We assembled a list of key
TFs through analysis of our single-cell gene expression data (Figure 2D) and literature review (26–28). The pilot experi-ments showed serious death of hPSCs after excessive transduction of 18 exogenous genes. Results suggested that hPSCs were more sensitive thanfibroblasts to the stress of lentiviral transduction (29). Thus, we narrowed the TFs list tofive (Gata2,Lmo2,Etv2,ERG,SCL), which were used in other hematopoietic differentiation strategies (26,27,30).
After lentiviral transduction, H1 cells were collected for genomic PCR to confirm the integration of exogenous
genes (Figure 4B), which were induced by Dox treatment (Figure 4C). We found that samples exposed to Dox had fewer cells than control groups, suggesting that over-expression of exogenous genes induced cell death or cell differentiation with proliferation inhibition. To reduce the adverse impact of overexpression, we optimized the treatment time of Dox. We added Dox at different stages of differentiation, including treat1, treat2, and treat3 (Figure 4D). Dox treatment increased the percentage of CD34+cells
significantly (Figure 4E). Both treat2 and treat3 had higher proportion of CD34+cells than no treatment and treat1.
We got 0.8–110 5
CD34+ cells from no treat group,
and 2–3105 CD34+ cells from treat2 and treat3, demonstrating that Dox treatment from days 1 to 4 (treat2 and treat3) was crucial for differentiation ofCD34+cells.
Treat2 with additional Dox treatment did not generate moreCD34+cells than treat3 (Figure 4E). Our single-cell
gene expression analysis showed that OP9 system could up-regulate most of these TFs after day 4 (Figure 2D). Then, we inferred that overexpression of these exogenous genes mainly promoted the differentiation at the initial stage (before day 4). Of note, continuous overexpression
could not improve hematopoietic differentiation anymore and may disrupt the expression of endogenous genes and differentiation signals provided by OP9. Based on these results and analysis, we added Dox as treat3 in the following experiments.
We tried to induce hematopoietic differentiation from monolayer hPSCs without OP9, resulting in moreCD34+
cells with only 4 days differentiation (Supplementary Figure S1). H1 cells without TFs overexpression had few CD34+cells (
B1%), and H1 with TFs overexpression had 20B30%CD34+cells, suggesting that these transcription factors were very important during hematopoietic differ-entiation as previous papers have reported (26,27,30).
Mixed TFs cover up the effect of individual TFs. We found that individual TFs can increase the percentage of CD34+cells, especially SCL(Figure 4F). Many other
hematopoietic TFs have been reported in hematopoietic differentiation studies (28,30–34). Therefore, we should screen more TFs combinations (single and mixed) and overexpression strategies in further research. By combin-ing scombin-ingle-cell gene expression analysis, we can study the effect of single or mixed TFs in the process of hemato-poietic differentiation, and optimize our hematohemato-poietic differentiation system.
In our study, exogenous TFs integrated into the genome of hPSCs by lentiviral transduction. In a previous study, an exogenous gene (Lhx2) was overexpressed in OP9 (OP9-Lhx2) (35) to enhance hematopoietic differentiation of hPSCs. This strategy avoids the tumorigenic risk of blood cells derived from hPSCs with lentivirus integra-tion. It is generally agreed that tumorigenic risk needs to be taken seriously in the differentiation of tissue cells for replacement therapy, such as long-lived HSCs, neural cells, and muscle cells. Mature blood cells have a relatively short life span. As most clinical blood products (36), mature red blood cells and platelets do not have nuclei. Therefore, the risk of tumorigenesis caused by lentivirus integration is not so serious in the differentia-tion of hematopoietic progenitors for the generadifferentia-tion of mature blood cellsin vitro.
Expressional and functional analysis of CD34+cells with transcription factors overexpression
Hematopoietic TFs played a decisive role in hemato-poietic differentiation. Different combination of TFs induced differentiation of different hematopoietic progenitors (26). Though exogenous TFs were induced only at early stage of differentiation, we did not know whether the fate ofCD34+
cells was disturbed by these TFs overexpression. Thus, we needed to check the differentiation potential of these CD34+cells.
Compared to CD34, CD43 was a better marker to define hematopoietic progenitors in hPSCs/OP9 coculture system (15,16). Before CD45 expression, CD43 was expressed in all types of emerging progenitors. CD43
was used to separate hematopoietic progenitors from endothelial cells (CD34+CD43-CD31+KDR+) and
mesenchy-mal cells (CD34+CD43
-CD31-KDR-) (15). After Dox treatment, there was no significant difference between overexpression group and control group in the percent-age ofCD43+cells andCD31+cells at day 8 (Figure 5A).
CFU assays also showed normal differentiation potency of CD34+cells with TFs overexpression (Figure 5B and C).
Single-cell gene expression analysis also showed similar gene expression characteristics ofCD34+cells (H1: n=14.
H1+TFs: n=21) at day 8 (Figure 5D), such as CD43, CD31, CD117, and CDH5. After overexpression, we generated moreCD34+cells with normal differentiation
potency for further myeloid cells and erythroid cells differentiation. Transient overexpression of specific hema-topoietic TFs at early stage of differentiation did not disrupt the differentiation signals provided by OP9.
Previous reports showed that HSCs had lineage biases before lineage differentiation (37,38). Overex-pression of TFs may generate hematopoietic progeni-tors with lineage biases, which prefer to produce one or two types of mature blood cells. Unipotent hematopoietic progenitors are important for the production of mature blood cells for clinical use. Through single-cell analysis of defined mature blood cells derived from hPSCs with a random integration of exogenous genes, we may reveal the relationships between specific exogenous genes integration and lineage biases of hematopoietic progenitors.
In conclusion, single-cell gene expression analysis revealed the dynamic gene expression of individual CD34+ cells from different stages of differentiation in
hPSCs/OP9 coculture system. Results provided guidance for optimization of hematopoietic differentiation. High-throughput single-cell analysis, including single-cell qPCR and single-cell RNA-sequencing, can provide better gene expression profiles of OP9 and hPSCs for optimization of hematopoietic differentiation in hPSCs/ OP9 coculture system.
Supplementary Material
Click here to view [pdf]
Acknowledgments
References
1. Thomson JA, Itskovitz-Eldor J, Shapiro SS, Waknitz MA, Swiergiel JJ, Marshall VS, et al. Embryonic stem cell lines derived from human blastocysts.Science1998; 282: 1145– 1147, doi: 10.1126/science.282.5391.1145.
2. Yu JY, Vodyanik MA, Smuga-Otto K, Antosiewicz-Bourget J, Frane JL, Tian S, et al. Induced pluripotent stem cell lines derived from human somatic cells. Science 2007; 318: 1917–1920, doi: 10.1126/science.1151526.
3. Takahashi K, Tanabe K, Ohnuki M, Narita M, Ichisaka T, Tomoda K, et al. Induction of pluripotent stem cells from adult humanfibroblasts by defined factors.Cell2007; 131: 861–872, doi: 10.1016/j.cell.2007.11.019.
4. Dye BR, Hill DR, Ferguson MA, Tsai YH, Nagy MS, Dyal R, et al. In vitro generation of human pluripotent stem cell derived lung organoids. eLife 2015; doi: 4.10.7554/eLife. 05098.
5. Hayashi R, Ishikawa Y, Katori R, Sasamoto Y, Taniwaki Y, Takayanagi H, et al. Coordinated generation of multiple ocular-like cell lineages and fabrication of functional corneal epithelial cell sheets from human iPS cells.Nat Protoc2017; 12: 683–696, doi: 10.1038/nprot.2017.007.
6. Spence JR, Mayhew CN, Rankin SA, Kuhar MF, Vallance JE, Tolle K, et al. Directed differentiation of human pluripotent stem cells into intestinal tissue in vitro. Nature 2011; 470: U105–U120, doi: 10.1038/nature09691.
7. Zhong X, Gutierrez C, Xue T, Hampton C, Vergara MN, Cao LH, et al. Generation of three-dimensional retinal tissue with functional photoreceptors from human iPSCs.Nat Commun 2014; 5: 4047, doi: 10.1038/ncomms5047.
8. Takebe T, Zhang RR, Koike H, Kimura M, Yoshizawa E, Enomura M, et al. Generation of a vascularized and functional human liver from an iPSC-derived organ bud transplant. Nat Protoc 2014; 9: 396–409, doi: 10.1038/ nprot.2014.020.
9. Choi KD, Vodyanik M, Slukvin II. Hematopoietic differentia-tion and producdifferentia-tion of mature myeloid cells from human pluripotent stem cells. Nat Protoc 2011; 6: 296–313, doi: 10.1038/nprot.2010.184.
10. Slukvin II. Hematopoietic specification from human pluripo-tent stem cells: current advances and challenges toward de novo generation of hematopoietic stem cells.Blood2013; 122: 4035–4046, doi: 10.1182/blood-2013-07-474825. 11. Wahlster L, Daley GQ. Progress towards generation of human
haematopoietic stem cells.Nat Cell Biol2016; 18: 1111–1117, doi: 10.1038/ncb3419.
12. Vodyanik MA, Bork JA, Thomson JA, Slukvin II. Human embryonic stem cell-derived CD34+cells: efficient produc-tion in the coculture with OP9 stromal cells and analysis of lymphohematopoietic potential.Blood2005; 105: 617–626, doi: 10.1182/blood-2004-04-1649.
13. Dias J, Gumenyuk M, Kang H, Vodyanik M, Yu J, Thomson JA, et al. Generation of red blood cells from human induced pluripotent stem cells.Stem Cells Dev2011; 20: 1639–1647, doi: 10.1089/scd.2011.0078.
14. Figueiredo LM, Costa EB, Orellana MD, Picanco-Castro V, Covas DT. OP9 stromal cells proteins involved in hema-toendothelial differentiation from human embryonic stem cells.Cell Reprogram2015; 17: 338–346, doi: 10.1089/cell. 2015.0014.
15. Vodyanik MA, Thomson JA, Slukvin II. Leukosialin (CD43) defines hematopoietic progenitors in human embryonic stem cell differentiation cultures.Blood 2006; 108: 2095–2105, doi: 10.1182/blood-2006-02-003327.
16. Salvagiotto G, Zhao Y, Vodyanik M, Ruotti V, Stewart R, Marra M, et al. Molecular profiling reveals similarities and differences between primitive subsets of hematopoietic cells generated in vitro from human embryonic stem cells and in vivo during embryogenesis.Exp Hematol2008; 36: 1377– 1389, doi: 10.1016/j.exphem.2008.06.015.
17. Yan L, Yang M, Guo H, Yang L, Wu J, Li R, et al. Single-cell RNA-Seq profiling of human preimplantation embryos and embryonic stem cells.Nat Struct Mol Biol2013; 20: 1131– 1139, doi: 10.1038/nsmb.2660.
18. Guo G, Luc S, Marco E, Lin TW, Peng C, Kerenyi MA, et al. Mapping cellular hierarchy by single-cell analysis of the cell surface repertoire.Cell Stem Cell2013; 13: 492–505, doi: 10.1016/j.stem.2013.07.017.
19. Moore FE, Garcia EG, Lobbardi R, Jain E, Tang Q, Moore JC, et al. Single-cell transcriptional analysis of normal, aberrant, and malignant hematopoiesis in zebrafish.J Exp Med2016; 213: 979–992, doi: 10.1084/jem.20152013. 20. Lu P, Chen J, He L, Ren J, Chen H, Rao L, et al. Generating
hypoimmunogenic human embryonic stem cells by the disruption of beta 2-microglobulin.Stem Cell Rev2013; 9: 806–813, doi: 10.1007/s12015-013-9457-0.
21. Cui D, Wang J, Zeng Y, Rao L, Chen H, Li W, et al. Generating hESCs with reduced immunogenicity by disrupt-ing TAP1 or TAPBP.Biosci Biotechnol Biochem2016; 80: 1484–1491, doi: 10.1080/09168451.2016.1165601. 22. Rao L, Tang W, Wei Y, Bao L, Chen J, Chen H, et al. Highly
efficient derivation of skeletal myotubes from human embryonic stem cells.Stem Cell Rev2012; 8: 1109–1119, doi: 10.1007/s12015-012-9413-4.
23. Wu Z, Chen J, Ren J, Bao L, Liao J, Cui C, et al. Generation of pig induced pluripotent stem cells with a drug-inducible system.J Mol Cell Biol2009; 1: 46–54, doi: 10.1093/jmcb/ mjp003.
24. Zambidis ET, Peault B, Park TS, Bunz F, Civin CI. Hematopoietic differentiation of human embryonic stem cells progresses through sequential hematoendothelial, primitive, and definitive stages resembling human yolk sac development. Blood 2005; 106: 860–870, doi: 10.1182/ blood-2004-11-4522.
25. Bagger FO, Sasivarevic D, Sohi SH, Laursen LG, Pundhir S, Sonderby CK, et al. BloodSpot: a database of gene expression profiles and transcriptional programs for healthy and malignant haematopoiesis.Nucleic Acids Res2016; 44: D917–D924, doi: 10.1093/nar/gkv1101.
26. Elcheva I, Brok-Volchanskaya V, Kumar A, Liu P, Lee JH, Tong L, et al. Direct induction of haematoendothelial programs in human pluripotent stem cells by transcriptional regulators. Nat Commun 2014; 5: 4372, doi: 10.1038/ ncomms5372.
28. Sandler VM, Lis R, Liu Y, Kedem A, James D, Elemento O, et al. Reprogramming human endothelial cells to haemato-poietic cells requires vascular induction.Nature2014; 511: 312–318, doi: 10.1038/nature13547.
29. Takahashi K, Yamanaka S. Induction of pluripotent stem cells from mouse embryonic and adult fibroblast cultures by defined factors.Cell2006; 126: 663–676, doi: 10.1016/ j.cell.2006.07.024.
30. Batta K, Florkowska M, Kouskoff V, Lacaud G. Direct reprogramming of murinefibroblasts to hematopoietic pro-genitor cells.Cell Rep 2014; 9: 1871–1884, doi: 10.1016/ j.celrep.2014.11.002.
31. Szabo E, Rampalli S, Risueno RM, Schnerch A, Mitchell R, Fiebig-Comyn A, et al. Direct conversion of humanfi bro-blasts to multilineage blood progenitors.Nature2010; 468: 521–526, doi: 10.1038/nature09591.
32. Pereira CF, Chang B, Qiu J, Niu X, Papatsenko D, Hendry CE, et al. Induction of a hemogenic program in mouse fibroblasts.Cell Stem Cell2013; 13: 205–218, doi: 10.1016/ j.stem.2013.05.024.
33. Harris DM, Hazan-Haley I, Coombes K, Bueso-Ramos C, Liu J, Liu Z, et al. Transformation of human mesenchymal
cells and skinfibroblasts into hematopoietic cells.PLoS One 2011; 6: e21250, doi: 10.1371/journal.pone.0021250. 34. Riddell J, Gazit R, Garrison BS, Guo G, Saadatpour A,
Mandal PK, et al. Reprogramming committed murine blood cells to induced hematopoietic stem cells with defined factors.Cell2014; 157: 549–564, doi: 10.1016/j.cell.2014. 04.006.
35. Chen X, Zhao Q, Li C, Geng Y, Huang K, Zhang J, et al. OP9-Lhx2 stromal cells facilitate derivation of hematopoietic progenitors bothin vitroandin vivo.Stem Cell Res2015; 15: 395–402, doi: 10.1016/j.scr.2015.08.009.
36. Slukvin II. Generation of mature blood cells from pluripotent stem cells.Haematologica2010; 95: 1621–1623, doi: 10.3324/ haematol.2010.029231.
37. Velten L, Haas SF, Raffel S, Blaszkiewicz S, Islam S, Hennig BP, et al. Human haematopoietic stem cell lineage commit-ment is a continuous process.Nat Cell Biol2017; 19: 271–281, doi: 10.1038/ncb3493.