Revista Brasileira de
Engenharia Agrícola e Ambiental
Campina Grande, PB, UAEA/UFCG – http://www.agriambi.com.br
v.22, n.3, p.151-157, 2018
Soybean agronomic performance in response to seeding rate
and phosphate and potassium fertilization
DOI: http://dx.doi.org/10.1590/1807-1929/agriambi.v22n3p151-157
André S. Ferreira
1, Alvadi A. Balbinot Junior
2, Flávia Werner
1,
Júlio C. Franchini
2& Claudemir Zucareli
1A B S T R A C T
Most studies that found soybean high phenotypic plasticity under different seeding rates adopted the same fertilization levels used for the recommended seeding rates. Therefore, the interaction between these factors is little known. This study aims to assess the interaction between seeding rate and levels of phosphorus and potassium fertilization on soybean growth, grain yield and contents of protein and oil in the grains. The experiment was carried out under a randomized complete block design, in a split-plot scheme, with six replicates. Four seeding rates (150, 300, 440 and 560 thousand viable seeds ha-1) were used
in the plots, and two levels of phosphorus and potassium fertilizer were applied in the subplots to meet the export of 3 and 6 t ha-1 of grains (level 1 = 30 kg ha-1 of P
2O5 + 60 kg ha -1
of K2O; and level 2 = 60 kg ha-1 of P
2O5 + 120 kg ha -1 of K
2O). There was no interaction
between the experimental factors. Increase in fertilizer doses did not alter the evaluated characteristics, regardless of the seeding rate. Seeding rate did not change grain yield or protein and oil contents, but at low densities there was an increase in the number of pods per plant, apparent harvest index and SPAD index.
Desempenho agronômico da soja em resposta
à densidade de semeadura e fertilização fosfatada e potássica
R E S U M O
A maioria das pesquisas que constataram a plasticidade da soja em resposta a modificações na densidade de semeadura adotou os mesmos níveis de fertilização fosfatada e potássica utilizados para as densidades recomendadas. Portanto, a interação entre esses fatores é pouco conhecida. O objetivo foi investigar a interação entre densidade de semeadura e níveis de adubação fosfatada e potássica no crescimento vegetativo, desempenho produtivo e teores de óleo e proteína nos grãos de soja. O experimento foi conduzido, sob delineamento experimental de blocos casualizados, em parcelas subdivididas, com seis repetições. Nas parcelas foram alocadas quatro densidades de semeadura (150, 300, 440 e 560 mil sementes viáveis ha-1) e nas subparcelas dois níveis de fertilização (nível 1 = 30 kg ha-1 de P
2O5 +
60 kg ha-1 de K
2O; e nível 2 = 60 kg ha -1 de P
2O5 + 120 kg ha -1 de K
2O). Não houve interação
entre os fatores. O aumento das doses de fertilizantes não alterou as características avaliadas independentemente da densidade de semeadura. A densidade não alterou a produtividade e os teores de proteína e óleo nos grãos, mas em baixas densidades houve aumento no número de vagens por planta, índice de colheita aparente e índice SPAD.
Key words:
Glycine max (L.) Merrill plant spatial arrangement fertilization
plant density
Palavras-chave:
Glycine max (L.) Merrill arranjo espacial de plantas adubação
densidade de plantas
1 Universidade Estadual de Londrina/Centro de Ciências Agrárias/Departamento de Agronomia. Londrina, PR. E-mail: [email protected]
(Corresponding author) - ORCID: 0002-8224-9269; [email protected] - ORCID: 0001-5310-2279; [email protected] - ORCID: 0000-0002-5260-0468
2 Embrapa Soja. Londrina, PR. E-mail: [email protected] - ORCID: 0000-0003-3463-8152; [email protected] - ORCID: 0000-0002-8686-3012
Introduction
Soybean can alter its morphology in response to the modifications in planting density to adjust to the environmental conditions, maintaining its yield even with expressive variation in plant density (Board, 2000; Cox & Cherney, 2011; Javier de Luca et al., 2014).
At low densities, soybean plants tend to produce fewer branches, increasing the number of pods per plant, compensating the lower number of individuals per area with higher production per plant. In contrast, at high plant densities, there is less branching and the production of each plant is lower and more dependent on the main stem (Ferreira et al., 2016; Werner et al., 2016).
Thus, the adjustment in the quantity of seeds per area aiming to maximize grain yield and/or reduce seed consumption is an important practice to increment the profitability of the crop, especially because of the increase observed in recent years in the costs of seeds and their chemical treatment (Board & Kahlon, 2013; Thompson et al., 2015; Gaspar et al., 2017). According to Hirakuri (2017), the costs with sowing (seeds + treatment) in the Paraná state, in the 2016/17 season, represented 15% of the costs with inputs for soybean RR1 and 27% for soybean Intacta RR2.
Nevertheless, most studies that confirmed soybean plasticity against the alterations in seeding rate adopted the same levels of phosphate and potassium fertilization used for the recommended densities (Bruns, 2011; Gaspar et al., 2015). Therefore, increase in P and K availability in the soil may minimize intraspecific competition for these nutrients, allowing increments in soybean grain yield with the increase in seeding rate.
In this context, the present study is based on the following scientific questions: 1) Does the increment in P and K doses allow to increase the seeding rate of modern soybean cultivars with gains in grain yield and increase in oil and protein contents? 2) At low planting densities, can the increase in P and K doses enhance plant growth, incrementing the effect of compensation through higher grain production per plant?
This study aimed to investigate the interaction between seeding rate and levels of phosphate and potassium fertilization on vegetative growth, production performance and contents of oil and protein in soybean grains.
Material and Methods
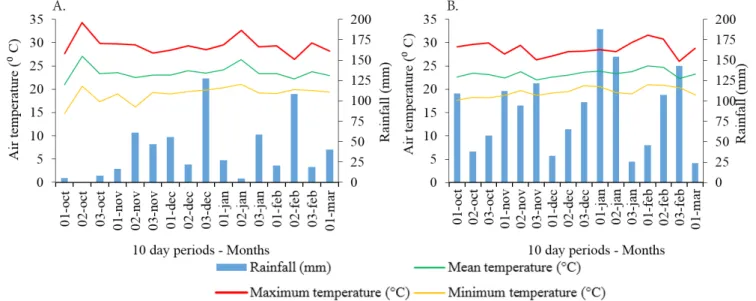
The experiment was carried out in Londrina, Paraná, Brazil (23° 19’ 21” S; 51° 20’ 46” W; 620 m) during the 2014/15 and 2015/16 seasons. The climate of the region is classified as humid subtropical (Cfa) according to Köppen’s classification. Minimum, mean and maximum air temperatures and cumulative rainfall along the experiments were recorded by the Embrapa Soybean weather station, 600 m away from the experiment, and are presented in Figure 1.
The soil of the experimental area is classified as dystroferric Red Latosol and has been cultivated under direct seeding system for the last 15 years, using soybean or corn (Zea mays L.) as summer crops and wheat (Triticum aestivum) or black oat (Avena strigosa) as winter crops.
Soil physical and chemical characteristics, according to Tedesco et al. (1995), in the 0-20 cm layer in the 2014/15 season were: 75% of clay, 21.4 g dm–3 of organic C; pH
(CaCl2)4.9; 12.2 mg dm–3 of P (Mehlich-1); 0.55 cmol c dm
–3 of
exchangeable K; 3.7 cmolc dm–3 of exchangeable Ca; 1.4 cmol c
dm–3 of exchangeable Mg; 14 mg dm–3 of S. In the 2015/16
season, the experiment was conducted in another area, which showed the following characteristics: 74% of clay, 18.3 g dm–3
of organic C; pH (CaCl2)5.1; 18.6 mg dm–3 of P (Mehlich-1);
while exchangeable bases K, Ca and Mg were 0.37, 3.4 and 1.4 cmolc dm–3, respectively. P and K contents for both areas
were classified as high or very high (SBCS, 2017).
The previous crops before soybean were black oat in the 2014/15 season and wheat in the 2015/16 season. Black oat residues were managed with mower, without turning the soil, 30 days before sowing. In both seasons, weeds were chemically desiccated with glyphosate (1,080 g ha-1) and
carfentrazone-ethyl (30 g ha-1) 15 days before sowing.
Total rainfall accumulated in the period: 622 mm (2014/15) and 1,445 mm (2015/16)
Figure 1. Minimum, mean and maximum air temperature and rainfall accumulated along the experiments, season 2014/15 (A) and 2015/16 (B)
The experimental design was randomized complete blocks and split plots, with six replicates. Plots corresponded to four seeding rates (150, 300, 440 and 560 thousand viable seeds ha-1),
with spacing of 0.5 m between rows. Subplots received two levels of phosphate and potassium fertilization: Level 1 (30 kg ha-1
of P2O5 + 60 kg ha-1 of K
2O) and Level 2 (60 kg ha -1 of P
2O5 +
120 kg ha-1 of K
2O). Levels 1 and 2 were determined to meet
an export of 3 and 6 t ha-1 of grains, respectively (EMBRAPA,
2011). Single superphosphate (18% P2O5, 20% Ca+ and 12%
SO4) and potassium chloride (60% K2O) were applied broadcast 10 days before soybean sowing.
Subplots were 5 x 5 m, with evaluation area of 6 m² (4.0 m long, 1.5 m wide). In the 2014/15 season, the area was irrigated three days before sowing with a 30-mm water depth, due to the drought period occurred in October (Figure 1A).
Sowing was performed on October 28, 2014, and October 21, 2015, with a mechanical seeder. The cultivar used was BRS 359 RR, which has indeterminate growth habit, relative maturation degree of 6.0 and recommended density of 220 to 265 thousand plants ha-1 for this region. Seeds showed
germination of 87 and 89% in the 2014/15 and 2015/16 seasons, respectively, and were treated on the sowing day with Vitavax-Thiram 200 SC (200 g Carboxin + 200 g Thiram mL-1;
2.5 mL kg-1 of seeds) and inoculant Gelfix® (Bradyrhizobium
elkaniibr 5 x 10⁹ colony forming units mL-1; 2 mL kg-1 of seeds).
The different seeding rates led to the following plant densities at harvest: 105, 210, 340 and 425 thousand plants ha-1 and
120, 230, 340 and 380 thousand plants ha-1, in the 2014/15
and 2015/16 seasons, respectively. Pests and diseases were controlled according to the technical recommendations for the crop.
Shoot dry matter (SDM) was evaluated 45 days after sowing (DAS) in the 2014/15 season and at 59 DAS in the 2015/16 season, by collecting, separating, drying and weighing leaves and stems of plants present in a 1-m2 area. After dry matter
determination, leaf dry matter was divided by stem dry matter to obtain the leaf/stem ratio.
Chlorophyll content in the leaves was indirectly evaluated through the SPAD index, at 106 DAS, in the 2014/15 season, using a SPAD chlorophyll meter – 502, Konica Minolta. In both seasons, the number of plants emerged at V1 stage and the number of surviving plants at R8 stage were counted exactly in the same place of each subplot, in 3 m2 of the evaluation
area, thus obtaining plant mortality rate.
The evaluation area was mechanically harvested and yield was corrected to 130 g kg-1 of moisture. At harvest, 20 plants were
collected for evaluation of plant height (PH), first pod height (FPH), stem diameter in the first internode (SD), number of pods per plant (NPP), number of grains per pod (NGP), thousand-grain weight (1000GW), contents of oil and protein in the thousand-grains and apparent harvest index (AHI). The variables FPH, SD and AHI were evaluated only in the first season.
1000GW was evaluated by weighing eight 100-grain replicates on 0.001-g precision scale. Oil and protein contents were determined in healthy soybean grains by the Near Infrared Reflectance (NIR) technique, according to Heil (2010). The grains of each sample were subjected to readings, with a Thermo Scientific™, model Antaris II, equipped with 4-cm-1 resolution
integrating sphere, mean of 32 scans and background every reading. AHI was estimated by the following equation: [grain dry matter/(grain dry matter + straw dry matter)].
The data were subjected to normality and homoscedasticity tests of the treatment variances (Hartley’s test). After verifying the assumptions of the Analysis of Variance, analyses were carried out and means were compared by F test (p < 0.05) for the factor fertilization. The factor seeding rate was subjected to regression analysis, selecting the models that showed the best fit to the data and to the phenomenon investigated.
Results and Discussion
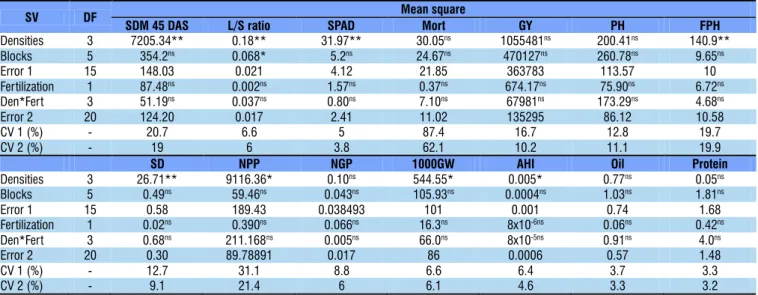
There was no interaction between seeding rate and potassium and phosphate fertilization, and fertilization levels also had no significant effect on any variable (Tables 1 and 2).
ns Not significant, ** and *Significant at 0.01 and 0.05 probability levels, respectively, by F test; SV – Source of variation; SDM 45 DAS – Shoot dry matter at 45 days after sowing; L/S ratio – Leaf/Stem ratio; Mort – Plant mortality; GY – Grain yield; PH – Plant height; FPH – First pod height; SD – Stem diameter; NPP – Number of pods per plant; NGP – Number of grains per pod; 1000GW – Thousand-grain weight; AHI – Apparent harvest index
SV DF Mean square
SDM 45 DAS L/S ratio SPAD Mort GY PH FPH
Densities 3 7205.34** 0.18** 31.97** 30.05ns 1055481ns 200.41ns 140.9** Blocks 5 354.2ns 0.068* 5.2ns 24.67ns 470127ns 260.78ns 9.65ns
Error 1 15 148.03 0.021 4.12 21.85 363783 113.57 10
Fertilization 1 87.48ns 0.002ns 1.57ns 0.37ns 674.17ns 75.90ns 6.72ns Den*Fert 3 51.19ns 0.037ns 0.80ns 7.10ns 67981ns 173.29ns 4.68ns
Error 2 20 124.20 0.017 2.41 11.02 135295 86.12 10.58
CV 1 (%) - 20.7 6.6 5 87.4 16.7 12.8 19.7
CV 2 (%) - 19 6 3.8 62.1 10.2 11.1 19.9
SD NPP NGP 1000GW AHI Oil Protein
Densities 3 26.71** 9116.36* 0.10ns 544.55* 0.005* 0.77ns 0.05ns Blocks 5 0.49ns 59.46ns 0.043ns 105.93ns 0.0004ns 1.03ns 1.81ns
Error 1 15 0.58 189.43 0.038493 101 0.001 0.74 1.68
Fertilization 1 0.02ns 0.390ns 0.066ns 16.3ns 8x10⁻⁶ns 0.06ns 0.42ns Den*Fert 3 0.68ns 211.168ns 0.005ns 66.0ns 8x10⁻⁵ns 0.91ns 4.0ns
Error 2 20 0.30 89.78891 0.017 86 0.0006 0.57 1.48
CV 1 (%) - 12.7 31.1 8.8 6.6 6.4 3.7 3.3
CV 2 (%) - 9.1 21.4 6 6.1 4.6 3.3 3.2
In the 2014/15 season, seeding rate had isolated effect on the variables: SDM at 45 DAS, leaf/stem ratio at 45 DAS, FPH, SD, NPP, 1000GW, AHI and SPAD index. In the 2015/16 season, seeding rate influenced SDM at 59 days, PH, NPP and 1000GW.
SDM at 45 DAS increased linearly in the 2014/15 season and quadratically in the 2015/16 season in response to the increment in seeding rate (Figure 2A). This result is corroborated by Werner et al. (2016), because in this period the higher number of plants results in higher biomass accumulation per area. On the other hand, these authors found that, at the beginning of grain filling, seeding rate has no influence on total SDM. These facts demonstrate that, as the soybean cycle progresses, the crop at low densities can compensate the lower number of plants by greater vegetative growth, and this phenomenon has been described in the literature as phenotypic plasticity (Board & Kahlon, 2013; Balbinot Júnior et al., 2015a, b).
In the 2014/15 season, leaf/stem ratio at 45 DAS decreased linearly with the increment in seeding rate (Figure 2A), indicating that the increase in intraspecific competition reduced the allocation of photoassimilates in the leaves, compared with the stem, as found by Werner et al. (2016). According to Procópio et al. (2013), at low densities, soybean plants accumulate more biomass in the leaves, in detriment
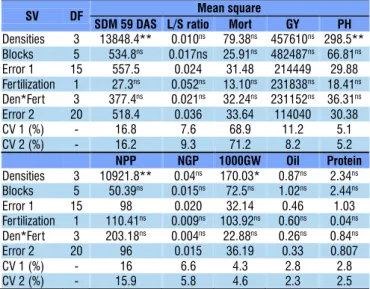
Table 2. Analysis of variance summary for the agronomic characteristics evaluated in soybean plants as a function of seeding rate and phosphate and potassium fertilization in the 2015/2016 season in Londrina-PR, Brazil
SV DF Mean square
SDM 59 DAS L/S ratio Mort GY PH
Densities 3 13848.4** 0.010ns 79.38ns 457610ns 298.5** Blocks 5 534.8ns 0.017ns 25.91ns 482487ns 66.81ns Error 1 15 557.5 0.024 31.48 214449 29.88 Fertilization 1 27.3ns 0.052ns 13.10ns 231838ns 18.41ns Den*Fert 3 377.4ns 0.021ns 32.24ns 231152ns 36.31ns Error 2 20 518.4 0.036 33.64 114040 30.38 CV 1 (%) - 16.8 7.6 68.9 11.2 5.1 CV 2 (%) - 16.2 9.3 71.2 8.2 5.2
NPP NGP 1000GW Oil Protein
Densities 3 10921.8** 0.04ns 170.03* 0.87ns 2.34ns Blocks 5 50.39ns 0.015ns 72.5ns 1.02ns 2.44ns Error 1 15 98 0.020 32.14 0.46 1.03 Fertilization 1 110.41ns 0.009ns 103.92ns 0.60ns 0.04ns Den*Fert 3 203.18ns 0.004ns 22.88ns 0.26ns 0.84ns Error 2 20 96 0.015 36.19 0.33 0.807 CV 1 (%) - 16 6.6 4.3 2.8 2.8 CV 2 (%) - 15.9 5.8 4.6 2.3 2.5
ns Not significant, ** and *Significant at 0.01 and 0.05 probability levels, respectively, by F test; SV – Source of variation; SDM 59 DAS – Shoot dry matter at 59 days after sowing; L/S ratio – Leaf/Stem ratio; Mort – Plant mortality; GY – Grain yield; PH – Plant height; FPH – First pod height; SD – Stem diameter; NPP – Number of pods per plant; NGP – Number of grains per pod; 1000GW – Thousand-grain weight
Figure 2. Agronomic characteristics of soybean in response to seeding rate (150, 300, 440 and 560 thousand viable seeds ha-1)
(A) Shoot dry matter (SDM) at 45 days after sowing (DAS) in the 2014/15 season (linear: Ŷ = 8.8253 + 0.1374x; R2: 0.99; CV: 20.7%) and at 59 DAS in the 2015/16 season (quadratic:
Ŷ = 39.585 + 0.4168x – 0.0003x2; R2: 0.99; CV: 16.8%) and leaf/stem ratio at 45 DAS in the 2014/15 season (linear: Ŷ = 2.4461 - 0.0007x; R2: 0.92; CV: 6.6%).
(B) First pod height (FPH) in the 2014/15 season (quadratic: Ŷ = 5.4424 + 0.0479x - 0.00004x2; R2: 0.95; CV: 19.7%); plant height (PH) in the 2015/16 season (quadratic: Ŷ = 92.925 + 0.0561x – 0.00004x2; R2: 0.99; CV: 5.1%); and stem diameter (SD) in the 2014/15 season (quadratic: Ŷ = 11.0249 - 0.0225x + 0.00002x2; R2: 0.99; CV: 12.7%).
(C) Number of pods per plant (NPP) in the seasons 2014/15 (quadratic: Ŷ = 135.03 - 0.4043x + 0.0004x2; R2: 0.99; CV: 31.1%) and 2015/16 (quadratic: Ŷ = 181.65 – 0.6051x + 0.0006x2; R2: 0.99; CV: 16.0%) and thousand-grain weight (1000GW) in the seasons 2014/15 (quadratic: Ŷ = 175.36 – 0.1028x + 0.00009x2; R2: 0.99; CV: 6.6%) and 2015/16 (linear:
Ŷ = 124.31 + 0.0211x2; R2: 0.98; CV: 4.3%).
of stem, to increase the interception of light incident on the canopy. In the 2015/16 season, in which evaluation occurred later – 59 DAS, this variable was not influenced by the experimental factors or by their interaction. This indicates that, as the soybean cycle progressed, the leaf/stem ratio tends to equalize at different seeding rates.
Plant mortality rate, oil and protein contents in the grains and soybean yield were not influenced by the experimental factors or their interaction, in both seasons (Tables 1 and 2). This confirms that the increase in P and K dose in soil with high contents of these nutrients, associated with the increase in seeding rate, does not lead to increase in grain yield and protein contents in the grains. Additionally, the results prove that, at low seeding rates, the increment in P and K doses, in soil with high contents of these nutrients, does not enhance plant growth or the compensating effect of lower number of plants per area by the higher grain production per plant. Figure 3 presents the absence of response of grain yield to the wide variation in seeding rate, in both seasons.
Recent studies also found no interaction between seeding rate and mineral N fertilization on the vegetative growth (Werner et al., 2016) and production performance (Ferreira et al., 2016) of a soybean cultivar with indeterminate growth habit. Duarte et al. (2016), studying different spacings between rows, also found no interaction between plant spatial arrangement and doses of potassium and phosphate fertilization for the cultivar ‘Anta 82’. These results demonstrate that the cultivars currently used still exhibit high phenotypic plasticity against modifications in seeding rate, as observed by Balbinot Júnior et al. (2015a), and indicate that, even with high availability of nutrients in the soil, there are few alterations in their absorption, considering that changes in yield hardly occur. It is important to point out that the high phenotypic plasticity of the soybean cultivars currently used can be an interesting tool to reduce costs with seeding, allowing the adoption of lower seeding rates, without reduction in yield (Board & Kahlon, 2013).
However, it is worth highlighting that the densities tested in the present study were all above the optimal minimum density (density needed for optimal yield), which resulted in maintenance of yield. Optimal minimum density represents the minimum density at which soybean can compensate the
lower number of plants with higher production per plant, obtaining the same yield (Gaspar et al., 2015). Moreover, excessive reduction in plant density may lead to gaps in the stand and higher risk of reduction in yield, due to damages caused by pest-insects and hail, for instance.
First pod height, plant height and stem diameter were influenced by seeding rate in only one season (Figure 2B). First pod height (2014/15) and plant height (2015/16) showed quadratic increase as seeding rate increased. Probably, the low quality of light in the canopy was determinant to the increment in plant height at high densities. For Board (2000), the quality of light sensed by the receptors of plants affects their growth, so that under low quality of light soybean plants tend to exhibit high growth in height, to increment radiation interception, besides producing lower number of branches.
In contrast, stem diameter decreased quadratically in the 2014/15 season as a function of the increase in density. Stem diameter is a variable related to the proneness to lodging (Xiang et al., 2013). Reduction in stem diameter, associated with greater plant height and greater first pod height, as observed at higher densities, may favor plant lodging, which results in losses at harvest. On the other hand, the number of grains per pod was not altered by the treatments in any season. According to Cox & Cherney (2011), the number of grains per pod is more influenced by the genotype than by the production environment.
For the number of pods per plant, there was a quadratic fit in both seasons, with reduction in NPP as density increased, but with lower intensity of reduction at the highest densities (Figure 2C).
As seeding rate increases, there is a reduction in the participation of each plant in the final production (Cox et al., 2010), and the main compensation mechanism of soybean for the reduction in seeding rate is the higher production of branches, which leads to higher number of pods per plant (Tourino et al., 2002).
Thousand-grain weight showed a discrepant behavior between both seasons. In the first one, there was a quadratic fit as a function of the increase in density, whereas in 2015/2016 a linear increase occurred (Figure 2C). In 2014/2015, there was lower rainfall associated with high temperatures, in January, compared with the second season (Figure 1). Such condition may have increased interspecific competition for water at the highest densities, which resulted in lower thousand-grain weight. On the other hand, considering that in the second season there was better rainfall in this period, the increment observed in thousand-grain weight can be attributed to the lower number of pods per plant competing for photoassimilates, resulting in their higher concentration in the grains (Tourino et al., 2002). Lastly, it is highlighted that, at lower densities, there is higher percentage of grains from the branches (Balbinot Júnior et al., 2015a), which have lower force of demand for photoassimilates, compared with the main stem (Ferreira et al., 2016).
For the apparent harvest index and SPAD index, evaluated in the 2014/15 season, there was a quadratic reduction in response to the increment in seeding rate (Figure 2D). The reduction in harvest index in response to the increasing
Figure 3. Soybean yield (mean of two levels of phosphate and potassium fertilization) in response to seeding rates
3846 3865 3366 3320 4368 3966 3987 4233 0 1.000 2.000 3.000 4.000 5.000
150 300 440 560
Y ie ld (kg h a -1)
Seeding rate (thousand viable seeds ha-1)
2014/15 2015/16
seeding rates demonstrates that there was higher efficiency in the allocation of photoassimilates for grain production and filling when the crop was at low densities. Additionally, since SPAD index is correlated with N and chlorophyll contents in the leaves (Sant’Ana et al., 2010), higher SPAD index obtained at the lowest densities can be one of the main factors responsible for the greater plant growth, which resulted in greater stem diameter, higher number of pods per plant and higher harvest index, causing the effect of compensation.
Again, the absence of interaction or isolated effect of fertilizer doses on these characteristics indicates that the variation of seeding rate in soybean does not influence its K and P absorption/export rates, because the difference in the number of plants per area is compensated by the greater development of each plant. In other words, utilization of high P and K doses in soil with adequate fertility , associated with the increase in soybean seeding rate, is not a technique that allows the increase in crop yield.
Conclusions
1. Increment in phosphorus and potassium dose, in soil with high contents of these nutrients, did not change yield, growth, yield components and contents of protein and oil in soybean grains, regardless of seeding rate.
2. Seeding rate – from 150 to 560 viable seeds ha-1 – did
not change yield and contents of protein and oil in the grains, regardless of the levels of phosphorus and potassium fertilization; however, at low densities, it increased the number of pods per plant, apparent harvest index and SPAD chlorophyll index.
Literature Cited
Balbinot Júnior, A. A.; Procópio, S. O.; Costa, J. M.; Kosinski, C. L.; Panison, F.; Debiasi, H.; Franchini, J. C. Espaçamento reduzido e plantio cruzado associado a diferentes densidades de plantas em soja. Semina Ciências Agrárias, v.36, p.2977-2986, 2015a. https:// doi.org/10.5433/1679-0359.2015v36n5p2977
Balbinot Júnior, A. A.; Procópio, S. O.; Debiasi, H.; Franchini, J. C.; Panison, F. Semeadura cruzada em cultivares de soja com tipo de crescimento determinado. Semina Ciências Agrárias, v.36, p.1215-1226, 2015b. https://doi.org/10.5433/1679-0359.2015v36n3p1215 Board, J. Light interception efficiency and light quality affect
yield compensation of soybean at low plant population. Crop Science, v.40, p.1285-1294, 2000. https://doi.org/10.2135/ cropsci2000.4051285x
Board, J. E.; Kahlon, C. S. Morphological responses to low plant population differ between soybean genotypes. Crop Science, v.53, p.1109-1119, 2013. https://doi.org/10.2135/cropsci2012.04.0255 Bruns, H. A. Planting date, rate and twin-row vs. single-row soybean in the mid-south. Agronomy Journal, v.103, p.1308-1313, 2011. https://doi.org/10.2134/agronj2011.0076
Cox, W. J.; Cherney, J. H. Growth and yield responses of soybean to row spacing and seeding rate. Agronomy Journal, v.103, p.123-128, 2011. https://doi.org/10.2134/agronj2010.0316
Cox, W. J.; Cherney, J. H.; Shields, E. Soybeans compensate at low seeding rate but not at high thinning rates. Agronomy Journal, v.102, p.1238- 1243, 2010. https://doi.org/10.2134/ agronj2010.0047
Duarte, T. C.; Cruz, S. C. S.; Soares, G. F.; Sena Júnior, D. G. de; Machado, C. G. Spatial arrangements and fertilizer doses on soybean yield and its components. Revista Brasileira de Engenharia Agrícola e Ambiental, v.20, p.960-964, 2016. https:// doi.org/10.1590/1807-1929/agriambi.v20n11p960-964
EMBRAPA- Empresa Brasileira de Pesquisa Agropecuária. Tecnologias de produção de soja - Região Central do Brasil 2012 e 2013. Londrina: Embrapa Soja, 2011. 261p.
Ferreira, A. S.; Balbinot Júnior, A. A.; Werner, F.; Zucareli, C.; Franchini, J. C.; Debiasi, H. Plant density and mineral nitrogen fertilization influencing yield, yield components and concentration of oil and protein in soybean grains. Bragantia, v.75, p.362-370, 2016. https://doi.org/10.1590/1678-4499.479 Gaspar, A. P.; Mitchell, P. D.; Conley, S. P. Economic risk and
profitability of soybean fungicide and insecticide seed treatments at reduced seeding rates. Crop Science, v.55, p.924-933, 2015. https://doi.org/10.2135/cropsci2014.02.0114
Gaspar, A. P.; Mueller, D. S.; Wise, K. A.; Chilvers, M. I.; Tenuta, A. U.; Conley, S. P. Response of broad-spectrum and target-specific seed treatments and seeding rate on soybean seed yield, profitability and economic risk. Crop Science, v. 57, p.1-12, 2017. https://doi. org/10.2135/cropsci2016.11.0967
Heil, C. Rapid, multi-component analysis of soybeans by FT-NIR Spectroscopy. Madison: Thermo Fisher Scientific (Application note: 51954). 2010. 3p.
Hirakuri, M. H. Avaliação econômica da produção de soja nos estados do Paraná e Rio Grande do Sul na safra 2016/17. Londrina: Embrapa Soja, 2017. 14p. Circular Técnica, 126
Javier de Luca, M.; Nogueira, M. A.; Hungria, M. Feasibility of lowering soybean planting density without compromising nitrogen fixation and yield. Agronomy Journal, v.106, 2118-2124, 2014. https://doi.org/10.2134/agronj14.0234
Procópio, S. O.; Balbinot Júnior, A. A.; Debiasi, H.; Franchini, J. C.; Panison, F. Plantio cruzado na cultura da soja utilizando uma cultivar de hábito de crescimento indeterminado. Revista de Ciências Agrárias, v.56, p.319-325, 2013. https://doi.org/10.4322/ rca.2013.048
Sant’Ana, E. V. P.; Santos, A. B. dos; Silveira, P. M. da. Adubação nitrogenada na produtividade, leitura SPAD e teor de nitrogênio em folhas de feijoeiro. Pesquisa Agropecuária Tropical, v.40, p.491-496, 2010. https://doi.org/10.1590/S1983-40632010000400012 SCBS - Sociedade Brasileira de Ciência do Solo. Manual de adubação
e calagem para o estado do Paraná. 1.ed. Curitiba: SBCS/NEPAR, 2017. 482p.
Tedesco, M. J.; Gianello, C.; Bissani, C.A.; Bohnen, H.; Volkweiss, S.J. Análise de solo, plantas e outros materiais. 2.ed. Porto Alegre: Departamento de Solos da Universidade Federal do Rio Grande do Sul, 1995. 174p. Boletim Técnico de Solos, 5
Thompson, N. M.; Larson, J. A.; Lambert, D. M.; Roberts, R. K.; Mengistu, A.; Bellaloui, N.; Walker, E. R. Mid-South soybean yield and net return as affected by plant population and row spacing. Agronomy Journal, v.107, p.979-989, 2015. https://doi. org/10.2134/agronj14.0453
Werner, F.; Balbinot Júnior, A. A.; Ferreira, A. S.; Aguiar e Silva, M. A.; Debiasi, H.; Franchini, J. C. Soybean growth affected by seeding rate and mineral nitrogen. Revista Brasileira de Engenharia Agrícola e Ambiental, v.20, p.734-738, 2016. https:// doi.org/10.1590/1807-1929/agriambi.v20n8p734-738