Ciência Rural, v.48, n.1, 2018.
Quantile regression of nonlinear models to describe
different levels of dry matter accumulation in garlic plants
Regressão quantílica de um modelo não linear para descrição de diferentes níveis de acúmulo de matéria seca em plantas de alho Guilherme Alves Puiatti1* Paulo Roberto Cecon2 Moysés Nascimento2
Ana Carolina Campana Nascimento2 Antônio Policarpo Souza Carneiro2
Fabyano Fonseca e Silva3 Mário Puiatti4 Ana Carolina Ribeiro de Oliveira2
ISSNe 1678-4596
Received 05.16.17 Approved 10.18.17 Returned by the author 12.13.17 CR-2017-0322.R1
INTRODUCTION
Garlic (Allium sativum L.) is a vegetable of great importance due to its economical, culinary, nutritional, and medicinal values, presenting varieties with great potential for commerce and for industrialization (TRANI, 2009). Several varieties of garlic exist in Brazil, generated by somatic mutations and
selections of desirable characteristics for its handling in agriculture (SOUZA & MACÊDO, 2009), necessitating studies regarding its culture and development.
Among these, studies that evaluate the growth trajectory of plants are indispensable for accomplishing the appropriate handling of the plant, because they aid in the preparation of techniques for cultivation, crop, conservation and detection of
1Departamento de Estatística, Universidade Federal de Viçosa (UFV), 36570-900, Viçosa, MG, Brasil. E-mail: guilherme@dpi.ufv.br. *Corresponding author.
2Departamento de Estatística, Universidade Federal de Viçosa (UFV), Viçosa, MG, Brasil. 3Departamento de Zootecnia, Universidade Federal de Viçosa (UFV), Viçosa, MG, Brasil. 4Departamento de Fitotecnia, Universidade Federal de Viçosa (UFV), Viçosa, MG, Brasil.
ABSTRACT: Plant growth analyses are important because they generate information on the demand and necessary care for each develop-ment stage of a plant. Nonlinear regression models are appropriate for the description of curves of growth, since they include parameters with practical biological interpretation. However, these models present information in terms of the conditional mean, and they are subject to problems in the adjustment caused by possible outliers or asymmetry in the distribution of the data. Quantile regression can solve these problems, and it allows the estimation of different quantiles, generating more complete and robust results. The objective of this research was to adjust a nonlinear quantile regression model for the study of dry matter accumulation in garlic plants (Allium sativum L.) over time, estimating parameters at three different quantiles and classifying each garlic accession according to its growth rate and asymptotic weight. The nonlinear
regression model fitted was a Logistic model, and 30 garlic accessions were evaluated. These 30 accessions were divided based on the model with the closest quantile estimates; 12 accessions were classified as of lesser interest for planting, 6 were classified as intermediate, and 12 were classified as of greater interest for planting.
Key words: quantile regression, nonlinear regression, dry matter, Allium sativum L.
RESUMO: Análises de crescimento de plantas são importantes, pois geram informações sobre a demanda e os cuidados necessários para cada etapa de seu desenvolvimento. Modelos de regressão não linear são apropriados para descrever curvas de crescimento por apresenta-rem parâmetros com interpretação prática biológica. Entretanto, estes modelos apresentam informações em termos médios, e estão sujeitos a problemas no ajuste proporcionados por possíveis valores extremos ou assimetria na distribuição dos dados. A regressão quantílica pode contornar estes problemas, e ainda permite estimativas de diferentes quantis, gerando resultados mais completos e robustos. Assim, o objetivo deste trabalho foi ajustar um modelo de regressão quantílica não linear para o estudo do acúmulo de matéria seca em plantas de alho (Allium
sativum L.) ao longo do tempo, estimando seus parâmetros em três diferentes quantis e classificando cada acesso de alho de acordo com sua taxa de crescimento e peso assintótico. O modelo de regressão não linear ajustado foi o Logístico, e foram utilizados 30 acessos de alho. Estes foram divididos de acordo com a curva do quantil de estimativas mais próximas, sendo classificados 12 acessos como de baixo interesse para o plantio, 6 de interesse intermediário e 12 como de alto interesse.
Palavras-chave: regressão quantílica, regressão não linear, matéria seca, Allium sativum L.
Ciência Rural, v.48, n.1, 2018. problems in the development of cultures (SOUZA &
MACÊDO, 2009). Nonlinear regression models are appropriate for describing growth curves because their formulations are based on inherent theoretical considerations of the phenomenon under study (MAZUCHELI & ACHCAR, 2002). Nonlinear models have been used in several studies about dry matter accumulation and growth in different plant cultures, like onion (PÔRTO et al., 2007), banana trees (MAIA et al., 2009), cassava (SILVA et al., 2014), and garlic (REIS et al., 2014), which reported that the Logistic model showed better performance.
When studying plant growth curves, there is usually interest in differentiating sub-samples with larger or smaller production levels, when adjusting the model. One alternative to describe the relationship between predictor variables at different levels of the distribution of the response variable, without the need of adjustments in sub-samples, is the use of quantile regression. This method, different from others that use conditional means (E(Y|X)) to obtain the functional relationship among variables, uses conditional quantiles (Q(Y|X)), adjusting the relationship between independent variables and quantiles (percentiles) of the dependent variable. With quantile regression, it is possible to obtain more information, such as in the inferior or superior tails, and it generates more robust models even in the presence of outliers and heterogeneity of errors (KOENKER, 2005; HAO & NAIMAN, 2007).
Some researchers studied curves of plant growth using quantile regression models, such as MUGGEO et al. (2013), who proposed a structure for quantile regression using b-splines to estimate growth curves for Posidonia oceanica seagrass, and SORRELL et al. (2012), who used quantile regression and nonlinear regression to evaluate the growth of three species of plants of humid areas in response to the depth of the water. However, studies regarding nonlinear quantile regression in dry matter accumulation have not been considered in the literature.
The objective of this research was to adjust nonlinear quantile regression models for the study of dry matter accumulation in garlic plants over time, and to classify the garlic accessions based on their growth rate and asymptotic weight.
MATERIALS AND METHODS
The experiment was carried out in an experimental area belonging to the Plant Science Department of the Universidade Federal de Viçosa (UFV), in the Zona da Mata region of Minas Gerais,
Brazil, with geographical coordinates: 20º45’S and 42º51’W, at an altitude of 650m. Thirty garlic accessions were evaluated in the period from March to November.
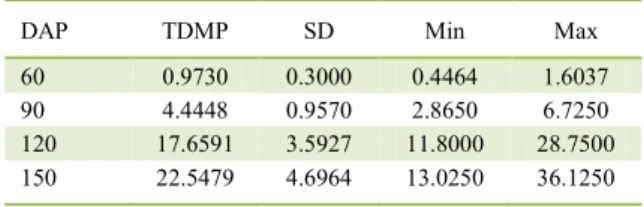
The experimental units consisted of four longitudinal rows of 1m length, with a planting space of 0.25x0.10m, with a total of 40 plants, from which the plants of the two central rows were considered as useful. The total dry matter of the plant (TDMP), expressed in grams by plant, was evaluated in four periods: the initial period (60 days after planting (DAP)), second period (90 DAP), third period (120 DAP), and the final period (150 DAP). Descriptive statistics of the data are presented in table 1.
The nonlinear regression model used was the Logistic model. Averages of each accession were used for the adjustment. The Logistic model is defined as yi = β1 [1+ β2 exp (-β3xi)]-1 + е
i, where: yi
is the ith observation of the response variable, that is,
the total dry matter of the plant (TDMP) expressed in grams and, considered to be the average of the accession in the considered period; xi is the predictor variable, which represents the periods of the dry matter evaluation (in DAP); β1 is the parameter
that represents the asymptotic weight of the accession; β2 a location parameter with no biological
interpretation; and β3 is the maturity rate (growth rate) of the accession. For the random error, the following
distribution is assumed: .
The nonlinear quantile regression model
yi = β1 (τ) [1+ β2 (τ) exp (-β3 (τ) xi)]-1 + e
i (τ) was
adjusted at the quantiles τ = 0.25, τ = 0,5, and τ = 0.75, where τ refers to the assumed quantile (τ ϵ [0,1]). This model was adjusted by an Interior Point Algorithm, proposed by KOENKER & PARK (1996), which has the purpose of computing estimates of quantile regression for cases in which the response function is nonlinear in the parameters. A model with the method of ordinary least squares, using Gauss-Newton’s iterative process, was also adjusted, in order to compare it to the QR model.
Table 1 - Means, standard deviations, and minimum and maximum values of the total dry matter of plant (g) of the 30 garlic accessions measured in the four periods (DAP).
DAP TDMP SD Min Max
60 0.9730 0.3000 0.4464 1.6037
90 4.4448 0.9570 2.8650 6.7250
120 17.6591 3.5927 11.8000 28.7500
Ciência Rural, v.48, n.1, 2018. The likelihood ratio test was applied to the
estimated parameters at the three different quantiles of the quantile regression model (τ = 0.25, τ = 0.5, and τ = 0.75) in order to test whether significant difference exists among these quantiles. For this purpose, a variation of the likelihood ratio test was used (based on the chi-squared distribution), as proposed by KOENKER & MACHADO (1999). This test is based on the L1 regression, which minimizes the absolute value of the sum of the deviations, and differs from the traditional least squares method, in which the square of this sum is minimized. The considered hypotheses were:
not all β1 are equal;
not all β2 are equal;
not all β3 are equal.
Once the models are adjusted, it is desirable to classify the accessions according to their different growth patterns: accessions with different weights and growth rates possess a varied nutritional demand, which makes it more advantageous to distinguish their treatments (SOUZA & MACÊDO, 2009). The distances between the observed values of each accession and the predicted values at each one of the three quantiles of the quantile regression model were calculated. Euclidean distance was used as the dissimilarity measure, calculated as
2 1
( )
= =
∑
p −rs rj sj
j
d y y
, where drs is the distance
between the values predicted by model r and
observed in accession s; yrj is the predicted value of the dry matter of the plant (in grams) for the model r;
ysj represents the observed value of dry matter of the plant (in grams) of accession s; and P is the sample size (number of observations in the accession). The accessions were classified based on growth rate and asymptotic weight according to the curve that presented the smallest distance between predicted and observed values: accessions of lesser interest for planting (τ = 0.25), accessions of intermediate interest (τ = 0.5), and accessions of greater interest for planting (τ = 0.75).
The analyses were implemented in the statistical software R, version 3.2.1 (R DEVELOPMENT CORE TEAM, 2017). For the adjustment of the nonlinear model with the least squares method, the function nls was used. Adjustment of the nonlinear quantile model was accomplished with the function nlrq of the quantreg package (KOENKER, 2016).
RESULTS AND DISCUSSION
Logistic models were adjusted using the methodology of quantile regression at the quantiles τ = 0.25, τ = 0.5 and τ = 0.75, and a model was also adjusted using the ordinary least squares method for comparative ends (Figure 1). All the curves presented a well-defined sigmoid shape, characteristic in growth curves of plants (PÔRTO et al., 2007; MAIA et al., 2009; SILVA et al., 2014; REIS et al., 2014).
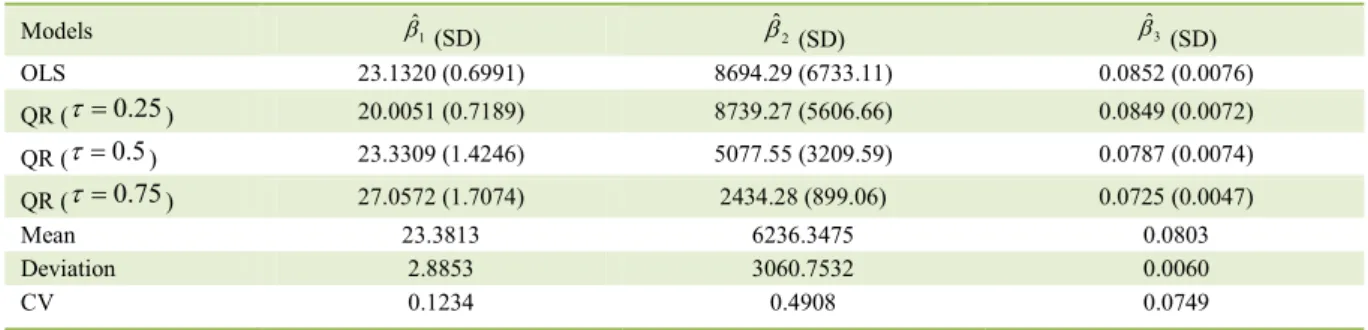
Estimates of the parameters of the adjusted models are shown in table 2, as well as the mean, standard deviation and coefficient of variation for these estimates. The likelihood ratio test allows us to conclude that the estimates of the parameters for the three levels of the quantile regression model differ significantly (P <0.001), indicating that the garlic accessions have a different impact on the dry matter accumulation of the plant.
The estimates for the β1 parameter, which represents the asymptotic weight, were close for the ordinary least square minima (OLS) model and for the median quantile regression one (QR (τ = 0.5)), with masses of 23.1320g and 23.3309g, respectively. The βˆ1 estimate at the quantile τ = 0.75 showed the highest value, representing the accessions with greater dry matter accumulation (27.0572g). The estimated value at the quantile τ = 0.25 shows a smaller asymptotic weight (20.0051g). Accessions that reach a larger dry mass at the final phenological stage are more promising for the planting, being the ones closest to the curve for the τ = 0.75 quantile.
The βˆ2
estimates show a higher variation,
but as this parameter has no practical interpretation, these values do not represent an inconsistency in the adjusted models. As regards the βˆ3 estimates, the quantile τ = 0.25 showed the highest estimate (0.0849), indicating that accessions with a lower final weight reach maturity faster, whereas accessions of median or higher final weight (τ = 0.5 andτ = 0.75) take a longer time to reach the asymptotic value (0.0787 and 0.0725, respectively). The estimate of this parameter from the OLS model (0.0852) was closer to the one obtained by the quantile τ = 0.25 of the QR model. Among the three parameters, β3 had the lowest variation.for planting (τ = 0.75). In practical terms, the total dry matter accumulated represents the productive potential of the plant, and is also a qualitative factor for producing
bulbs of greater market value (DIRIBA-SHIFERAW, 2016). Therefore, accessions with higher weight at the harvest are more economically promising.
Figure 1 - Total dry matter accumulation curves of garlic plants adjusted to the 30 accessions.
Table 2 - Parameter estimates βˆ1, βˆ2 and βˆ3, followed by standard deviation (SD), mean, deviation and coefficient of variation of the
estimated parameters.
---Parameters---
Models βˆ1 (SD) βˆ2 (SD) βˆ3 (SD)
OLS 23.1320 (0.6991) 8694.29 (6733.11) 0.0852 (0.0076)
QR (τ =0.25) 20.0051 (0.7189) 8739.27 (5606.66) 0.0849 (0.0072)
QR (τ=0.5) 23.3309 (1.4246) 5077.55 (3209.59) 0.0787 (0.0074)
QR (τ =0.75) 27.0572 (1.7074) 2434.28 (899.06) 0.0725 (0.0047)
Mean 23.3813 6236.3475 0.0803
Deviation 2.8853 3060.7532 0.0060
Ciência Rural, v.48, n.1, 2018. The classification of each accession is shown
in table 4. Of the 30 accessions, 12 showed values closer to those estimated at the τ = 0.25 quantile, 6 were closer to the estimates at the τ = 0.5 quantile, and the remaining 12 were closer to the τ = 0.75 quantile. The accessions classified as A (of lesser interest for planting) have lower weights at the final stage than the other accessions, with observations that vary from 13.0250g to 20.7000g.
The accession with the lowest weight is in this group (unidentified (14)). The accessions classified as B (of intermediate interest) have, in general, final weights between the other two classifications, from 20.0000g to 23.7500g. Accessions classified as C (of greater interest for planting) showed the highest values of asymptotic weight and the lowest values of growth rate. The final weights observed in the accessions of this classification
Table 4 - Classification of the 30 garlic accessions according to production level: A (of lesser interest for planting), B (of intermediate interest for planting), and C (of greater interest for planting).
N° Accession Class. N° Accession Class.
1 Barbado de Rio Grande A 16 Unidentified (9) C
2 Branco de Dourados B 17 Sapé (2) C
3 Montes Claros C 18 Unidentified (10) C
4 Sacaia de Guanhães C 19 Unidentified (11) A
5 Patos de Minas C 20 Unidentified (12) B
6 Cateto Roxo (1) C 21 Unidentified (13) A
7 Unidentified (1) A 22 Unidentified (14) A
8 Unidentified (2) B 23 Cultura de tecidos C
9 Unidentified (3) C 24 Amarante A
10 Unidentified (4) B 25 Caturra A
11 Unidentified (5) C 26 Cateto Roxo (2) C
12 Unidentified (6) A 27 Amarante Novo Cruzeiro A
13 Unidentified (7) A 28 Cateto Roxão A
14 Unidentified (8) C 29 Chinês – 1 B
15 Sapé (1) A 30 Chinês – 3 B
Table 3 - Euclidean distance between observed and predicted values of each accession at the three quantiles of the nonlinear quantile regression model.
Accession ---Quantile--- Accession ---Quantile---
τ= 0.25 τ= 0.5 τ= 0.75 τ= 0.25 τ= 0.5 τ= 0.75
1 0.1948 3.4757 8.0140 16 11.6559 8.4215 5.3862
2 4.5794 1.5676 4.1193 17 7.7016 4.3567 1.7319
3 7.3814 4.0787 1.7136 18 6.0881 3.2317 2.9424
4 11.8375 8.4373 4.1483 19 3.3912 5.7568 10.1586
5 21.7391 18.3983 13.9788 20 2.0914 1.8220 6.2217
6 11.8081 8.8136 5.2493 21 2.3492 5.6329 10.1570
7 1.9261 4.5881 8.7603 22 6.7786 10.1103 14.4170
8 2.7858 2.7378 6.3400 23 7.1110 4.9067 4.5826
9 10.0389 6.6763 2.5681 24 1.4718 4.6810 9.0747
10 4.2713 0.9383 3.6931 25 1.4514 4.0328 8.5464
11 6.1041 3.1517 2.8669 26 8.3523 5.0403 1.4490
12 0.9330 3.9746 8.4087 27 3.3446 6.6795 11.1190
13 0.9832 3.4485 7.8404 28 2.0965 2.4819 6.5687
14 8.2210 5.3319 2.5678 29 4.3203 2.2406 4.5070
are between 22.4750g and 36.1250g. The accession with the highest weight is in this group (Patos de Minas). The groups formed are consistent with those in the work of REIS et al. (2014), who adjusted nonlinear regression models to describe the dry matter accumulation in clusters of garlic provided from the same experiment.
CONCLUSION
It was possible to adjust a nonlinear quantile regression model to distinguish garlic accessions based on different levels of dry matter accumulation over time.
The 30 garlic accessions were grouped according to the quantile of closest estimates. Twelve were classified as of lesser interest for planting (lower value of asymptotic weight, but higher growth rate); six were classified as intermediate; and 12 were classified as of greater interest for planting, possessing a lower growth rate and higher asymptotic weight.
ACKNOWLEDGMENTS
We thank Fundação de Amparo à Pesquisa do Estado de Minas Gerais (FAPEMIG), Coordenação de Aperfeiçoamento de Pessoal de Nível Superior (CAPES) and Conselho Nacional
de Desenvolvimento Científico e Tecnológico (CNPq) for the financial support for this research.
REFERENCES
DIRIBA-SHIFERAW, G. Review of Management Strategies of Constraints in Garlic (Allium sativum L.) Production. Journal of Agricultural Sciences. 11(3), pp.186–207. 2016. Available from:
<http://doi.org/10.4038/jas.v11i3.8172>. Accessed: Aug. 21, 2017.
doi: 10.4038/jas.v11i3.8172.
HAO, L.; NAIMAN, D.Q. Quantile Regression. Sage publications.2007. 126p.
KOENKER R. quantreg: Quantile Regression. R package version
5.21, 2016. Available from: <https://cran.r-project.org/web/packages/ quantreg/index.html>. Accessed: May 11, 2017.
KOENKER, R. Quantile Regression. Cambridge University Press, 2005. v. 1, 349p.
KOENKER, R.; MACHADO, J.A.F. Goodness of Fit and Related Inference Processes for Quantile Regression. Journal of the American Statistical Association, v. 94, n. 448, p.1296-1310, 1999. Available from:
<http://dx.doi.org/10.1080/01621459.1999.10473882>. Accessed: May
10, 2017. doi: 10.1080/01621459.1999.10473882.
KOENKER, R.; PARK, B.J. An interior point algorithm for nonlinear quantile regression. Journal of Econometrics, 71,
265-283. 1996. Available from: <http://dx.doi.org/4076(96)84507-6>. Accessed: May 8, 2017. doi:
10.1016/0304-4076(96)84507-6.
MAIA, E. et al. Method of comparison of models non-linear regression in bananas trees Ciência Rural, v.39, n.5,
p.1380-1386, 2009. Available from: <http://dx.doi.org/10.1590/S0103-84782009000500012>. Accessed: May 3, 2017. doi: 10.1590/
S0103-84782009000500012.
MAZUCHELI, J.; ACHCAR, J.A. Considerations about nonlinear regression. Acta Scientiarum, Maringá, v.24, n.6, p.1761-1770,
2002. Available from: <http://www.periodicos.uem.br/ojs/index.php/ ActaSciTechnol/article/download/2551/1574>. Accessed: May 9, 2017.
MUGGEO, V.M.R. et al. Estimating growth charts via nonparametric quantile regression: a practical framework with application in ecology.
Environmental and Ecological Statistics, v. 20, n. 4, p. 519-531.
2013. Available from: <https://doi.org/10.1007/s10651-012-0232-1>.
Accessed: May 9, 2017. doi: 10.1007/s10651-012-0232-1.
PÔRTO, D.R. de Q. et al. Evaluating macronutrients accumulated in onion plants of the ‘Superex’ cultivar in direct seeding system.
Ciência Rural, v.37, p.949-955, 2007. Available from: <http:// dx.doi.org/10.1590/S0103-84782007000400005>. Accessed: May
11, 2017. doi: 10.1590/S0103-84782007000400005.
R DEVELOPMENT CORE TEAM. R: A language and environment for statistical computing. R Foundation for Statistical Computing, Vienna, Austria. ISBN 3-900051-07-0. 2017. Available
from: <http://www.R-project.org>. Accessed: Mar. 6, 2017.
REIS, R.M. et al. Nonlinear regression models applied to clusters of garlic accessions. Hortic. Bras., Vitoria da Conquista, v. 32, n. 2, p. 178-183, 2014. Available from: <http://dx.doi.org/10.1590/
S0102-05362014000200010>. Accessed: May 6, 2017. doi:
10.1590/S0102-05362014000200010.
SILVA, H.R.F. et al. Dry matter and micronutrients accumulation in cassava intercropped with banana tree. Pesq. Agropec. Trop., Goiânia, v. 44, n. 1, p. 15-23. 2014. Available from: <http://dx.doi. org/10.1590/S1983-40632014000100008>. Accessed: Apr. 23,
2017. doi: 10.1590/S1983-40632014000100008.
SORRELL, B.K. et al. Regression analysis of growth responses to water depth in three wetland plant species. AoB PLANTS. 2012.
Available from: <http://dx.doi.org/10.1093/aobpla/pls043>. Accessed: May 4, 2017. doi: 10.1093/aobpla/pls043.
SOUZA, R.J. de; MACÊDO, F.S. Cultura do alho: tecnologias modernas de produção. Lavras: Editora UFLA, 2009. 181p. TRANI, P.E. Cultura do alho (Allium sativum): Diagnóstico e recomendações para seu cultivo no Estado de São Paulo. 2009.