ABSTRACT
RESUMO
Submitted on 3/05/2012 and approved on 11/19/2014.
1 Universidade Federal de Viçosa, Departamento de Estatística, Viçosa, Minas Gerais, Brasil. moysesnascim@ufv.br
2 Universidade Federal do Espírito Santo, Centro de Ciências Agrárias, Alegre, Espírito Santo, Brasil. adesioferreira@gmail.com 3 Universidade Federal de Viçosa, Departamento de Estatística, Viçosa, Minas Gerais, Brasil. ana.campana@ufv.br
4 Universidade Federal de Viçosa, Departamento de Estatística, Viçosa, Minas Gerais, Brasil. fabyano.fonseca@ufv.br 5 Embrapa Pecuária Sudeste, São Carlos, São Paulo, Brasil. reinaldo@cppse.embrapa.br
6 Universidade Federal de Viçosa, Departamento de Biologia Geral, Viçosa, Minas Gerais, Brasil. cdcruz@ufv.br *Corresponding author: moysesnascim@ufv.br
Multiple centroid method to evaluate the adaptability
of alfalfa genotypes
This study aimed to evaluate the efficiency of multiple centroids to study the adaptability of alfalfa genotypes (Medicago sativa L.). In this method, the genotypes are compared with ideotypes defined by the bissegmented
regression model, according to the researcher’s interest. Thus, genotype classification is carried out as determined by the objective of the researcher and the proposed recommendation strategy. Despite the great potential of the method, it needs to be evaluated under the biological context (with real data). In this context, we used data on the evaluation of dry matter production of 92 alfalfa cultivars, with 20 cuttings, from an experiment in randomized blocks with two repetitions carried out from November 2004 to June 2006. The multiple centroid method proved efficient for classifying alfalfa genotypes. Moreover, it showed no unambiguous indications and provided that ideotypes were defined according to the researcher’s interest, facilitating data interpretation.
Key words: principal components, genotype x environment interaction, Medicago sativa L.
Moysés Nascimento*1, Adésio Ferreira2, Ana Carolina Campana Nascimento3, Fabyano Fonseca e Silva4,
Reinaldo de Paula Ferreira5, Cosme Damião Cruz6
http://dx.doi.org/10.1590/0034-737X201562010004
Metodologia dos centroides múltiplos para avaliação da adaptabilidade
em genótipos de alfafa
Este trabalho teve como objetivo avaliar a eficiência do método dos centroides múltiplos em um estudo de adaptabilidade de genótipos de alfafa (Medicago sativa L.). Neste método os genótipos são comparados a ideótipos
definidos de acordo com o interesse do pesquisador por meio do modelo de regressão bissegmentada. Desta forma a classificação dos genótipos é realizada conforme objetivo do pesquisador e a estratégia de recomendação desejada. Apesar do grande potencial do método há a necessidade que o mesmo seja avaliado sob o aspecto biológico (com dados reais). Assim, diante deste contexto foram utilizados dados provenientes de um experimento em blocos casualizados com 2 repetições, que constituiu-se da avaliação da produção de
matéria seca de 92 cultivares de alfafa em 20 cortes, realizados no período de novembro de 2004 a junho de 2006. A metodologia dos Centroides Múltiplos mostrou-se eficiente na classificação de genótipos de alfafa. Além de não apresentar duplicidade de indicações e proporcionar que ideótipos fossem definidos de acordo com o interesse do pesquisador facilitando a interpretação dos dados.
INTRODUCTION
In the presence of genotype by environment interaction, it is necessary to obtain detailed information on the performance of each cultivar across environmental variations (Cruz et al., 2004). Thus, the adaptability and stability analyses become extremely important and necessary in order to identify and recommend superior genotypes for different environments.
A number of methods of adaptability and stability analyses are described in the literature, including the Eberhart & Russell (1966) and the Bayesian method proposed by Nascimento et al. (2011) that use the simple regression analysis as statistical principle. Non-parametric methods, such as those developed by Lin & Binns (1988), Nascimento et al. (2010), centroid (Rocha et al., 2005) and its subsequent developments the multiple centroid (Nascimento et al., 2009a) and the extended centroid (Nascimento et al., 2009b) are also reported.
Adaptability and stability analyses have been used to identify genotypes of interest in various crops. Lédo et al. (2005) conducted studies to select alfalfa genotypes with improved adaptability and stability for dry matter production. Mohebodini et al. (2006) used several methods to study in detail the genotype x environment interaction of 11 lentil genotypes (Lens culinaris M.). Pelúzio et al. (2008) evaluated the performance, adaptability and stability of soybean genotypes in four sowing dates, in the municipality of Gurupi, Tocantins. Mahammed & Amri (2008) compared and evaluated the results of 20 parametric and non-parametric methods for selection of Triticum durum genotypes. In addition to these, Barreto et al. (2011) estimated the adaptability and stability of sweet potato genotypes in three environments in the South Central region of the State of Tocantins.
Among the cited methodologies, the multiple centroid method stands out in the literature as having a great potential for genotype recommendation, since the choice of the ideotypes (ideal references) is defined according to the researcher’s interest using the bissegmented regression model. The method provides the researcher with a greater flexibility and genotype classification is carried out as determined by the objective of the researcher and the proposed recommendation strategy. However, despite the great potential of the method, it has not been used on actual data, hence the need to evaluate its applicability in the biological context (with real data).
Thus, this study aimed to evaluate the efficiency of the multiple centroid method in an adaptability study using real data from alfalfa genotypes (Medicago sativa L.).
MATERIAL AND METHODS
The multiple centroid method requires that the environments are classified into favorable and unfavorable using the environmental index proposed by Finlay & Wilkinson (1963):
where: Yij is the average of the genotype i in the environment j; Y.. is the total number of observations; a is the number of environments; and g is the number of genotypes.
After the classification of the environments, the ideal hypothetical cultivar (ideotype), or reference, is defined by the bissegmented regression model with the following parameters: mean β0i and the linear response to unfavorable environments β1i and favorable environments (β1i+ β2i) (Cruz et al., 1989).
Using the model Yij = β0i+ β1i Ιj+ β2iT(Ιj),
where: Yij is the ideal response of the hypothetical genotype in the environment j; β0i is the value provided so that the ideal response is maximum in all sites; Ιj is the environment coded index; T(Ιj) = 0 if Ιj < 0; and T(Ιj) = Ιj - + if Ιj > 0, with the mean of the positive indices .
After establishing the centroids based on the researcher’s interest, the principal component analysis is applied to obtain scores for plotting the graphs. Genotypes are classified by their position on the graphs in relation to the centroids and the Cartesian distances between points (genotypes) and each of the centroids defined by the researcher. As in the centroid method and its subsequent developments, a measure of spatial probability is calculated, which is defined as the inverse of the distance between a treatment and the ideotype defined by the researcher:
where: Pd(i, k) is the probability of showing a pattern of stability similar to the kth centroid; and dik is the distance from the ith genotype to kth centroid.
Brazilian ecosystems. The experiment evaluated the dry matter production of 92 alfalfa genotypes in 20 cuttings in a randomized block design with two replications. The cuttings were considered to be representative of different environmental conditions because they were performed at different times during the period from November 2004 to June 2006.
The ideotypes for the method were defined according to Pereira & Ferreira (2008), considering that when the interest is the genetic improvement, one selects alfalfa genotypes in which a good performance for dry matter production is coupled with a high response to environment improvement and highly predictable behavior. Thus, using the bissegmented regression model, the following references of interest were created: ideotype I - mean higher than the overall mean of the assessed alfalfa genotypes and with general adaptability as ; ideotype II - mean higher than the overall mean and responsive to environmental changes ; and for discard: ideotype III -general adaptability with mean lower than the -general
mean , mathematically:
I.
II.
III.
The results obtained from the multiple centroid method were also compared with the non-parametric methodology by Lin & Binns (1988).
The statistical analyses were carried out using the GENES software (Cruz, 2006) available at http:// www.ufv.br/dbg/genes/gdown.htm.
RESULTS AND DISCUSSION
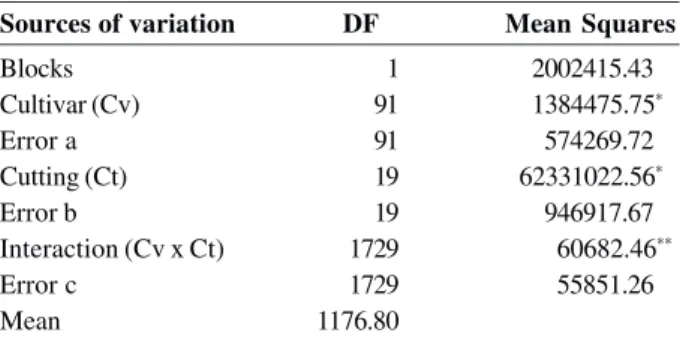
There was significant difference among dry matter production means of the alfalfa cultivars and significant cultivar (Cv) x cutting (Ct) interaction, at 5 and 1% probability levels, respectively (Table 1). The significance of the cultivar x cutting interaction shows that the cultivars had different performances in the various environmental conditions. Therefore, this interaction was studied in more detail using the analyses of adaptability and stability.
The ideotypes based on the work of Pereira & Ferreira (2008) and defined by the bissegmented regression model were characterized as follows:
I Yij = 1.250 + 1Ij; II Yij = 1.300 + 1Ij + 0,5Ij; III Yij = 1.100 + 1Ij.
Ideotype I is a genotype with general adaptability with mean higher than the overall mean, which is of interest for breeding programs with a wide range of environments. Ideotype II is responsive to environment improvement and of great interest for alfalfa breeding (Pereira & Ferreira, 2008). Ideotype III has lower mean than the overall mean and can be discarded.
In the Principal Components Analysis, the cumulative percentage of variance in the first three components explained 75.44% of the variability in the data (Table 2), which, according to Johnson & Wichern (1992) and Melém Júnio. et al. (2008), is sufficient to a satisfactory interpretation of the results.
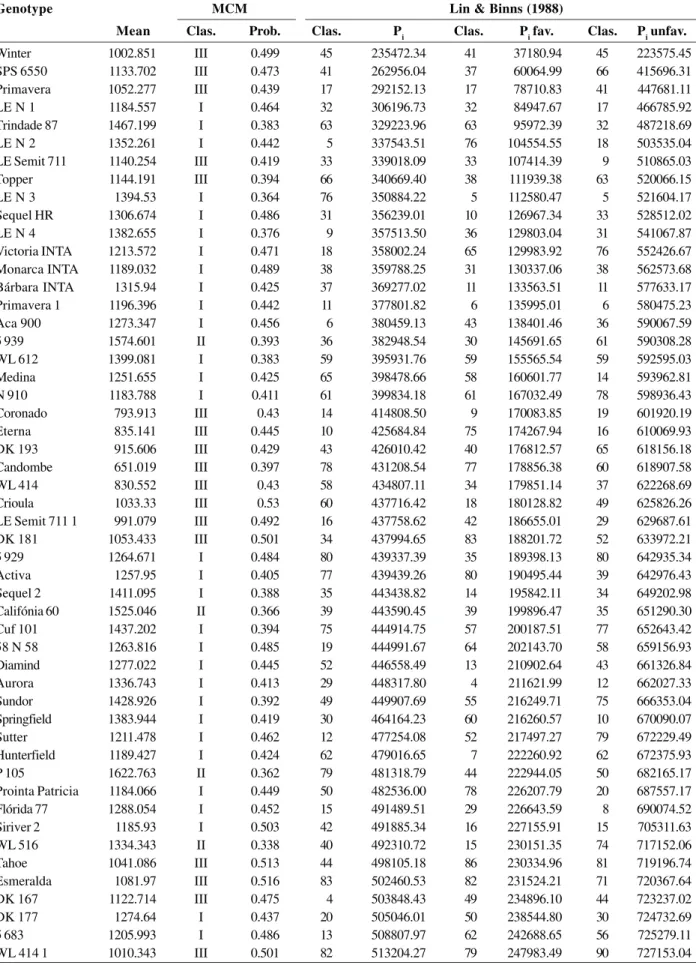
The genotypes were classified according to the multiple centroid method (Table 3). Of the 92 alfalfa
Table 1. Summary of the analysis of variance for the trait dry matter production of 92 alfalfa cultivars in 20 environments (cuttigs), in the municipality of São Carlos / SP, from November 2004 to June 2006
Sources of variation DF Mean Squares
Blocks 1 2002415.43
Cultivar (Cv) 91 1384475.75*
Error a 91 574269.72
Cutting (Ct) 19 62331022.56*
Error b 19 946917.67
Interaction (Cv x Ct) 1729 60682.46**
Error c 1729 55851.26
Mean 1176.80
NS non-significant; * and ** - significant at 5 and 1% probability levels, respectively, by the F test
Table 2. Variance estimates (eigenvalues) of principal components
and cumulative percent of variance explained by the components
Root Root (%) % Accumulated
12.210 61.050 61.050
1.596 7.980 69.030
1.282 6.412 75.443
0.811 4.057 79.500
0.699 3.494 82.994
0.539 2.696 85.690
0.459 2.294 87.985
0.401 2.004 89.989
0.360 1.801 91.790
0.320 1.599 93.389
0.234 1.170 94.560
0.210 1.052 95.612
0.176 0.879 96.491
0.156 0.781 97.271
0.143 0.717 97.989
0.124 0.621 98.610
0.085 0.425 99.036
0.074 0.369 99.404
0.065 0.326 99.731
Table 3. Classification and probability associated with the genotypes in each of the three groups characterized by the ideotypes defined
by Multiple Centroid Method (MCM) and estimates of stability and adaptability by the Lin & Binns (1988) method for the trait dry matter production
Genotype MCM Lin & Binns (1988)
Mean Clas. Prob. Clas. Pi Clas. Pi fav. Clas. Pi unfav.
Winter 1002.851 III 0.499 45 235472.34 41 37180.94 45 223575.45
SPS 6550 1133.702 III 0.473 41 262956.04 37 60064.99 66 415696.31
Primavera 1052.277 III 0.439 17 292152.13 17 78710.83 41 447681.11
LE N 1 1184.557 I 0.464 32 306196.73 32 84947.67 17 466785.92
Trindade 87 1467.199 I 0.383 63 329223.96 63 95972.39 32 487218.69
LE N 2 1352.261 I 0.442 5 337543.51 76 104554.55 18 503535.04
LE Semit 711 1140.254 III 0.419 33 339018.09 33 107414.39 9 510865.03
Topper 1144.191 III 0.394 66 340669.40 38 111939.38 63 520066.15
LE N 3 1394.53 I 0.364 76 350884.22 5 112580.47 5 521604.17
Sequel HR 1306.674 I 0.486 31 356239.01 10 126967.34 33 528512.02
LE N 4 1382.655 I 0.376 9 357513.50 36 129803.04 31 541067.87
Victoria INTA 1213.572 I 0.471 18 358002.24 65 129983.92 76 552426.67
Monarca INTA 1189.032 I 0.489 38 359788.25 31 130337.06 38 562573.68
Bárbara INTA 1315.94 I 0.425 37 369277.02 11 133563.51 11 577633.17
Primavera 1 1196.396 I 0.442 11 377801.82 6 135995.01 6 580475.23
Aca 900 1273.347 I 0.456 6 380459.13 43 138401.46 36 590067.59
5 939 1574.601 II 0.393 36 382948.54 30 145691.65 61 590308.28
WL 612 1399.081 I 0.383 59 395931.76 59 155565.54 59 592595.03
Medina 1251.655 I 0.425 65 398478.66 58 160601.77 14 593962.81
N 910 1183.788 I 0.411 61 399834.18 61 167032.49 78 598936.43
Coronado 793.913 III 0.43 14 414808.50 9 170083.85 19 601920.19
Eterna 835.141 III 0.445 10 425684.84 75 174267.94 16 610069.93
DK 193 915.606 III 0.429 43 426010.42 40 176812.57 65 618156.18
Candombe 651.019 III 0.397 78 431208.54 77 178856.38 60 618907.58
WL 414 830.552 III 0.43 58 434807.11 34 179851.14 37 622268.69
Crioula 1033.33 III 0.53 60 437716.42 18 180128.82 49 625826.26
LE Semit 711 1 991.079 III 0.492 16 437758.62 42 186655.01 29 629687.61
DK 181 1053.433 III 0.501 34 437994.65 83 188201.72 52 633972.21
5 929 1264.671 I 0.484 80 439337.39 35 189398.13 80 642935.34
Activa 1257.95 I 0.405 77 439439.26 80 190495.44 39 642976.43
Sequel 2 1411.095 I 0.388 35 443438.82 14 195842.11 34 649202.98
Califónia 60 1525.046 II 0.366 39 443590.45 39 199896.47 35 651290.30
Cuf 101 1437.202 I 0.394 75 444914.75 57 200187.51 77 652643.42
58 N 58 1263.816 I 0.485 19 444991.67 64 202143.70 58 659156.93
Diamind 1277.022 I 0.445 52 446558.49 13 210902.64 43 661326.84
Aurora 1336.743 I 0.413 29 448317.80 4 211621.99 12 662027.33
Sundor 1428.926 I 0.392 49 449907.69 55 216249.71 75 666353.04
Springfield 1383.944 I 0.419 30 464164.23 60 216260.57 10 670090.07
Sutter 1211.478 I 0.462 12 477254.08 52 217497.27 79 672229.49
Hunterfield 1189.427 I 0.424 62 479016.65 7 222260.92 62 672375.93
P 105 1622.763 II 0.362 79 481318.79 44 222944.05 50 682165.17
Prointa Patricia 1184.066 I 0.449 50 482536.00 78 226207.79 20 687557.17
Flórida 77 1288.054 I 0.452 15 491489.51 29 226643.59 8 690074.52
Siriver 2 1185.93 I 0.503 42 491885.34 16 227155.91 15 705311.63
WL 516 1334.343 II 0.338 40 492310.72 15 230151.35 74 717152.06
Tahoe 1041.086 III 0.513 44 498105.18 86 230334.96 81 719196.74
Esmeralda 1081.97 III 0.516 83 502460.53 82 231524.21 71 720367.64
DK 167 1122.714 III 0.475 4 503848.43 49 234896.10 44 723237.02
DK 177 1274.64 I 0.437 20 505046.01 50 238544.80 30 724732.69
5 683 1205.993 I 0.486 13 508807.97 62 242688.65 56 725279.11
WL 414 1 1010.343 III 0.501 82 513204.27 79 247983.49 90 727153.04
Genotype MCM Lin & Binns (1988)
Mean Clas. Prob. Clas. Pi Clas. Pi fav. Clas. Pi unfav.
Express 1267.468 I 0.459 57 515157.44 66 248969.83 42 741619.25
F 708 1108.731 III 0.505 56 519602.71 45 250012.98 54 741980.19
Perla INTA 1129.403 III 0.495 90 520874.07 48 250084.75 4 742942.78
Prointa Lujan 1088.188 III 0.456 81 531261.57 12 251420.10 82 743669.78
DK 166 1150.3 I 0.413 54 535170.87 19 253190.14 40 750445.57
Platino 1179.549 I 0.44 2 547132.91 2 263962.50 13 752548.70
Maxidor 1274.525 I 0.475 71 549586.81 56 268220.46 87 752835.68
Amerigraze701 1355.009 I 0.424 86 554039.38 90 268755.32 88 757295.23
13 R Supreme 1270.49 I 0.486 8 554619.87 46 272116.87 83 759581.37
Pecos 1322.879 I 0.463 53 560568.51 53 274909.98 57 772860.10
Califórnia 50 1211.353 I 0.48 48 566289.10 20 281976.82 84 777777.82
Maricopa 1459.601 I 0.375 64 571848.02 54 282403.92 2 778817.79
Kern 1120.366 III 0.416 7 581177.86 28 295297.47 73 783982.29
Costera INTA 1357.178 I 0.422 84 582795.17 81 301563.02 3 791458.63
F 686 1271.352 I 0.395 55 584800.90 1 307733.23 53 794289.13
Monarca 1034.199 III 0.535 74 587982.62 47 319583.61 67 811667.00
Patrícia 971.805 III 0.486 47 598152.14 26 328898.10 86 818888.46
Tango 804.511 III 0.439 88 601359.98 51 333057.38 48 825001.75
Bárbara 872.003 III 0.437 73 605967.74 71 340854.69 47 826071.85
Rio Grande 1116.735 III 0.439 67 607833.35 84 344483.05 27 848775.18
Key II 904.77 III 0.436 28 611185.60 67 358703.35 89 854982.88
Gala 1041.232 III 0.519 46 621245.02 68 378522.17 85 867773.36
Lujan 1131.267 III 0.389 26 627654.51 73 388394.41 28 869639.53
Perla 1252.125 I 0.482 51 635286.40 8 389064.19 26 872091.56
5683 L 1404.397 I 0.397 87 636339.60 72 405143.81 64 874333.38
Victoria 1283.158 I 0.436 3 636876.92 88 410772.45 7 874837.17
DK 194 1300.291 I 0.426 1 657604.37 74 430108.85 51 882564.69
WL 442 1194.413 I 0.49 27 669589.00 3 447943.73 55 886342.78
P 30 1259.664 I 0.501 85 681077.22 91 447965.36 46 906895.33
P 5715 1141.713 III 0.447 68 686745.10 27 450583.67 91 915265.24
Alfa 200 1165.585 I 0.465 91 704980.30 85 452893.05 68 938927.49
Aca 901 1200.671 I 0.417 89 715246.96 87 493955.50 1 943862.57
Gapp 969 1093.061 III 0.512 72 761389.50 23 529952.30 25 957100.39
Rocio 974.527 III 0.485 23 776073.87 89 544458.62 70 970024.80
GT 13 R Plus 1143.141 III 0.433 70 792140.75 22 566244.10 23 977446.06
WL 525 1013.744 III 0.468 25 818314.66 70 574726.91 21 1028229.01
Sequel 1056.443 III 0.491 22 823283.57 92 619670.22 22 1033588.58
DK 187 R 934.305 III 0.426 69 857406.25 69 630696.17 69 1042896.33
Pinto 1148.741 III 0.427 21 868788.76 25 648687.66 72 1052863.23
Bacana 939.335 III 0.481 92 969241.67 21 673917.34 24 1109434.51
Siriver 718.896 III 0.418 24 1059743.34 24 999009.68 92 1255254.68
genotypes, 49 were classified as having high general adaptability with means higher than the overall mean of the experiment (ideotype I), four were classified as specific for favorable environments (ideotype II) and 39 as having general adaptability with means lower than the overall mean (ideotype III) (Table 3).
Among the 49 genotypes classified as ideotype I, ten showed greater probabilities, including Siriver 2 (0.503); P 30 (0.501); WL 442 (0.490); Monarca INTA (0.489); 5 683 (0.486); Sequel HR (0.486); 13 R Supreme
(0.486); 58 N 58 (0.485); 5 929 (0.484); and Perla (0.485). These genotypes can be recommended to sites with large environmental variability. The genotypes classified as ideotype II of great interest for alfalfa breeding programs were: 5939 (0.393); Califonia 60 (0.366); P 105 (0.362); and WL 516 (0.338).
Among the 39 genotypes classified as ideotype III, which can be discarded, the ten with the largest probabilities were: Monarca (0.535); Crioula (0.530); Gala (0.520); Esmeralda (0.516); Tahoe (0.513); Gapp
969 (0.512); F 708 (0.505); DK 181 (0.501); WL 414 1 (0.501); and Winter (0.501).
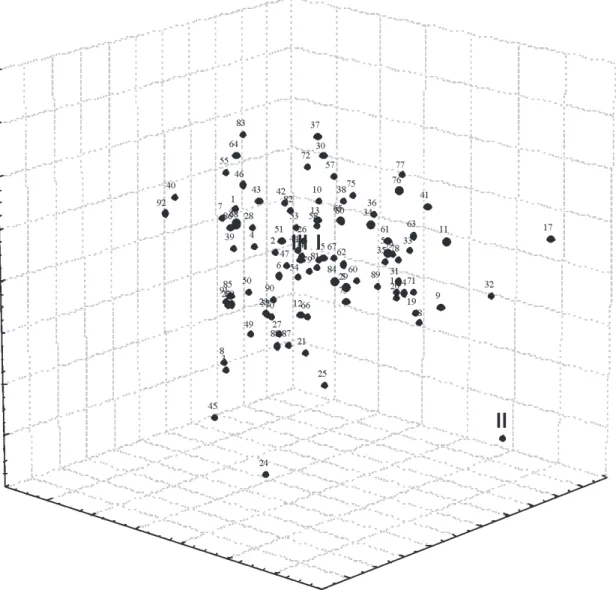
The first three principal components scatterplot of the 92 genotypes in twenty environments (cuttings) showed a mass of genotypes around the ideotypes I and III, which confirms the results presented (Figure 1).
The genotypes were also analyzed by the method of Lin & Binns (1988) (Table 3). The results showed that the first five genotypes classified as of general adaptability were: WL 516; P 105; 5939; California 60; and Maricopa. The first five genotypes classified as adaptable to favorable environment were: P 107; Sundor. 5 939; California 60; and Maricopa. The genotypes WL 516, F 686, P 105, 5 939 and Maricopa were the first five classified as adaptable to unfavorable environments.
The four genotypes classified as adaptable to favorable environments by the multiple centroid method
were also classified as of general adaptability by the method of Lin & Binns (1988). Besides, of these four genotypes, two, 5 939 and California 60, were also classified as of specific adaptability to favorable environments. Among those that can be discarded, which were classified as ideotype III by the multiple centroids and of specific adaptability to unfavorable environments by Lin & Binns (1988), none showed equivalent classification.
The results of this study corroborate the work of Nascimento et al. (2009a) and demonstrate the ease of analysis and interpretation of adaptability by the multiple centroid method compared to the method of Lin & Binns (1988). This easiness is due to the non-occurrence of possible ambiguous indications in the multiple centroid method, as it happens in the Lin & Binns (1988) method, as well as the direct comparison with the ideotype of interest.
Figure 1. Scatterplot of the first three principal components of 92 genotypes for the response of dry matter production to twenty
CONCLUSIONS
The multiple centroid method was efficient to classify alfalfa genotypes without showing ambiguous information as it occurs with the Lin & Binns (1988) method. Furthermore, the definition of ideotypes according to the researcher’s interest facilitated data interpretation.
REFERENCES
Barreto HG, Santos LB dos, Oliveira GÍS de, Santos GR do, Fidelis RRF, Silveira MA da & Nascimento IR do (2011) Estabilidade e adaptabili-dade da produtiviadaptabili-dade e da reação a insetos de solo em genótipos experimentais e comerciais de batata-doce. Bioscience Journal,
27:739-747.
Cruz CD (2006) Programa Genes - Biometria. 1ª ed. Viçosa, Editora UFV 382 p.
Cruz CD, Torres RA & Vencovsky R (1989) An alternative approach to the stability analysis proposed by Silva and Barreto.Revista Brasi-leira de Genética,12:567-80.
Cruz CD, Regazzi AJ & Carneiro PC (2004) Modelos biométricos aplica-dos ao melhoramento genético. 3ª ed. Viçosa, Editora UFV. 480p. Eberhart SA & Russell WA (1966) Stability parameters for comparing
varieties. Crop Science, 6:36-40.
Finlay KW & Wilkinson GN (1963) The analysis of adaptation in a plant-breeding programme. Australian Journal of Agricultural Research,14:742-754.
Johnson RA & Wichern DW (1999) Applied multivariate statistical analysis. 4ª ed. New Jersey, Prentice-Hall. 815p.
Lédo FJ da S, Botrel M de A, Evangelista AR, Viana MCM, Pereira AV, Souza Sobrinho F de, Oliveira JS e, Xavier DF & Heinemann AB (2005) Adaptabilidade e estabilidade de cultivares de alfafa avalia-das em Minas Gerais. Ciência e Agrotecnologia, 29:409-414. Lin CS & Binns MR (1988) A superiority measure of cultivar
performance for cultivar x location data. Canadian Journal of Plant Science,68:193-198.
Mahammadi R & Amri A (2007) Comparison of parametric and non-parametric methods for selecting stable and adapted durum wheat genotypes in variable environments. Euphytica,159:419-432.
Melém Júnior NJ, Fonseca IC de B, Brito OR, Decaëns T, Carneiro MM, Matos M de FA de, Guedes MC, Queiroz JAL de & Barroso K de O (2008) Análise de componentes principais para avaliação de resulta-dos analíticos da fertilidade de solos do Amapá. Semina. Ciências Agrárias, 29:499 506.
Mohebodini M, Dehghani H & Sabaghpour SH (2006) Stability of performance in lentil (Lens culinaris Medik) genotypes in Iran.
Euphytica, 149:343-352.
Nascimento M, Ferreira A, Campana ACM, Salgado CC & Cruz CD (2009a) Multiple centroid methodology to analyze genotype adaptability. Crop Breeding and Applied Biotechnology, 9:08-16. Nascimento M, Cruz CD, Campana ACM, Tomaz RS, Salgado CC, Ferreira
R de P (2009b) Alteração no método centroide de avaliação da adap-tabilidade genotípica. Pesquisa Agropecuária Brasileira, 44:263-269. Nascimento M, Ferreira A, Ferrão RG, Campana ACM, Bhering LL, Cruz CD, Ferrão MAG & Fonseca AFA da (2010) Adaptabilidade e estabi-lidade via regressão não paramétrica em genótipos de café.Pesquisa Agropecuária Brasileira, 45:45-48.
Nascimento M, Silva FF, Sáfadi T, Nascimento ACC, Ferreira RP & Cruz CD (2011) Abordagem bayesiana para avaliação da adaptabilidade e estabilidade de genótipos de alfafa. Pesquisa agropecuária brasilei-ra, 46:26-32.
Pelúzio JM, Fidelis RR, Giongo P, Silva JC da, Cappelari D & Barros HB (2008) Adaptabilidade e estabilidade de cultivares de soja em quatro épocas de semeadura no sul do Estado do Tocantins. Revista Ceres, 55:034-040.
Pereira AV & Ferreira RP (2008) Cultivares de alfafa. In: Ferreira RP, Rassini JB, Rodrigues AA, Freitas AR, Camargo AC & Mendonça FC (Eds.). Cultivo e utilização da alfafa nos trópicos. São Carlos, Embrapa Pecuária Sudeste. p.193-214.