This research aimed to determine the influence of fluoridated groundwater and 1,100 ppm fluoride dentifrice on biomarkers of exposure to fluoride in preschoolers. A cross-sectional study was performed on thirty preschoolers recruited from naturally fluoridated and non-fluoridated areas (n=15). Total Daily Fluoride Intake (TDFI) from diet and dentifrice, and Daily Urinary Fluoride Excretion (DUFE) was measured over 24 h. Nails samples were collected twice during 30 days. Fluoride analyses were performed using a fluoride-ion-specific electrode. Data were evaluated using the Student and paired t-test, Pearson correlation analysis, multiple linear regression analysis (α≤0.05). Fluoridated groundwater and dentifrice were the dominant sources (r2 > 0.83) of TDFI in children from a naturally
fluoridated and a non-fluoridated area, respectively. A positive correlation between TDFI and DUFE (r=0.50), and between [F] in fingernails and toenails (r=0.60) were found in children from a naturally fluoridated area. The [F] in nails of finger and toe were not correlated to TDFI. The consumption of fluoridated groundwater influenced the fluoride concentration in urine. In addition, the use of 1,100 ppm fluoride dentifrice did not influence the fluoride concentration in urine and fingernails.
Influence of Fluoridated Groundwater
and 1,100 Ppm Fluoride Dentifrice on
Biomarkers of Exposure to Fluoride
Emerson Tavares de Sousa1, Vanessa Feitosa Alves2, Fabiana Barros Marinho Maia2, Marinês Nobre-dos-Santos1, Franklin Delano Soares Forte2, Fábio Correia Sampaio2
1Department of Pediatric Dentistry,
Piracicaba Dental School, UNICAMP – Universidade de Campinas, Piracicaba, SP, Brazil
2Department of Public Health and
Clinic Dentistry, Health Sciences Center, UFPB – Universidade Federal da Paraiba, João Pessoa, PB, Brazil
Correspondence: Prof. Franklin Delano Soares Forte, Cidade Universitária, Castelo Branco III, CEP: 58051-900, João Pessoa, PB, Brazil. Tel.: +55-83-3216-7175. e-mail: franklinufpb@gmail.com
Key Words: Dental fluorosis, Community Dentistry, dentifrice, epidemiology, pediatric dentistry.
Introduction
The prevalence and severity of dental fluorosis are directly associated with fluoride exposition during permanent dentition development (1), which might be related to a Total Daily Fluoride Intake (TDFI) as higher as 0.07 mg/kg/day (2). In children, the mechanism that causes this adverse effect of fluoride ingestion is physiologically complex and comprises behavioral factors that change TDFI and modulate fluoride retention in the human body (3,4). TDFI is usually associated with fluoridated water, diet (foods and beverages), supplements, and fluoridated dentifrices (5,6). However, the risk behavior for dental fluorosis is mainly related to fluoridated water (1) and fluoridated dentifrice (7). Previous researches have been performed in preschoolers regarding the intrinsic relationship between TDFI from different sources and the biological retention of fluoride in preschoolers (3,8–10). These studies found that TDFI is largely versatile considering the children’s behavior and that the source of fluoride possibly promotes differences in the pattern of fluoride metabolism and toxicity at the community level.
The assessment of dental fluorosis risk is important to understand the complexity of illness and to plan strategies to control the deleterious effects of high ingestion of fluoride. Clinically, the risk measurements of excessive exposure to fluoride during childhood is a challenge for
pediatric dentists because it routinely depends on subjective ingestion reports that provide a limited information and an intuitive practice. Consequently, the interest for methods of monitoring fluoride exposure in biological tissues has grown and can be considered a possible tool for screening and earlier diagnosis of dental fluorosis (5,11). In this context, the effectiveness of biological markers of exposure to fluoride is controversial. This controversy can be explained by the influence of environmental and physiological factors (12). Besides, this question is more critical when the cross-cultural characteristics of diet are added to the behavioral aspects of childhood (13).
E.T
.es de Sousa
Thus, this cross-sectional observational study was carried out to determine the influence of fluoridated groundwater and 1,100 ppm fluoride dentifrice on biomarkers of exposure to fluoride in preschool children.
Material and Methods
The present research follows the STROBE recommendations for strengthening the reporting of cross-sectional studies (19).
All procedures performed in studies involving human participants were in accordance with the ethical standards of the institutional and/or national research committee and with the 1964 Helsinki declaration and its later amendments or comparable ethical standards. The Ethics Committee in Research of Federal University of Paraíba (CAAE 36916614.8.0000.5188) approved this study. The goals and the study entire procedure were thoroughly presented to children and their parents, who agreed with their participation by signing an informed consent.
Study Design
This cross-sectional study was performed between March and June 2015 (autumn) and consisted of two phases.
Phase one: During 24 h, TDFI was assessed from different sources such as water, beverages, solid diet and dentifrices, whereas the DUFE was estimated in urine collected samples. Phase two: During one month, finger- and toenail clippings were collected twice to determine their fluoride concentration.
Sample
The sample was divided according to the fluoride content in community water. Children from the naturally fluoridated area were born and grew up in a small rural village (São João do Rio do Peixe, PB, Brazil; Annual temperature: 26.5 °C), with high levels of fluoride in the water supply. The non-fluoridated area was represented by children who lived in an urban area (João Pessoa, PB, Brazil; Annual temperature: 25.5 °C).
The sample size calculations considered the difference between two independent means (20). The parameters used to perform this procedure were: the sample power of 85%, the level of significance of 5%, the clinical relevant difference of 0.07 mg/kg/day(2) for chronic and toxic fluoride ingestion, and the standard deviant of 0.054 for infants who lived in a fluoridated area (21). The initial sample size was 12 preschoolers per group. The calculated number (12) was increased to 15 to compensate for eventual subject dropout, totalizing a minimum of 15 children per group (non-fluoridated area and fluoridated area). Thus, a sample of thirty children (21 boys and 9 girls) were included in the present study.
Children were recruited of primary schools from each area. The inclusion criteria considered toilet-trained preschoolers (age range: 24-72 months), who had good historical of staying dry at night, and who routinely used 1,100 ppm fluoride dentifrice (assessed during an interview by the question “In the last months, what kind of toothbrush did you use to brush your children’s teeth?”, and by the exhibition of the dentifrice packing). In addition, children should have a good systemic and oral health status, not taking any medications or fluoridated supplements, and their parents had to demonstrate cooperation with the study protocol.
Clinical Data Collection
At the beginning, children were weighed and their parents were interviewed regarding their children’s oral care habits (how many times a day do they brush their teeth? and who perform/supervise their toothbrushing?). TDFI was estimated as precisely as possible according to the water, beverages or solid diet using the duplicate plate technique (22). The importance of maintaining the usual dietary habits to reproduce faithfully the fluoride exposure was emphasized. Oral and written instructions about the collection method were provided to parents and their children. Parents were instructed to collect the dietary contents in three containers during a period of 24 hours, each one corresponding to beverages, water alone and solid food. Subsequently, the dietary contents were weighed in electronic kitchen scale (Brinox 2923/101, Caxias do Sul, RS, Brazil), homogenized in a kitchen blender, and one aliquot of 10 mL was separated for fluoride analysis.
Fluoride intak
e and biomark
ers of exposure to fluoride
Soluble Fluoride - TSF x Dentifrice weight). This value was multiplied by the daily frequency of toothbrushing providing an estimative of 24 h. This measure considered the extrapolation of one episode of toothbrushing for all daily events, based on children’s usual oral hygiene habits (22).
Daily Urinary Fluoride Excretion (DUFE) was assessed in children’s urine according to the World Health Organization concomitantly with TDFI. Urine samples were collected in two-liter plastic bottles every time the child needed to urinate. The total urine volume was measured with a graduated cylinder and one sample of 10 mL was stored in a refrigerator until fluoride analysis. If the urinary flow rate was lower than 9 ml/h the collection was repeated. Before fluoride analyses, the urine volumes were normalized for all children.
TDFI and DUFE were calculated considering the child body weight and were expressed in mg F/kg bw/day. The Fractional Urinary Fluoride Excretion (FUFE) represented the quotient of DUFE and TDFI and was expressed as a percentage. TDFR was the result of subtracting the DUFE from the TDFI.
Fingernails and toenails clippings were collected from each child and stored at ambient temperature until processing. Before the collection, volunteers were instructed to avoid cut their nails and does not use nails varnish for at least two weeks (23). The nails samples collected were cleaned using an interdental brush (Cylindrical, Bitufo; Itupeva, SP, Brazil) and sonicated using an ultrasound bath (Badelin SONOREX Digital 10P, Berlin, Germany) for 10 minutes with deionized water. Then, nails samples were kiln dried at 60 ± 5 °C for 2 h and weighed in a semi-precision digital scale (Mars 3200G/0.01 g; São Paulo, SP, Brazil).
Fluoride Analysis
Considering the sample characteristics, different approaches were employed to determine the fluoride concentration. The microdiffusion method was used for analysis of solid food, beverages, saliva and nail clippings, and the direct method was performed to quantify the fluoride concentration in water and urine samples (24). The analysis of TSF in dentifrices was carried out according to the protocol modified by Pearce (25). A fluoride-ion-specific electrode (BN Model 9409, Orion, Cambridge, MA, USA) and a potentiometer (Model 720 Orion) were used for fluoride analysis, and each sample was analyzed in triplicates. The limit of readings repeatability was 95%. Calibration curves were performed using fluoride standards under the same conditions as samples. Standard samples of 0.019 to 4.750 μg F (direct and microdiffusion methods) and 1250 to 2000 μg F (dentifrice analyses) were prepared by serial dilution
of a stock solution containing 0.1 M F (Orion 940906) for direct and indirect analyses. The millivolt readings were converted to fluoride ion concentration by a standard correlation curve (r²>.99) based on linear equation (y = ax + b). The fluoride concentration was expressed as µg of F/ g for the solid samples and µg of F/ mL for the liquid samples.
Statistical Approach
Statistical analyses were carried out using the Statistical Package for Social Sciences (SPSS) software version 23.0. Data normality was checked using the Shapiro-Wilk test. Comparisons between children from naturally fluoridated and non-fluoridated areas were obtained by the Student t-test. The paired t-test was used to compare pairwise of various sources of TDFI, as well as to measure the difference between [F] of fingernails and toenails within the same area. The two-tailed hypothesis was adopted at 5% significance level.
The Pearson correlation analysis was used to investigate the intensity of the correlations between TDFI and DUFE, TDFI and FUFE, TDFI and TDFR, TDFI and [F] in Fingernails, TDFI and [F] in Toenails, and [F] in Finger- and Toenails. The multiple linear regression was performed by backward elimination procedure with adjusted r² value and 5% of significance. Three explanation models were made to verify the relative influence of fluoride sources on TDFI among children from a naturally fluoridated area (Model 1), from a non-fluoridated area (Model 2), and from both areas (Model 3).
Results
All children completed each phase of the study, however, some children did not cooperate with nails collection or have some deleterious habit as onychophagy (sample loss: 9 for fingernails and 6 for toenails). There is no difference between children in both areas regarding the volume of water ingested and food weight, as well as the fluoride dentifrice concentration (p>0.05). Toothbrushing frequency and dentifrice weights were 1.41 and 0.70 fold higher in children from the non-fluoridated area than in children from the naturally fluoridated area (p<0.05) (Table 1).
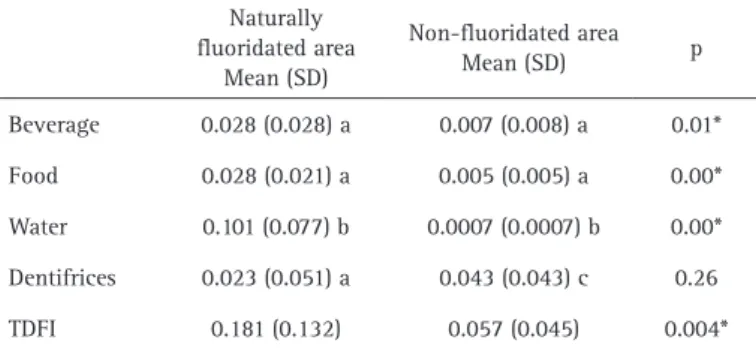
The TDFI of children from the naturally fluoridated area was significantly higher (p=0.004), with a great contribution of fluoridated water. In contrast, the TDFI in children from the non-fluoridated area was more associated with ingested dentifrice (Table 2).
E.T
.es de Sousa
0.986; p-value= 0.000). The Model 3 evidences a significant contribution of water, beverages, and dentifrices to TDFI (r2 = 0.831; p-value= 0.000) (Table 3).
Table 4 indicates that the TDFR was significantly greater in children from the naturally fluoridated area (β-1: > 0.80, p<0.05), although there was a corresponding similarity in the FUFE values in children of both realities (p>0.05). The fluoride concentration in toenails was significantly higher in children from the naturally fluoridated area (β-1: 0.94, p=0.04). However, the fluoride concentrations in fingernails and toenails in each group did not show statistical difference (p>0.05).
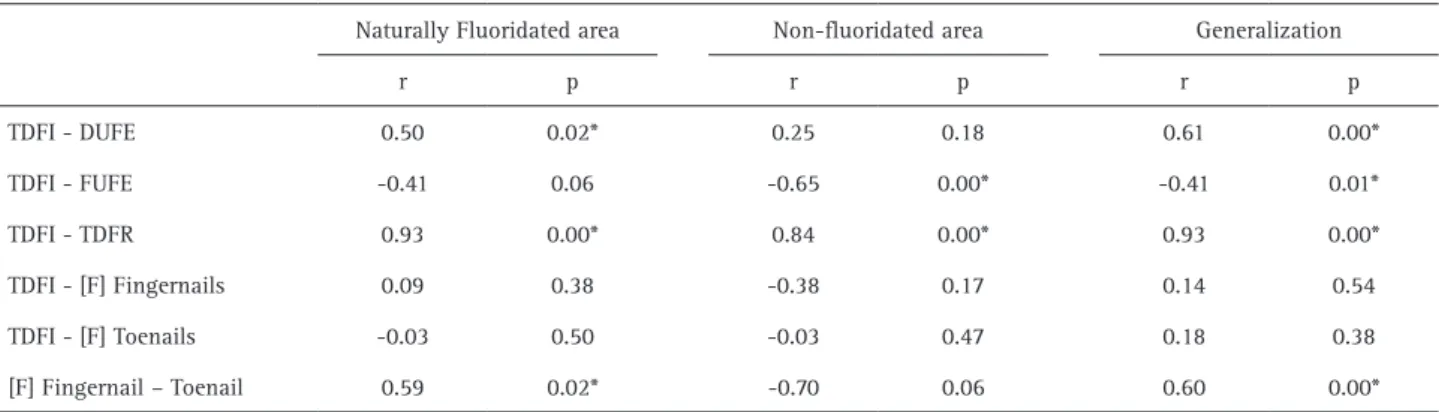
A moderate positive correlation between TDFI and DUFE (r = 0.70, p = 0.000) and between the fluoride contend in
fingernails and toenails (r = 0.59, p = 0.02) were observed in children from the naturally fluoridated area. A strong positive correlation between TDFI and TDFR (r = 0.93, p = 0.00) were observed in all preschoolers (Table 5).
Discussion
Dental fluorosis is a prevalent disease that is physiopathologically influenced by environmental, biological and behavioral factors in early childhood (26,27). In this context, the new and interesting finding of the present study was that the use of 1,100 ppm fluoride dentifrice did not influence the fluoride excretion by kidneys and the fluoride concentration in nails. Besides, it was demonstrated that the urine could be a potential biomarker of exposure to fluoride in children who consume fluoridated groundwater.
The TDFI in children from the naturally fluoridated area showed an ingestion of fluoride above the recommended daily fluoride dose. The water was the source that influenced more TDFI, representing 98% of importance in the linear regression model. Furthermore, the use of fluoridated groundwater for cooking possibly promoted an increased f l u o r i d e i n g e s t i o n (beverages + solid food: 0.05 ± 0.05 mg/kg/day). However, these dietary sources did not show any significant effect on TDFI (Model 1 adjusted). In this context, dental fluorosis risk was associated with the use of water with fluoride content higher than 1.6 ppm for cooking (28). This relationship was previously studied by Lima et al. (29), who associated the fluoride concentration in solid food and beverages in children exposed to 0.64 mg F/mL in water. These authors found that the fluoride concentration in beverages was greater than the fluoride concentration in solid food. This finding was not observed in our study, which demonstrates a similar pattern of fluoride ingestion from beverages and food in children who lived in a naturally fluoridated area. However, considering the
Table 1. Characteristics associated with fluoride monitoring in preschoolers living in naturally fluoridated and non-fluoridated areas
Naturally fluoridated area Non-fluoridated area p Mean (SD) Mean (SD)
Age (years) 3.73 (1.28) 4.40 (1.45) 0.19 Children’ weight (kg) 15.92 (2.80) 19.00 (3.93) 0.02* [F] in tap water (ppm) 2.38 (1.63) 0.03 (0.04) 0.00* Water (mL) 797 (495.79) 671.73 (418.16) 0.46 Food (mg) 477.15 (309.59) 469.01 (219.92) 0.93 Beverage (mg) 563.59 (368.75) 553.74 (275.47) 0.74 Urine (mL) 311.78 (93.36) 474.60 (140.09) 0.02* [TSF] of dentifrices (ppm) 0.92 (0.59) 1.00 (0.51) 0.61
Tooth brushing frequency (times/day) 1.58 (0.51) 2.23 (0.72) 0.02*
Dentifrices weight (mg) 0.57 (0.32) 0.81 (0.51) 0.02* * Student t-test significant. [F] Fluoride concentration; [TSF] Concentration of total soluble fluoride
Table 2. Means and standard deviations of fluoride intake in different dietary sources in preschoolers living in naturally fluoridated and non-fluoridated areas
Naturally fluoridated area
Mean (SD)
Fluoride intak
e and biomark
ers of exposure to fluoride
our results demonstrated that the dentifrice weight and the frequency of brushing were significantly higher in children from the non-fluoridated area as compared with children from the naturally fluoridated water. However, no difference between groups was found in relation to
Table 3. Models of multiple linear regression of TDFI in preschoolers living in naturally fluoridated and non-fluoridated areas Model 1 Adjusted
Naturally fluoridated area
Model 2 Adjusted Non-fluoridated area
Model 3 Adjusted Generalization
β Importance* p β Importance* p β Importance* p
Age - - - -0.06 0.6 0.06 - -
-Water 1.41 98 0.00 3.85 0.3 0.21 0.31 80 0.00 Beverage 0.56 2 0.32 1.41 5 0.00 1.31 5 0.03
Solid Diet - - - 1.72 2 0.00 - -
-Dentifrice - - - 0.99 91 0.00 0.60 13 0.00 Intercept 0.33 - 0.53 0.03 - 0.73 0.20 - 0.40 *The importance values is expressed in %; β = Linear regression coefficient. Model 1: r2 = 0.853; p-value= 0.000; Model 2: r2 = 0.986 p-value=
0.000; Model 3: r2 = 0.831; p-value= 0.000
Table 5. Correlation between TDFI and biomarkers of exposure to fluoride in preschoolers living in naturally fluoridated and non-fluoridated areas Naturally Fluoridated area Non-fluoridated area Generalization
r p r p r p
TDFI - DUFE 0.50 0.02* 0.25 0.18 0.61 0.00* TDFI - FUFE -0.41 0.06 -0.65 0.00* -0.41 0.01* TDFI - TDFR 0.93 0.00* 0.84 0.00* 0.93 0.00* TDFI - [F] Fingernails 0.09 0.38 -0.38 0.17 0.14 0.54 TDFI - [F] Toenails -0.03 0.50 -0.03 0.47 0.18 0.38 [F] Fingernail – Toenail 0.59 0.02* -0.70 0.06 0.60 0.00* *Pearson Correlation test significant.
Table 4. Fluoride monitoring and biomarkers of exposure to fluoride in preschoolers living in naturally fluoridated and non-fluoridated areas
Variable Naturally fluoridated area Mean (SD)
Non-fluoridated area
Mean (SD) p TDFI 0.18 (0.13) 0.05 (0.04) 0.00 DUFE 0.07 (0.04) 0.02 (0.02) 0.00 TDFR 0.10 (0.11) 0.02 (0.04) 0.01
FUFE 38 (40) 46 (45) 0.70
[F] Fingernail 2.87 (1.08) 1.82 (0.85) 0.24 [F] Toenail 2.85 (1.35) 1.46 (0.27) 0.04 Means of TDFI, DUFE and TDFR were expressed as mg/kg bw/day; FUFE value is expressed as %; the values of [F] in nails were expressed as µg F/ g. *Student’s t-test with a 5% of significance level.
fluoride kinetics in the human body (5), information on how food absorbed more fluoride during the cooking process is an epidemiologically important question that cannot be completely answered by the duplicated plate method.
E.T
.es de Sousa
the fluoride intake from dentifrice. This result evidenced that the children’s brushing habit is highly variable and highlights the importance of adopting educational intervention for preschoolers on how to spit out all toothpaste content, to minimize the risk of dental fluorosis.
In the non-fluoridated community, the ingestion of 1,100 ppm fluoride dentifrice was the dominant source of fluoride exposure and the predictor variable for risk ingestion of fluoride. Correspondingly, this penchant was also observed in the area with an optimal concentration of fluoride in tap water and tropical weather (29). Results of the study by Oliveira et al. (30) suggest that 0.50 g of dentifrice applied on the toothbrush makes children more susceptible to dental fluorosis. Despite this fact, based on the strong evidence of the caries-preventive effect of fluoride, brushing the teeth with fluoridated dentifrice should be encouraged. However, to reduce the fluorosis risk, an adult who knows the appropriate amount of dentifrice to be used should supervise this practice.
Despite the minimal variation in the FUFE values (38 - 46%; p>0.05), the present research just found a significant negative correlation between TDFI and FUFE in children of the non-fluoridated area. In contrast, a broad variation in FUFE values according to the dominant route of fluoride intake in children has been demonstrated (31). The high proportion of this variability can be explained by factors such as age, kidney maturation, body mass index, and diet composition (e.g. levels of fat, Ca, Mg, and Fe), which possibly interact to influence the fluoride metabolism (13).
The TDFR shows that approximately 62% of the fluoride ingested was retained in children from the naturally fluoridated area, while 54% was retained in children from the non-fluoridated area. Thus, the tendency to fluoride retention was strongly noted in children from both areas, confirming the dose-dependent mechanism of TDFR (3,31) and the substantial bioavailability of fluoridated water (26) and fluoride dentifrice. Moreover, the variations around the fluoride renal clearance expressed by DUFE might be expected due to the large individual differences in the rates of fluoride removal by the kidneys and skeleton. Thus, the balance of TDFR should be pondered considering the influence of dietary sources, growth metabolism, bone remodeling, kidney function, and gastric absorption, which exchange the fluoride in either direction (13,27,32).
An interesting finding of our study is the statistically significant higher urine volume in the non-fluoridated area as compared with the naturally fluoridated area despite the lower consumption of water and beverages. These results could be a consequence of the children’s behavior. In the naturally fluoridated area, children lived in a rural region with dry weather and low access to technology (they usually play outside their houses). These factors
may have promoted an increase in the fluoride excretion from sweat (33).
The outcomes of the present investigation also demonstrate a moderate positive linear correlation between TDFI and DUFE, suggesting that urine may be considered a predictor of fluoride intake in preschoolers, especially when water is the most important dietary source. Moreover, it is important to highlight the absence of significant correlation between TDFI and DUFE in the community without water fluoridation. From a pharmacokinetic point of view, it is very likely that there are differences in fluoride bioavailability when it is ingested from fluoridated water or dentifrice. In this perspective, the gastrointestinal absorption of fluoride from dentifrice is more influenced by confounding factors such as the time between the brushing act and feeding, as well as by the composition of the meal (34).
Considering the fluoride retention in biological tissues as nail clippings, the [F] in fingernails and toenails were respectively 1.57 (p>0.05) and 1.95 (p<0.05) fold higher in the naturally fluoridated than in the non-fluoridated area. These findings suggest that the fluoride concentration in nails is possibly associated with the sources of fluoride exposure. In this context, it is possible that the fluoride exposure could be estimated in nails when the primary source of fluoride is from systemic sources (14) and from dentifrice (15). Nevertheless, considering the possibility of using nails as a biological marker of fluoride exposure, the present research did not find any correlation between TDFI and the fluoride content in fingernails or toenails. In light of this, it should be pointed out to that despite the period of TDFI assessment and nails collection did not match up, the TDFI was accomplished under customary conditions, without any interference on the daily routine or dietary habit. Thus, other factors may have affected the fluoride retention in nails as the children age range and gender, the rate of nail’s growth (12), or the fluoride uptake from external sources in nails (contact with fluoride dentifrice slurry) (35). Thus, we considered that this biomarker has to be more carefully studied before been employed in a community monitoring program.
Fluoride intak
e and biomark
ers of exposure to fluoride
although the fecal fluoride excretion was not measured, the fluoride deduction of this pathway is highly suggested. The TDFR value might be better estimated if 10% of fecal fluoride excretion per day was deducted from the TDFI (13). Results of this field study indicated that: (a) the fluoridated groundwater exposure influenced the pattern of fluoride concentration in urine, demonstrating a dose-dependent mechanism; and (b) urine and fingernails are not reliable biomarkers of exposure to fluoride in children who consume 1,100 ppm fluoride dentifrice.
Resumo
Esta pesquisa teve como objetivo determinar a influência de águas fluoretadas subterrâneas e do dentifrício com 1.100 ppm de fluoreto nos biomarcadores de exposição ao flúor em pré-escolares. Foi realizado um estudo transversal em trinta pré-escolares recrutados em áreas naturalmente fluoretadas e não fluoretadas (n = 15). A ingestão diária total de flúor (TDFI) a partir da dieta e do dentifrício, assim como a excreção urinária diária de flúor (DUFE), foram medidas ao longo de 24 horas. Amostras de unhas foram coletadas duas vezes durante 30 dias. As análises de flúor foram realizadas usando um eletrodo específico para íon flúor. Os dados foram analisados utilizando o teste t de Student e pareado, a análise de correlação de Pearson, e a análise de regressão linear múltipla (α≤0,05). As águas subterrâneas e dentifrícios fluoretados foram as fontes dominantes (r2>0,83) do TDFI em crianças da área naturalmente fluoretada e não fluoretada, respectivamente. Uma correlação positiva entre TDFI e DUFE (r=0,50) e entre [F] nas unhas das mãos e dos pés (r=0,60) foi encontrada em crianças da área naturalmente fluoretada. A [F] nas unhas das mãos e dos pés não foi correlacionada com TDFI. O consumo de águas subterrâneas fluoretadas influenciou a concentração de flúor na urina. Além disso, o uso de dentifrício com 1.100 ppm de fluoreto não influenciou a concentração de fluoreto na urina e nas unhas.
Acknowledgements
This study was based on a dissertation submitted to the Federal University of Paraíba - Brazil, to obtain the Masters degree in Odontology. The authors thank CNPq (National Counsel of Technological and Scientific Development) for the Master scholarship to the first author and Espaço da Escrita – Coordenadoria Geral da Universidade - UNICAMP - for the language services provided. We especially thank all preschoolers and their parents for their valuable participation in this study.
References
1. Antonijevic E, Mandinic Z, Curcic M, Djukic-Cosic D, Milicevic N, Ivanovic M, et al. “Borderline” fluorotic region in Serbia: correlations among fluoride in drinking water, biomarkers of exposure and dental fluorosis in schoolchildren. Environ Geochem Health 2016;38:885–896. 2. Burt BA. The changing patterns of systemic fluoride intake. J Dent Res
1992 ;71:1228–1237.
3. Villa A, Anabalon M, Zohouri V, Maguire A, Franco AM, Rugg-Gunn A. Relationships between fluoride intake, urinary fluoride excretion and fluoride retention in children and adults: an analysis of available data. Caries Res 2010;44:60–68.
4. Aylward LL, Hays SM, Vezina A, Deveau M, St-Amand A, Nong A. Biomonitoring Equivalents for interpretation of urinary fluoride. Regul Toxicol Pharmacol. 2015;72:158–167.
5. Maguire A, Zohoori F V. Fluoride balance in infants and young children in the U.K. and its clinical relevance for the dental team. Br Dent J 2013;214:587–593.
6. Abuhaloob L, Maguire A, Moynihan P. Total daily fluoride intake and the relative contributions of foods, drinks and toothpaste by 3- to
4-year-old children in the Gaza Strip - Palestine. Int J Paediatr Dent 2015;25:127–135.
7. Wong MCM, Clarkson J, Glenny A-M, Lo ECM, Marinho VCC, Tsang BWK, et al. Cochrane reviews on the benefits/risks of fluoride toothpastes. J Dent Res 2011;90:573–579.
8. Akpata ES, Behbehani J, Akbar J, Thalib L, Mojiminiyi O. Fluoride intake from fluids and urinary fluoride excretion by young children in Kuwait: a non-fluoridated community. Community Dent Oral Epidemiol. 2014;42:224–233.
9. Rodrigues MHC, Leite AL, Arana A, Villena RS, Forte FDS, Sampaio FC, et al. Dietary fluoride intake by children receiving different sources of systemic fluoride. J Dent Res 2009;88:142–145.
10. Zohoori F V, Buzalaf MAR, Cardoso CAB, Olympio KPK, Levy FM, Grizzo LT, et al. Total fluoride intake and excretion in children up to 4 years of age living in fluoridated and non-fluoridated areas. Eur J Oral Sci. 2013 Oct;121:457–464.
11. Pessan JP, Buzalaf MRA. Historical and recent biological markers of exposure to fluoride. Monogr Oral Sci. 2011;22:52–65.
12. Fukushima R, Rigolizzo DS, Maia LP, Sampaio FC, Lauris JRP, Buzalaf MAR. Environmental and individual factors associated with nail fluoride concentration. Caries Res 2009;43:147–154.
13. Buzalaf MAR, Whitford GM. Fluoride metabolism. Monogr Oral Sci. 2011;22:20–36.
14. Buzalaf MAR, Rodrigues MHC, Pessan JP, Leite AL, Arana A, Villena RS, et al. Biomarkers of fluoride in children exposed to different sources of systemic fluoride. J Dent Res 2011;90:215–219.
15. Amaral JG, Freire IR, Valle-Neto EFR, Cunha RF, Martinhon CCR, Delbem ACB. Longitudinal evaluation of fluoride levels in nails of 18-30-month-old children that were using toothpastes with 500 and 1100 μg F/g. Community Dent Oral Epidemiol. 2014 Oct;42:412–419. 16. Buzalaf MAR, Massaro CS, Rodrigues MHC, Fukushima R, Pessan JP,
Whitford GM, et al. Validation of fingernail fluoride concentration as a predictor of risk for dental fluorosis. Caries Res 2012;46:394–400. 17. Lima-Arsati YBO, Martins CC, Rocha LA, Cury JA. Fingernail may not
be a reliable biomarker of fluoride body burden from dentifrice. Braz Dent J 2010;21:91–97.
18. Linhares DPS, Garcia PV, Amaral L, Ferreira T, Cury JA, Vieira W, et al. Sensitivity of two biomarkers for biomonitoring exposure to fluoride in children and women: A study in a volcanic area. Chemosphere. 2016;155:614–620.
19. von Elm E, Altman DG, Egger M, Pocock SJ, Gotzsche PC, Vandenbroucke JP. [The Strengthening the Reporting of Observational Studies in Epidemiology (STROBE) statement: guidelines for reporting of observational studies]. Internist (Berl). 2008;49:688–693. 20. Armitage, P., Berry G. Statistical methods in medical research. In: The
planning os statistical investigations. 2 ed. Oxford, Blackwell; 1987. p. 179–85.
21. Zohoori F V, Whaley G, Moynihan PJ, Maguire A. Fluoride intake of infants living in non-fluoridated and fluoridated areas. Br Dent J 2014 Jan;216:E3.
22. Guha-Chowdhury N, Drummond BK, Smillie AC. Total fluoride intake in children aged 3 to 4 years--a longitudinal study. J Dent Res 1996 Jul;75:1451–1457.
23. Whitford GM. Monitoring fluoride exposure with fingernail clippings. Schweizer Monatsschrift fur Zahnmedizin = Rev Mens suisse d’odonto-stomatologie = Riv Mens Svizz di Odontol e Stomatol. 2005;115:685– 689.
24. Martinez-Mier EA, Cury JA, Heilman JR, Katz BP, Levy SM, Li Y, et al. Development of gold standard ion-selective electrode-based methods for fluoride analysis. Caries Res 2011;45:3–12.
25. Pearce EI. A laboratory evaluation of New Zealand fluoride toothpastes. N Z Dent J 1974;70:98–108.
26. Aoba T, Fejerskov O. Dental fluorosis: chemistry and biology. Crit Rev Oral Biol Med. 2002;13:155–170.
27. Denbesten P, Li W. Chronic fluoride toxicity: dental fluorosis. Monogr Oral Sci. 2011;22:81–96.
E.T
.es de Sousa
predictors of fluorosis and the potential role of food preparation. BMC Oral Health. 2012;12:16.
29. Lima C V, Cury JA, Vale GC, Lima MDM, Moura L de FAD, Moura MS de. Total fluoride intake by children from a tropical brazilian city. Caries Res 2015;49:640–646.
30. Oliveira MJL, Paiva SM, Martins LHPM, Ramos-Jorge ML, Lima YBO, Cury JA. Fluoride intake by children at risk for the development of dental fluorosis: comparison of regular dentifrices and flavoured dentifrices for children. Caries Res 2007;41:460–466.
31. Zohoori F V, Walls R, Teasdale L, Landes D, Steen IN, Moynihan P, et al. Fractional urinary fluoride excretion of 6-7-year-old children attending schools in low-fluoride and naturally fluoridated areas in the UK. Br J Nutr 2013;109:1903–1909.
32. Xiong X, Liu J, He W, Xia T, He P, Chen X, et al. Dose-effect relationship between drinking water fluoride levels and damage to liver and kidney
functions in children. Environ Res 2007;103:112–116.
33. Rugg-Gunn AJ, Villa AE, Buzalaf MRA. Contemporary biological markers of exposure to fluoride. Monogr Oral Sci. 2011;22:37–51. 34. Cury JA, Del Fiol FS, Tenuta LMA, Rosalen PL. Low-fluoride dentifrice
and gastrointestinal fluoride absorption after meals. J Dent Res 2005;84:1133–1137.
35. Whitford GM, Sampaio FC, Anenberg P, von der Fehr FR. Fingernail fluoride: a method for monitoring fluoride exposure. Caries Res 1999;33:461–467.