IMPACT OF WATER DEFICIT ON GRAPE SEEDS
PROANTHOCYANIDINS AND ANTHOCYANINS BIOSYNTHESIS:
Biochemical and Molecular regulation
Raquen Raissa Santos
Dissertação para obtenção do Grau de Mestre em
Biologia Funcional
Orientador: Doutora Maria Manuela Coelho Cabral Ferreira Chaves.
Co-orientador: Doutora Olfa Zarrouk.
Presidente: Doutor Jorge Manuel Rodrigues Ricardo da Silva, Professor Associado
do Instituto Superior de Agronomia da Universidade Técnica de Lisboa.
Doutora Luísa Cristina dos Mártires Ferreira de Carvalho, Investigadora Auxiliar do
Instituto Superior de Agronomia da Universidade Técnica de Lisboa.
Doutora Olfa Zarrouk, Bolseira de Pós-doutoramento do Instituto de Tecnologia
Química e Biológica da Universidade Nova de Lisboa.
Doutora Maria Manuela Coelho Cabral Ferreira Chaves, Professora Aposentada do
Instituto Superior de Agronomia da Universidade Técnica de Lisboa.
Agradecimentos
Aos meus pais, sem os quais não estaria aqui. Pela educação que recebi, por terem me ensinado a ser uma grande pessoa e sempre respeitar as pessoas e a natureza. Meus irmãos pelo apoio e por existirem.
Ao meu marido, Daniel, pelo carinho, companhia, apoio, por estar sempre ao meu lado, pela paciência e pelas valiosas sugestões.
Ao professores que tive ao longo do curso.
À Professora Manuela Chaves, minha orientadora, pela oportunidade da realização do trabalho, pelo apoio a todo o momento, atenção e dedicação. À Olfa Zarrouk, minha co-orientadora, pelos ensinamentos, atenção, dedicação e apoio incondicional. E principalmente pela amizade.
À Rita Francisco, pelas valiosas sugestões, pelo carinho e amizade e por estar sempre presente, mesmo estando ausente. À Alla Shvaleva pelas correcções e pelo incentivo. À Ana Regalado pelos valiosos ensinamentos em biologia molecular. Ao Miguel Costa pelas correcções e ajuda quando solicitado. Às minhas amigas Ana Rita Leandro e Maria Tereza Portes pelo apoio, carinho, companheirismo e amizade e por me fazerem sentir em casa. À Ana Rodrigues pelos preciosos momentos em que passamos no laboratório.
À Stella ESteves, uma bela amizade conquistada ao longo do curso.
À equipe do laboratório de fisiologia vegetal do ISA, que sempre me recebeu com muito carinho. À Luisa Carvalho pelos ensinamentos, atenção e gentileza com que me recebeu. Ao João Fernandes pelas sugestões e parceria. Ao Alexandre pelas valiosas dicas.
Aos amigos, que foram compreensivos com minha ausência, nesta fase de minha vida.
Há um tempo em que é preciso abandonar as roupas usadas, que já tem a forma do nosso corpo, e esquecer os nossos caminhos, que nos levam sempre aos mesmos lugares. É o tempo da travessia: e, se não ousarmos fazê-la, teremos ficado, para sempre, à margem de nós mesmos.
Fernando Pessoa
Abstract
Proanthocyanidins and anthocyanins are polyphenolic secondary metabolites synthesized via the flavonoid pathway. They are considered as important determinants of quality in red grapes and contribute to taste and colour in wines. As most of these compounds accumulate in seeds, these play a key role during the process of making wine. The present study analyzed the accumulation of tannins and anthocyanins in different irrigation regimes as well as the expression of genes that encode for enzymes responsible of proanthocyanidin biosynthesis, anthocyanidin reductase (ANR) and leucoanthocyanidin reductase (LAR1 and
LAR2), and anthocyanin biosynthesis, UDP-glucose:flavonoid 3-O-glucosyltransferase
(UFGT) in grape seeds of Vitis vinifera cv Aragonez along development. Total tannin content was higher in seeds of watered vines while anthocyanin was higher in water stressed vines. The results showed that water deficits had a direct effect on flavonoid gene expression and metabolism. A positive effect of water stress on the ANR mRNA expression at the beginning of seed berry development was observed. On the other hand, water deficit negativily affected the transcription level of LAR1 only at maturation stage and LAR2 along development, being significantly higher at véraison and maturation stage. It is the first time to our knowledge that anthocyanins were detected in grapevine seeds and this result was confirmed at the molecular and the biochemical level.
Resumo
Proantocianidinas e antocianinas são metabolitos secundários polifenólicos sintetizados na via dos flavonóides. Estes compostos são determinantes na qualidade de uvas tintas e contribuem para o paladar e cor dos vinhos. Dado que muitos destes compostos são sintetizados nas sementes das uvas, estas têm um importante papel no processo de produção de vinho. O presente estudo analisou a acumulação de taninos e antocianinas em em diferentes regimes de irrigação bem como a expressão de genes responsáveis pela biossíntese de proantocianidinas, anthocianidina reductase (ANR) e leucoantocianidina reductase (LAR1 e LAR2), e pela biossíntese de antocianinas, UDP-glucose:flavonoide 3-O-glucosiltransferase (UFGT) em sementes de uva de Vitis vinífera cv. Aragonez ao longo do desenvolvimento. Observou-se que o conteúdo de taninos totais foi maior em videiras regadas enquanto que o teor de antocianinas totais foi maior em plantas sujeitas a stresse hídrico. Os resultados mostram que o défice hídrico teve um efeito directo sobre a expressão dos genes estudados. No início do desenvolvimento da semente e em condições de stress hídrico a expressão de ANR foi induzida. Por outro lado, o stress hídrico afectou negativamente a expressão de LAR 1 somente na maturação e LAR 2 em véraison e maturação. Esta é a primeira vez, tanto quanto sabemos, que antocianinas foram detectadas em sementes de uva. Este resultado foi confirmado tanto a nível molecular como bioquímico.
Palavras-chave: Vitis vinifera, sementes de uva, défice hídrico, proantocianidinas, antocianinas.
Titulo:
Impacto do défice hídrico na biossíntese de proantocianidinas e antocianinas em sementes de uva: regulacão bioquímica e molecularResumo Alargado
Proantocianidinas e antocianinas são metabolitos secundários polifenólicos sintetizados na via dos flavonóides. São duas importantes classes de flavonóides. Ocorrem naturalmente em plantas e são amplamente distribuídos no reino vegetal. Estes compostos têm diferentes funções fisiológicas e estão frequentemente envolvidos na protecção contra stresses biótico e abiótico. Diversos trabalhos científicos apontam para os benefícios destes compostos na saúde humana. Devido à grande importância económica do vinho e do potencial nutracêutico dos componentes da uva, nomeadamente dos flavonóides, diversos estudos têm sido realizados. Estes compostos contribuem para as características organolépticas da uva e consequentemente do vinho. Proantocianidinas são compostos oligómericos e polímericos de flavan-3-ol. Contribuem não só para as características organolépticas do vinho como também para a estabilização da cor dos vinhos. As antocianinas constituem o maior grupo de flavonóides e são responsáveis pelas cores ciânicas dos bagos de uva. Tradicionalmente a vinha é uma cultura não regada, contudo em situação de seca e elevadas temperaturas, que afectam a fisiologia e a produtividade da vinha o uso da rega por muitos viticultores têm-se tornado uma prática corrente. O uso inadequado de água, com perda da qualidade do bago, levaram à utilização das chamadas regas deficitárias, nomeadamente a rega deficitária regulada (do inglês RDI – Regulated Deficit Irrigation), onde a rega é aplicada abaixo das necessidades totais da cultura, isto é, 100% da evapotranspiração (ETc). Pretende-se através deste tipo de prática cultural obter um balanço adequado entre o desenvolvimento vegetativo e produtividade de qualidade satisfatória. Estudos demonstram que uma rega deficitária, correspondente a um stress hídrico ligeiro a moderado, em fases determinantes do desenvolvimento do bago de uva podem ter um efeito positivo ao nível da qualidade da produção. O efeito do défice hídrico sobre o metabolismo dos flavonóides tem impacto sobre importantes parâmetros de qualidade, uma vez que influenciam características ao nível do paladar dos vinhos. Muitos destes compostos acumulam-se nas sementes das uvas, o que justifica que as sementes desempenhem um importante papel no processo de produção do vinho. O presente estudo analisou a acumulação de taninos e antocianinas em diferentes regimes de irrigação bem como a expressão de genes responsáveis pela biossíntese de proantocianidinas, anthocianidina reductase (ANR) e leucoantocianidina reductase (LAR1 e LAR2), e pela
biossíntese de antocianinas, UDP-glucose:flavonoide 3-O-glucosiltransferase (UFGT) em sementes de uva de Vitis vinífera cv. Aragonez ao longo do desenvolvimento. A análise da expressão dos genes foi realizada pela técnica de PCR quantitativo em tempo real (do inglês ‘Quantitative Real time PCR’).
Neste trabalho observou-se em condições de stress hídrico uma diminuição do peso fresco do bago quando comparado com condições controlo. O peso fresco da semente apresentou o seu valor máximo nas fases iniciais do desenvolvimento do bago. Nos três tratamentos as sementes perderam água depois do pintor (véraison). O tratamento hídrico aumentou o número de sementes por bago.
O défice hídrico revelou ter um impacto significativo sobre a biossíntese de taninos e antocianinas nas sementes. Observou-se uma tendência ao aumento do teor de taninos totais em vinhas regadas enquanto que o conteúdo em antocianinas totais foi maior em vinhas sob stress. Neste trabalho foi detectada a presença de antocianinas em sementes de uva. Uma vez que antocianinas monoméricas foram detectadas em todos os regimes hídricos, estes resultados sugerem que a sua síntese e acumulação não é consequência do stress hídrico.
Neste trabalho observou-se que os diferentes regimes hídricos influenciaram tanto o teor como o padrão de acumulação de antocianinas. O défice hídrico também teve um impacto significativo sobre a regulação de transcritos de antocianinas e taninos. Observou-se um efeito positivo do stress hídrico em plantas não irrigadas sobre a expressão de ANR no início do desenvolvimento da semente. Por outro lado, o stress hídrico afectou negativamente a expressão de LAR 1 somente na maturação e LAR 2 em véraison e maturação. Os resultados indicam que LAR1 é provavelmente específica da semente. Transcritos de UFGT são modulados pelo tratamento de água. Observaram-se diferenças entre o nível de transcritos e a concentração de antocianinas monoméricas, o que sugere que na modulação de antocianinas poderão existir outros mecanismos além do transcricional.
Pouco é conhecido sobre os genes que contribuem para a síntese de PAs em sementes. A acumulação e a expressão de genes de antocianinas não tinham ainda sido estudadas neste tecido. Adicionalmente poucos trabalhos foram feitos para avaliar o impacto do suprimento de água sobre a acumulação e expressão de genes dos flavonóides em sementes de uva.
Palavras‐chave: Vitis vinifera, sementes de uva, défice hídrico, proantocianidinas, antocianinas.
Table of content
Introduction ... 1
1. Grapevine (Vitis vinifera L.) ... 1
1.1. Grape berry development ... 1
1.2. Seed development ... 3
2. Water deficit and grapevine ... 4
2.1. Concept of regulated deficit irrigation (RDI) in grapevine ... 4
2.2. Effect of water deficit on berry quality ... 5
3. Flavonoids – secondary compounds ... 7
3.1. Proanthocyanidins ... 7
3.1.1. Structures of proanthocyanidins ... 8
3.1.2. Biosynthesis of proanthocyanidins in grapevine ... 8
3.1.2.1. Anthocyanidin Reductase (ANR) ... 10
3.1.2.2. Leucoanthocyanidin Reductase (LAR) ... 10
3.1.3. Proanthocyanidins in grape seeds ... 11
3.1.4. Effect of water status on proanthocyanidin in grape berries ... 12
3.2. Anthocyanins ... 13
3.2.1. Structures of anthocyanin ... 13
3.2.2. UDP glucose - flavonoid 3-O- glucosyltrasferase (UFGT) ... 14
3.2.3. Anthocyanins in Vitis vinifera ... 14
3.2.4. Effect of water status on anthocyanin of grape berries ... 14
4. Importance of seed in wine quality ... 15
5. Objective ... 16
6. Material and Methods ... 17
6.1. Field conditions and plant material ... 17
6.3. Total soluble solids (TSS- Total sugar), titratable acidity (TA) and berry size
measurement ... 18
6.4. Phenols and anthocyanin extraction ... 18
6.5. Total tannin quantification ... 18
6.6. Total monomeric anthocyanin quantification ... 19
6.7. Molecular Analysis ... 20
6.7.1. RNA extraction ... 20
6.7.2. RNA purification ... 20
6.7.3. RNA Quantification and analysis ... 21
6.7.4. cDNA synthesis (RT-PCR) ... 21
6.7.5. Primer Design ... 21
6.7.6. Quantitative RT-PCR ... 22
6.8. Statistical analysis ... 23
7. Results ... 24
7.1. Predawn leaf water potencial (Ψpd) ... 24
7.2. Total soluble sugar (TSS), titratable acidity (TA) and berry size measurements ... 25
7.3. Berry seeds ... 26
7.4. Total tannin concentration ... 28
7.5. Total monomeric anthocyanin ... 29
7.6. Changes in ANR, LAR and UFGT expression during seed development ... 30
7.6.1. ANR expression in vine seeds of the different irrigation treatments ... 31
7.6.2. LAR1 expression in vine seeds of the different irrigation treatments ... 32
7.6.3. LAR2 expression in vine seeds of the different irrigation treatments ... 33
7.6.4. UFGT expression in vine seeds of the different irrigation treatments ... 34
8. Discussion ... 35
9. Conclusions ... 39
Figure Index
Figure 1. Developmental events of grape berry, relative size, berry formation and ripening demonstrated changes in colour and majors compounds along development, 0Brix and xylem and phloem rate flow (Coombe, 1973 illustration by Jordan Koutroumanidis). ... 2
Figure 2. Diagram of seed and berry development. Seed and berry formation were completed in the beginning of véraison. The level of monomers stopped when commenced the oxidation of tannins in véraison. The completed formation of seed finished and berries reached their maximum weight (Ristic and Iland, 2005). ... 3
Figure 3. Grapevine growth stages emphasising shoot growth ahead of flowering and fruit enlargement in phases. Regulated deficit irrigation is imposed so that vine stress builds up after flowering; full irrigation is restored just before véraison (Based on B.G. Coombe, unpublished data). . 5
Figure 4. Stereochemistry structures of the flavan-3-ols catechins and epicatechins (He et al., 2008). ... 8 Figure 5. Flavonoid biosynthetic pathway. ... 9
Figure 6. Berry Grape proanthocyanidins. Cortell et al. 2005. ……….. 11
Figure 7. Two development periods of the seed tannin compared to skin tannin (Kennedy et al., 2000). ... 12
Figure 8. Anthocyanin structure (Cortell, 2006). ... 13
Figure 9. Berries sampled at four developmental stages: pea size, véraison, maturation and full maturation. ... 17
Figure 10. Predawn leaf water potential measured at pea size, véraison, maturation e full maturation in FI, RDI, and NI vines. ... 24
Figure 11. Fresh and dry weight (gram) of berries along development. ... 25
Figure 12. Total soluble sugar content (degree Brix), and titratable acidity of berries along development. ... 26
Figure 13. Seed fresh weight at pea size, véraison, maturation and full maturation in the three water treatment (FI, RDI and NI). ………... 27
Figure 14. Total tannin content in grape seeds (A) per gram of fresh weight (B) per seed basis. ... 28
Figure 15. Monomeric anthocyanin content (A) per gram of fresh weight (B) per seed basis. ... 29
Figure 16. Transcript levels of ANR in seeds during berry development. (A) Gene expression is expressed relative to actin in each sample. (B) Differential mRNA expression of ANR, in seed under RDI and NI. ... 31
Figure 17. Transcript levels of LAR1 in seeds during berry development. (A) Gene expression is expressed relative to actin in each sample. (B) Differential mRNA expression of LAR1, in seed under RDI and NI. ... 32
Figure 18. Transcript levels of LAR2 in seeds during berry development. (A) Gene expression is expressed relative to actin in each sample. (B) Differential mRNA expression of LAR2, in seed under RDI and NI. ... 33
Figure 19. Transcript levels of UFGT in seeds during berry development. (A) Gene expression is expressed relative to actin in each sample. (B) Differential mRNA expression of UFGT, in seed under RDI and NI. ... 34
Table index
Table 1. Pair primers used for PCR amplification to ANR, LAR1, LAR2, UFGT and Actin. ... 21
Table 2. Reactions conditions for thermal cycling in real time PCR. ……… 22
Abbreviations List
ANR Anthocyanidin reductase C Catechin
cDNA Complementary DNA
CT Threshold cycle cv Cultivar DF Dilution factor DG Degree of galloylation DP Degree of polymerization EC Epicatechin ECG Epicatechin-3-O-gallate EGC Epigallocatechin
Etc Crop evapotranspiration
FI Full irrigation
FM Full maturation
FW Fresh weight
LAR1 Leucoanthocyanidin reductase, isoform 1 LAR2 Leucoanthocyanidin reductase, isoform 2 M Maturation
MCP Methyl cellulose precipitable
Min Minute
mRNA Messenger RNA
MW Molecular weight
NI Non Irrigation
OIV Office International de la Vigne et du Vin PAs Proanthocyanidins
PS Pea size
qRT-PCR Quantitative real-time Polymerase Chain Reaction RDI Regulated Deficit Irrigation
RT-PCR Reverse Transcriptase Polymerase Chain Reaction TA Titratable acidity
TSS Total soluble solids
UFGT UDP-glucose:flavonoide 3-O-glucosiltransferase V Véraison
Introduction
1.
Grapevine (Vitis vinifera L.)
Grapevine (Vitis) is one of the major fruit crops in the world in terms of cultivated surface and economic value (Vivier and Petrorius, 2002; FAO, 2005), and it is a highly adapted crop to Mediterranean conditions. Grapevine is a genetically heterogeneous species, mainly due to frequent spontaneous mutations, which favoured the differentiation of a wide range of cultivars (Bota et al., 2001).
V. vinifera is the only species of the genus indigenous to Eurasia and it is suggested
to have first appeared 65 millions years ago (This et al., 2006). Two forms still co-exist in Eurasia and in North Africa: the cultivated form, V. vinifera subsp. vinifera (or sativa) and the wild form V. vinifera subsp. silvestris (or sylvestris). This separation into subspecies was based on morphological differences. The differences are most likely the result of domestication over time by humans rather than geographical isolation (Zohary, 1995).
Vitis vinifera is the species of Vitis genus mostly used in the global wine industry. It
was traditionally non irrigated, occupying an extensive agricultural area in dry and semi-arid regions (Cifre et al., 2005).
1.1.
Grape berry development
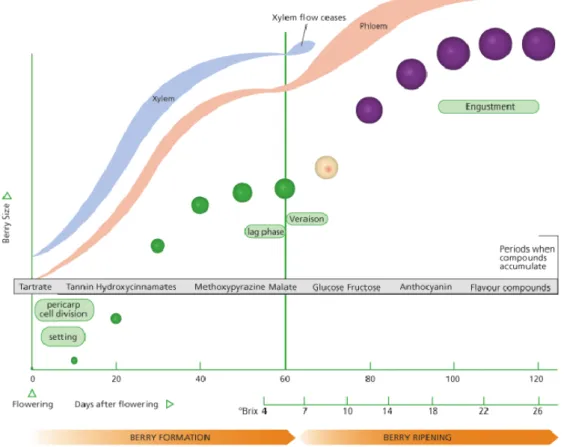
Grape berry is a non-climacteric fruit, and it is a sink for water, minerals, micronutrients and primary metabolites such as sugar and amino acids. In addition it is able to synthesize the major determinants of the aroma, colour and flavour presents in the wine (Grimplet et al., 2007). The grape berry growth is characterized by a double sigmoid curve resulting from two consecutive stages of growth, separated by a slow phase or no growth (Figure 1) (Coombe, 1973).
Figure 1. Developmental events of grape berry, relative size, berry formation and ripening demonstrated changes in colour and majors compounds along development, 0Brix and xylem and
phloem rate flow (Coombe, 1973 illustration by Jordan Koutroumanidis).
- Stage I: First growth period: a period of rapid berry growth comes immediately after bloom. In this period, berries grow both through a rapid cell division and cell enlargement and the number of cells within the berry is established. Seed embryos are produced and berry colour is green due to the presence of chlorophyll. The sugar content of the berry remains low, while solutes, such as, tartaric and malic acid, minerals, amino acids, and micronutrients, are accumulated.
- Lag phase of berry growth: It is characterized by a markedly slow berry growthwhile the berries organic acid concentration reaches its highest level. The beginning of berry softening and colouring occurs. In red grapevines, the berry begins the accumulation of anthocyanins. The seed embryo develops with a concomitant hardening of the seed coat.
- Stage II: Second growth period: this stage is considered as the beginning of véraison. In stage II (ripening or maturation stage) apart from berry softening, glucose and fructose begins to accumulate at the vacuoles while the concentration of organic acids declines. Aroma and flavour components accumulate in the fruit. Berry growth during this stage is
limited to cell enlargement, and the fruit approximately doubles in size. Anthocyanins continue to accumulate in red grape varieties and much of the seed is fully developed. Tannins decline considerably on a per-berry basis during the second period of growth. Skin tannins decline or remain constant, and also become modified.
1.2. Seed
development
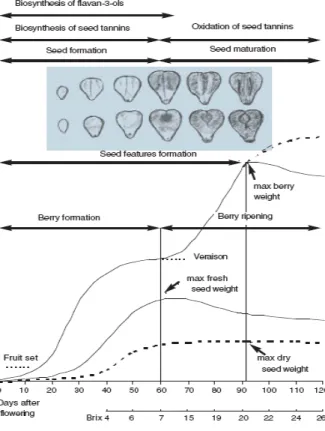
The seed development and maturation (Figure 2) begins with rapid cell division and cell enlargement. During stage I of berry development, the rate of pericarp cell division is positively correlated with the growth rate of developing seeds. At the end of stage I, seeds reach nearly their full size. The beginning of véraison is associated with cessation of seed growth. At Stage II, the growth of the seed embryo, very slow at the beginning, becomes rapid and seeds reach their maximum size. The grape seeds become hard and change in colour from green to brown (Ristic and Iland, 2005). The reduction in seed tannins appears to be due to oxidation as the tannins become fixed to the seed coat.
Figure 2. Diagram of seed and berry development. Seed and berry formation were completed in the beginning of véraison. The level of monomers stopped when the oxidation commenced of tannins in
véraison. The completed formation of seed finished and berries reached their maximum weight (Ristic and Iland, 2005).
2. Water deficit and grapevine
Irrigation of winegrapes is prohibited in many European countries due to a traditional belief that it reduces wine quality (Bravdo, 2001). However, some European regions came closer to the thresholds of temperature and rainfall for optimum grapevine growth (Jones et
al., 2005). In addition, the scenario prediction of increase in aridity, longer drought periods
and higher temperatures (IPCC, 2007), suggests negative effects on grapevine yield and berry quality by limiting photosynthesis, inhibiting vine growth and therefore affecting the productivity and fruit quality (Chaves et al., 2003). Semiarid Mediterranean environments of Southern Europe, will be affected by these environmental changes (Schultz, 2000, De la Hera et al., 2007). As a consequence, viticulturists of these regions will have to rely more and more on irrigation in order to stabilize yield and improve/maintain berry and wine quality.
The vines respond to water deficit with stomatal closure to limit water loss (Escalona
et al., 1999), but also diminishing leaf carbon fixation. In parallel, at the shoot and root level
inhibition of cell division and expansion also takes place (Xiong and Zhu, 2001), reducing its vegetative growth. As it is shown in Bravdo (2001), wines with high quality can be obtained under different irrigation regimes. Irrigation enables to control soil water availability and thereby the vine water potential at various vegetative and reproductive stages. The key to improving winegrape quality in irrigated vineyards is to achieve an appropriate balance between vegetative and reproductive development. In recent years, one of the main approaches for developing practical solutions to manipulate grapevine vegetative and reproductive growth has been the use of regulated deficit irrigation (RDI). The development of this technique was possible as a consequence of the better understanding of the physiological responses to water deficit and the widespread use of drip and other forms of micro-irrigation that allows the precise control of water application rate and timing (McCarthy
et al., 2002).
2.1.
Concept of regulated deficit irrigation (RDI) in grapevine
Regulated deficit irrigation (RDI), is an irrigation technique originally developed for fruit orchards, and has been successfully adapted to grapevines (McCarthy et al., 2002). RDI consists in a regulation of water volumes of irrigation (Figure 3), maintaining vine water
status within prescribed limits of deficit with respect to maximum water potential for part of the seasonal cycle of grapevine development. Therefore it controls reproductive and vegetative growth and improves water use efficiency (Kriedemann and Goodwin, 2003).
Various timings and intensities of the deficit can be used to achieve specific objectives (Prichard et al., 2004). In grapevines, pre-véraison deficit irrigation was shown to cause a greater reduction in berry size than post-véraison deficit (Matthews et al., 1987). In general terms, pre-véraison regulated deficit irrigation reduced shoot growth, and thus canopy volume, increased berry pH and decreased titratable acidity. By contrast,
post-véraison regulated deficit irrigation reduced yields, °Brix and titratable acidity.
Figure 3. Grapevine growth stages emphasising shoot growth ahead of flowering and fruit enlargement in phases. Regulated deficit irrigation is imposed so that vine stress builds up after flowering; full irrigation is restored just before véraison (Based on B.G. Coombe, unpublished data).
2.2. Effect
of
water
deficit on berry quality
Water deficit was reported to influence berry development and composition, and its timing and intensity are key factors that regulate berry characteristics (colour, flavour, and aroma). The effect of water deficit on berry quality is variety dependent (Deluc et al., 2009) and also differs with the specific grape berry tissues (skin, pulp, seeds).
Vine water status influences fruit composition through an indirect effect on berry size, and therefore the ratio of skin to pulp (Bravdo et al., 1985, Kennedy et al., 2002). There is however a direct, possibly greater effect, on skin flavonoids content (Roby et al., 2004). Prichard et al. (2004) reported that moderate water deficit increases sugar content what resulted in an earlier harvest. Furthermore, the reduction of pH and total acidity through the reduction of malic acid concentration and the increase of the tartaric acid was also observed. In addition, regulating grapevine water deficit is considered as a powerful tool for managing the amount of the phenolic compounds and therefore wine quality (Kennedy et al., 2002). Water deficit was shown to have a significant impact on the mRNA expression of many genes in the flavonoid pathway (Grimplet et al., 2007). It is generally reported that water stress enhances the accumulation of anthocyanins compounds in grape berry. However, contradictory responses are reported in the literature probably due to the many variables that influence anthocyanin accumulation (Downey et al., 2006). It is thought that water stress stimulate anthocyanin hydroxylation probably by up-regulating the F3’5’H enzyme (Mattivi et
al., 2006; Castellarin et al., 2007b). The recent study on gene regulation of the anthocyanin
pathway, highlighted that gene regulation was affected by the timing of water stress imposition (Castellarin et al., 2007a,b), although the total anthocyanin content was not altered. This suggests that water stress may have more impact on anthocyanin composition than on its accumulation. Apparently, water stress has a lesser effect on the accumulation of other phenols in berry tissues. Reports showed that berry skin tannins (PAs) are slightly affected by water deficit (Downey et al., 2006). In addition, two studies done with the same cultivar, although in different environments, did not show any significant effects of water deficit on seed proanthocyanidin (Kennedy et al., 2000b; Geny et al., 2003). However, a decrease in the amount of flavan-3-ol monomers and a strong increase in their rate of loss during fruit ripening was also observed (Kennedy et al., 2000b).
Many reports on the effect of water status on berry quality are mainly descriptive. This may reflect the complexity of plant response to the environment as well as the high number of variables that have to be taken into account when studying such subject. Improvements in winegrape production and fruit quality will for sure benefit from the better understanding of the molecular genetic basis underlying berry development (Cramer et al., 2007).
3. Flavonoids – secondary compounds
The flavonoids are secondary metabolites that occur naturally in plants and are widely distributed (Braidot et al., 2008). These compounds play different physiological roles and are often involved in protection against abiotic and biotic stress (Braidot et al., 2008). Due to the great economical importance of wine and the nutraceutical potential of grape components (Conde et al., 2007), several studies have been done in grape berry flavonoids, mainly related to the effect of biotic and abiotic stress on global transcriptional profiling in the berry (Cramer et al., 2007; Hren et al., 2009). The flavonoid gene expression has been well-characterized in berries and seeds of both red and white cultivars (Boss et al., 1996, Bogs et.
al., 2006, Conde et. al., 2007). In addition, studies on the transport of flavonoid compounds
in the cell (Gomez et al, 2009) were reported. Terrier et al. (2005) showed a set of differentially expressed genes involved in secondary metabolism in grape berry along development. Additionally, the effect of water deficit on grape berry tissues and the tissue-specific expression pattern was investigated (Grimplet et al., 2007). Tannins and anthocyanins are considered as two most important classes of flavonoids. These compounds, contribute in different proportion and manner to organoleptic features of grape and wine. The majority of phenolic compounds in wine are derived from flavonoids (PAs). For red grapes, roughly 30–40% of the total phenolic content is located in the skins and 60–70% in the seeds (Shi et al., 2003). However, the effects of the water deficit on the mRNA transcripts in seeds still scarcely understood.
3.1. Proanthocyanidins
Proanthocyanidins (PAs), also known as condensed tannins, are oligomers and polymers composed of elementary flavan-3-ol units. PAs are widespread throughout the plant kingdom; they accumulate in many different organs and tissues (Dixon et al., 2005). Diverse biological and biochemical activities, including protection against predation, pathogen attack, etc have been observed. The beneficial effects on human health such as anticancer activities, antioxidant, cardio-protective properties have also been reported (Aron and Kennedy, 2008).
PAs are the tannins mostly present in grapes followed by anthocyanins (Souquet et
al., 1996) and contribute to the bitterness and astringency of berries, with a significant
influence on the mouth feel. They are also considered to be important to the long-term colour stability of red wine (Waterhouse, 2002).
3.1.1. Structures of proanthocyanidins
Proanthocyanidin structures vary depending on the nature (stereochemistry and hydroxylation pattern) of the flavan-3-ol starter and extension units, the position and stereochemistry of the linkage to the ‘lower’ unit, the degree of polymerization, and the presence or absence of modifications such as esterification of the 3-hydroxyl group (Dixon et
al., 2005). The flavan-3-ol units have the typical C6-C3-C6 flavonoid skeletons. 2,3-trans-(+)-Catechin and 2,3-cis-(-)-epicatechin are the most usual monomeric units in PAs, which have the opposite stereochemistry of the chiral C3 carbon on the C rings (He et al., 2008). Proanthocyanidins can be also divided into two types based on intermonomeric linkages: A-type and B-A-type. In the case of B-A-type, the flavan monomers are linked by C4→ C8 or C4→
C6. The A-type proanthocyanidins present one supplementary linkage C2-O-C7 or C2-O-C5, in
addition to linkage C4→ C8 or C4→ C6.
(+)- Catechin (-)- Epicatechin (-)- Catechin (+)- Epicatechin
Figure 4. Stereochemistry structures of the flavan-3-ols catechins and epicatechins (He et al., 2008).
3.1.2.
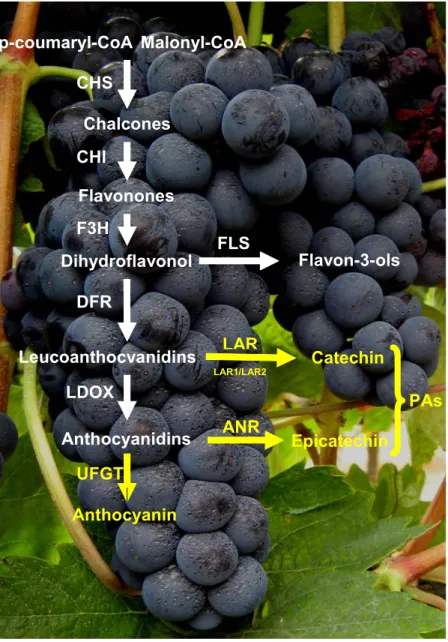
Biosynthesis of proanthocyanidins in grapevine
The understanding of the proanthocyanidin branch of the pathway is still difficult and the potential role of an enzymatic or non-enzymatic mechanism for their condensation is unclear, mainly due to the unknown nature of the substrate(s) for polymerization (Dixon, 2005; He et al., 2008). In spite of their importance in red winegrapes, their biosynthetic pathways were only revealed in 2003. Flavan-3-ols monomers are formed by two biosynthetic routes, from leucoanthocyanidins or anthocyanidins. BANYULS (BAN) gene was isolated in Arabidopsis thaliana and was first thought to encode leucoanthocyanidin reductase (LAR) (Devic et al., 1999). However, it was then discovered that it encodes anthocyanidin reductase (ANR) (Xie et al., 2003). In grapevine, one isoform of ANR (Fujita et
al., 2005) and two LAR isoforms (Bogs et al., 2005) were characterized in the different grape
berry tissues (skin, seeds and leaves). The characterization of flavan-3-ols biosynthetic
pathway in grapevines indicates that catechins are produced from the leucoanthocyanidins by LAR, while the epicatechin are produced from the anthocyanidins by ANR (Figure 5). In spite of the recent molecular characterization of the LAR and ANR in grapevine, it is still unclear whether the polymerization of PAs occurs spontaneously or is totally or partially enzyme catalyzed (Ferreira et al., 2006).
Figure 5. Flavonoid biosynthetic pathway. p-coumaryl-CoA Chalcones Malonyl-CoA Anthocyanidins Leucoanthocyanidins Flavonones Dihydroflavonol Anthocyanin Catechin Epicatechin Flavon-3-ols CHS CHI F3H DFR LDOX UFGT LAR ANR PAs FLS LAR1/LAR2
3.1.2.1. Anthocyanidin Reductase (ANR)
Anthocyaidin reductase converts anthocyanidins to epicatechin. The ANR reaction involves a double reduction at the C-2 and C-3 of the anthocyanidin, allowing the inversion of C-3 stereochemistry. The proposed reaction mechanisms are based on anthocyanidins as the starting molecules. However, as acknowledged, other forms of the anthocyanidin may exist in vivo (Ferreira et al., 2006).
3.1.2.2.
Leucoanthocyanidin Reductase (LAR)
Leucoanthocyanidin reductase removes the 4-hydroxyl from leucoanthocyanidins to produce the corresponding catechin. The preferred substrate is 3,4-cis-leucocyanidin, although 3,4- cis-leucodelphinidin and 3,4-cis-leucopelargonidin are also accepted (Ferreira
et al., 2006). Although 2,3-cis-3,4-trans-leucoanthocyanidins have not been shown to exist
as substrates in vivo, if LAR accepted them it would raise the possibility of a route to the flavan-3-ols in addition to the route through ANR. The difficulty in synthesizing 2,3-cis-3,4-trans-leucoanthocyanidins in vitro has prevented a definitive test of LAR activity with these substrates. However, product inhibition is about 100 times greater with catechin than epicatechin, supporting ANR as the main route (Ferreira et al., 2006).
3.1.3.
Proanthocyanidins in grape seeds
According to Cortell et al. (2005), berry grape proanthocyanidins contain different flavan-3-ol subunits (Figure 6):
• (+)-catechin (C) • (-)-epicatechin (EC)
• (-)-epicatechin-3-O-gallate (ECG) • (-)-epigallocatechin (EGC).
Figure 6. Berry Grape proanthocyanidins. Cortell et al. 2005.
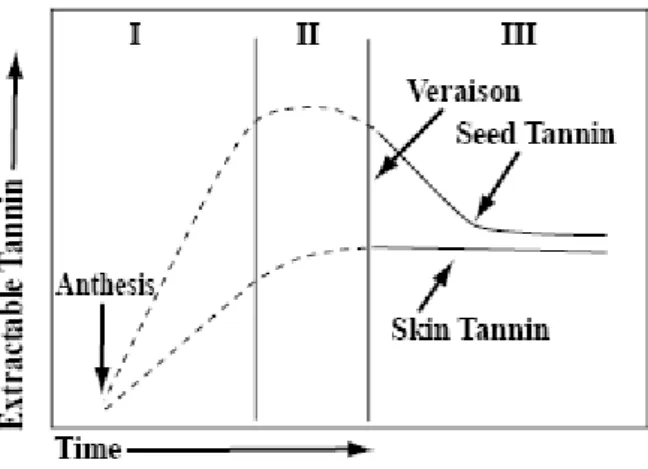
Depending on the grape variety, the monomeric flavan-3-ols are present at variable amounts depending on the degree of ripening (Kennedy et al., 2000a). Seeds have been reported to contribute more on flavan-3-ols than exocarp tissues (Monagas et al., 2003; Mulinacci et al., 2008). However, in some varieties, trace amounts of monomers and dimers have also been detected in the mesocarp (Ferreira et al., 2006). Skin tannins differ from those found in seeds by the presence of prodelphinidins (EGC), the higher degree of polymerization and the lower proportion of galloylated subunits (Souquet et al., 1996). Seed tannins are oligomers and polymers composed of the monomeric flavan-3-ols (+)-catechin (c), (-)-epicatechin (EC), and (-)-epicatechin gallate (ECG) (Prieur, 1994). Flavan-3-ol monomers development in seeds can be divided in two periods, the first of accumulation and the second of decline, with the separation near véraison (Figure 7). The majority of flavan-3-ol monomers accumulate in the 3 weeks prior to véraison and the decline occurs after
véraison (i.e. ECG >> C > EC in Vitis vinifera v Shiraz by Kennedy et al., 2000a). These
changes affect the tannin structure (Kennedy et al., 2000a) and the visual change in the seed is an alteration in the seed coat colour, from a bright green to a dark brown with the final oxidation of the seed coat.
Figure 7. Two development periods of the seed tannin compared to skin tannin (Kennedy et al., 2000c).
3.1.4
. Effect of water status on proanthocyanidin in grape
berries
Proanthocyanidin accumulation in the berry revealed little alteration under water deficit (Castellarin et al., 2007a; Grimplet et al., 2007). The pattern of proanthocyanidin accumulation was similar in control and water stressed treatments with a peak of accumulation before véraison (Castellarin et al., 2007a). Moreover, a limited influence of vine water status on seed proanthocyanidins was observed (Kennedy et al., 2000b; Geny et al., 2003). Seed tannins content increase approximately in proportion with berry size, seed number, and total seed mass per berry, and no independent effect caused by water status was demonstrated (Roby et al., 2004).
3.2. Anthocyanins
Anthocyanins constitute a major flavonoid group responsible for cyanic colours, ranging from salmon pink through red and violet to dark blue. Anthocyanic coloration plays a vital role in the attraction of insects and birds, leading to pollination and seed dispersal. It also plays a role in defence against herbivores or pathogenic fungal infection. Anthocyanins contribute to osmotic adjustment to drought and frost stress, act as antioxidants, and UV and visible light protectants. Moreover, anthocyanins are regarded as important nutraceuticals due to their antioxidant effects, with a potential role in prevention of the various diseases (Andersen and Jordheim, 2006).
3.2.1.
Structures of anthocyanin
Anthocyanins have aglycone (anthocyanidin), sugar(s), and, in many cases, acyl group(s). The anthocyanidins (Figure 8) are derivatives of 2-phenylbenzopyrylium (flavylium cation) (Andersen and Jordheim, 2006). The colour of the anthocyanin depends on the structural form, ranging from red for the flavylium, blue for the quinone base, colorless for the carbinol base, and very pale yellow for the chalcone form. Anthocyanins are water soluble compounds and are glycosylated most commonly at the C-3 position, and the sugar can be acylated as well. The sugars that have been identified include glucose, galactose, xylose, rhamnose and arabinose (Cortell, 2006).
3.2.2.
UDP glucose - flavonoid 3-O- glucosyltrasferase
(UFGT)
Anthocyanin biosynthesis (Figure 5) is strictly catalyzed by UDP-glucose:flavonoid
3-O-glucosyltransferase (UFGT). UFGT catalyzes the glycosylation of unstable anthocyanidin
aglycones into pigmented anthocyanins. Two primary anthocyanins termed cyanidin and delphinidin are synthesized by UFGT. Cyanidin has a B-ring dihydroxylated at the 3` and 4` positions whereas delphinidin has a tri-hydroxylated B-ring due an additional hydroxyl group at the 5` position. Cyanidin and delphinidin are precursors derived from parallel pathways that originate downstream of flavonoid 3` hydroxylases and flavonoid 3`5` hydroxylases (Bogs et al., 2006; Castellarin et al., 2006).
3.2.3.
Anthocyanins in Vitis vinifera
Grape berry anthocyanins are mainly 3-O-monoglucosides of delphinidin-3-O-glucoside, cyanidin-3-O-delphinidin-3-O-glucoside, petunidin-3-O-delphinidin-3-O-glucoside, peonidin-3-O-delphinidin-3-O-glucoside, and malvidin-3-O-glucoside (Flamini, 2003). Anthocyanins are localized in the berry skins, except in a few varieties, that also contain anthocyanins in their pulp (Cheynier, 2006). To our knowledge the presence of anthocyanins in grape seeds was never been reported. They are present exclusively in the vacuoles (Garcia et al. 1992) and their accumulation in grape berry begins at véraison and continues throughout the ripening phase of berry growth. Several factors, such as cultivar, climate, soil conditions, canopy management, crop level and irrigation, can influence the amount of anthocyanins produced and the profile of different pigments in red grapes (Ryan and Revilla, 2003).
3.2.4.
Effect of water status on anthocyanin of grape
berries
Generally, water deficit may enhance the concentration of anthocyanins in grape berries (Matthews, 1990). The timing of the application of water deficit is crucial in these changes. The pre-véraison and post-véraison water deficit is effective in increasing the UFGT gene expression and anthocyanin concentration in Cabernet Sauvignon berries skin (Castellarin et al., 2007a). Anthocyanin biosynthesis is also under the control of several transcription factors (Deluc et al., 2009; Bogs et al., 2007). The transcript abundance for the
transcription factors (MYBA1 and MYBA2) was increased by water deficit after véraison and was also highly correlated with UFGT transcript abundance during the ripening phase (Deluc
et al., 2009).
4. Importance of seed in wine quality
The main phenolic compounds of red wines are proanthocyanidins (condensed tannins) and anthocyanins. A significant proportion of these polyphenols is extracted from seeds during red wine production (Sun et al., 1999). Approximately 50% of the flavan-3-ols in red wine are derived from grape seed (Singleton et al., 1964). In addition, several mechanisms have described the anthocyanins–tannins condensation reactions producing new complex polyphenolic compounds during winemaking (Liao et al., 1992).
The presence of a higher quantity of seeds in contact with the must during fermentation resulted in wines with a higher content of phenolics, especially catechins and proanthocyanidins. Moreover, the addition of a quantity of supplementary seeds, which doubled the original quantity of seeds in pomace, appeared to stabilize wine color (Kovac et
al., 1995). Additionally, the elimination or the addition of seeds considerably affects the
colour, phenolic compounds composition and astringency of the wine. Generally, eliminating seeds decreases the proanthocyanidin concentration, increases the polymerisation degree and greatly affects their monomeric composition. These changes lead to a clear decrease in body, bitterness and especially astringency (Canals et al., 2008). The taste of the procyanidins, an important quality factor, consists of a mixture of bitterness and astringency. The low molecular weight molecules are predominantly bitter. The higher molecular weight tannins are predominantly astringent. The sensory perception of astringency and bitterness in wine changes in response to the degree of galloylation (DG) and degree of polymerization (DP) of the flavan-3-ols in the wine (Vidal, et al., 2003).
Grape seeds flavonoids are also relevant in human health, due to their antioxidative, anticarcinogenic, antimicrobial and antiallergic proprieties (Hernandez and Prieto Gonzáles, 1999). These compounds are extracted during winemaking and transmitted to the finished wine.
5. Objective
The objective of this investigation was to assess changes in the anthocyanin and tannin concentrations and in the transcripts of anthocyanidin reductase (ANR), Leucoanthocyanidin reductase (LAR1 and LAR2) and UDP-glucose:flavonoid 3-O-glucosyltransferase (UFGT) in seeds of grape berry along its development and under the influence of three water regimes.
6. Material and Methods
6.1.
Field conditions and plant material
Berries were obtained from grafted grapevines (Vitis vinifera cv Aragonez) during the summer season of 2007, grown in a commercial vineyard, Monte Seis Reis in Estremoz, Portugal. Grapevines were subjected to different soil water regimes:
- Full Irrigation (FI): 100% of the evapotranspiration (Etc).
- Regulated Deficit Irrigation (RDI): 50% of Etc, not constant throughout the season. - Non-Irrigated (NI): rain fed treatment.
Berries were randomly sampled from both sides of the vine at four developmental stages (Figure 8):
- Pea size (PS): one week before véraison (collected at 11 Jul); - Véraison (V): 50% coloured grapes (collected at 30 Jul); - Maturation (M): 100% coloured grapes (collected at 13 Aug);
- Full maturation (FM): when berry juice reach a TSS > 20 ºBrix. (collected at 29 Aug).
Pea size (PS) Véraison (V) Maturation (M) Full maturation (FM)
Figure 9. Berries sampled at four developmental stages: pea size, véraison, maturation and full maturation.
At each sampling date a representative sample of 50 bunches was collected from the trial vineyard. A subsample of 20 bunches was taken and was stored at 4ºC. 100 berries were weighed to determine berry weight and the juice extracted to determine total soluble solids (0Brix) and titratable acidity. The second subsample was immediately frozen in liquid
nitrogen, skin and seeds were removed, counted, weighted and ground to a fine powder and stored at -80°C until analyzed.
The average temperature was 22,7o C both on July and August, while the average
precipitation was 0,1 mm and 0,2 mm on July and August, respectively.
6.2.
Leaf water potential (
Ψ
w)
Pre-dawn (Ψpd) leaf water potential were measured around at 5:00 a.m. with a Sholander-type pressure chamber (PMS Instruments Co., Corvallis, OR, USA) in four fully expanded leaves of four different plants per treatments (n=4).
6.3.
Total soluble solids (TSS- Total sugar), titratable acidity (TA) and
berry size measurement
The concentration of total soluble solids (TSS) was assessed from the juice of crushed berries using a manual refractometer (ITREF 32, Instrutemp). The titratable acidity (TA) was assessed according to Office International de la Vigne et du Vin (OIV) procedure. For the determination of the fresh and dry weight of berries, 100 representative berries were selected, weighted and dried in the oven (OV11, Biometra) at 65ºC until weight stabilization.
6.4.
Phenols and anthocyanin extraction
Four subsamples of 10 frozen berries were carefully selected, peeled and the seeds removed and grounded in liquid nitrogen using a mortar and pestle. Phenols extraction was performed according to Boss et al., (1996). Briefly, 1 mL of methanol was added to 500 mg of the ground tissue, lifted overnight at -20ºC, centrifuged at 4ºC during 15 min at 16,100 g. The supernatant was removed and two additional extractions during 60 min were made. The three supernatant were mixed and filtered through 0.45 µm Whatman filters.
6.5.
Total tannin quantification
Total tannin quantification was assessed by the Methyl cellulose precipitable (MCP) tannin assay (Mercurio et al., 2007). The assay is based on subtracting the absorbance values at 280 nm (A280) of solutions both with and without precipitation measured using a
UV-Visible spectrophotometer. By subtracting these two values, the A280 of the MCP tannin in a solution can be determined and then related to epicatechin equivalents.
The assay was performed in seed homogenate extracts. Methyl cellulose solution (0.04% w/v; Sigma M-0387) was prepared in accordance with the manufacturer’s instructions. The assay was performed in 1.5 ml microfuge tubes. Centrifugation was performed at 9.3 g for 5 min. After centrifugation, 300 µL of supernatant from the treatment and control samples was transferred into a Greiner UV star 96 well plate and read using a Power wave XS (Biotek) microplate reader.
Calibration curve was made (-)-epicatechin (Sigma) solutions (10, 25, 50, 75, 100, 150, 200, and 250 mg L-1 epicatechin).
The absorbance of sample was calculated as following:
A280 (tannin) = A280(control) - A280(supernatant) and total tannin concentration was done as following formula:
Tannin concentration (mg/L epicatechin eq.) = a tannin x b DF
a tannin (mg/L epicatechin eq.); calculated from the epicatechin calibration curve b DF (dilution factor); 40 for wine, 10 for grape homogenate extract.
The conversion to mg/g in the homogenate from mg/L in the extract is shown below: Tannin concentration (mg/g) = [Tannin]e x Ve / Wh
[Tannin]e = tannin concentration in extract (mg/L epicatechin eq.) Ve = final volume of extract (L)
Wh = initial weight of homogenate sample (g)
6.6.
Total monomeric anthocyanin quantification
Total monomeric anthocyanin quantification was assessed by the pH-differential method according to Giusti and Wrolstad (2007) modified by T. Serra (personal
communication). Briefly two dilutions of the sample, one with potassium chloride buffer (pH 1.0) and the other with sodium acetate buffer (pH 4.5) were made. After equilibrating dilutions for 15 min, absorbance readings were made against water blank.
The absorbance of the sample (A) was calculated as following
A = (Al vis-max– A700)pH 1.0 – (Al vis-max– A700)pH 4.5 and monomeric anthocyanin pigment concentration was done as following formula:
Monomeric anthocyanin pigment (mg/liter) = (A *MW *DF *1000)/(e*0.919)
where MW is the molecular weight, DF is the dilution factor (for example, if a 0.2 ml sample is diluted to 3 ml, DF = 15), and e is the molar absorptivity.
6.7. Molecular
Analysis
6.7.1. RNA extraction
Total RNA extractions were performed in 1.5 mL tube, using the method of Reid et al (2006). Briefly tissue was ground to a fine powder in liquid nitrogen using a mortar and pestle. The extraction buffer, pre-warmed (65 ºC) (300 mM Tris HCl pH 8.0, 25 mM EDTA, 2M NaCl, 2 % (w/v) CTAB, 2 % (w/v) PVPP, 0.05 % (w/v) spermidine trihydrochloride and 2 % (v/v) β-mercaptoethanol just prior use) was added to powder and shaken vigorously. Tubes were subsequently incubated at 65 ºC with shaking for 10 min. Mixtures were extracted twice with equal volumes of chloroform:isoamyl alcohol (24:1) and centrifuged at 16,1 g for 10 min at 4 ºC. To the supernatant add 100 µl 3M NaOAc (pH 5.2) and 600 µl isopropanol were added, mixed, and stored at -80 ºC for 25 min. Nucleic acid pellets were collected by centrifugation at 16,1 g for 30 min at 4 ºC. The pellet was dissolved in 250-375 µL TE (pH 7.5) and add 94-140 µL of 8 M LiCl and stored at 4 ºC overnight. RNA was pelleted by centrifugation at 16,1g rpm for 30 min at 4 ºC, then washed with 1µl of ice cold 70 % ethanol, air dried, and dissolved in RNase-free water.
6.7.2. RNA purification
Total RNA was purified using an RNeasy® Mini kit (Qiagen) with the addition of an on-column DNAse I digestion (RNase-Free DNase Set; Qiagen).
6.7.3. RNA Quantification and analysis
RNA concentration was determined before and after DNase I digestion using a Nanodrop ND-1000 spectrophotometer (Nanodrop Technologies) in 260/280 nm ratio. RNA integrity was evaluated by 1% (w/v) agarose gel electrophoresis.
6.7.4. cDNA synthesis (RT-PCR)
cDNAs were synthesised using the Omniscript® Reverse Transcription kit (Qiagen) according to the manufacture’s instructions. The cDNA was prepared from 1000 ng of total RNA. The reverse-transcription reaction mixture comprised the following components in final concentrations: buffer RT 1x concentrated, 0.5 mM of each dNTP, 1 µM oligo-dT primer, 0.5 units of RNase inhibitor, 0.2 units of Omniscript Reverse Transcriptase and template RNA calculated for 1000 nanogramas in 20 µL final volume reaction. cDNA was synthesised at 37 ºC for 60 min and the cDNA stored at -80 ºC.
6.7.5. Primer Design
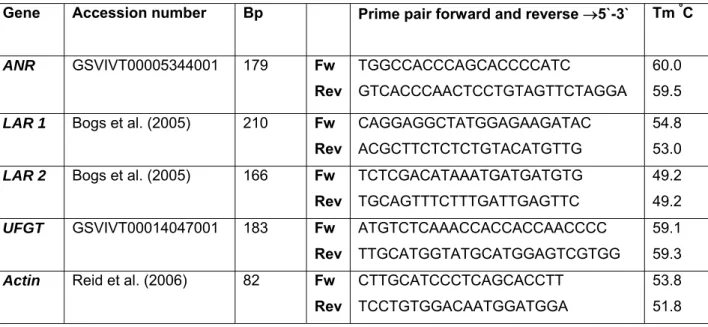
For PCR amplification, primers for LAR1, LAR2 and actin were retrieved from the literature, and primes for ANR and UFGT were designed based on a complete coding sequence from Vitis genoscope reports (Table 1).
Table 1. Primers used for PCR amplification to ANR, LAR1, LAR2, UFGT and Actin
Gene Accession number Bp Prime pair forward and reverse →5`-3` Tm ºC ANR GSVIVT00005344001 179 Fw Rev TGGCCACCCAGCACCCCATC GTCACCCAACTCCTGTAGTTCTAGGA 60.0 59.5
LAR 1 Bogs et al. (2005) 210 Fw Rev
CAGGAGGCTATGGAGAAGATAC ACGCTTCTCTCTGTACATGTTG
54.8 53.0 LAR 2 Bogs et al. (2005) 166 Fw
Rev TCTCGACATAAATGATGATGTG TGCAGTTTCTTTGATTGAGTTC 49.2 49.2 UFGT GSVIVT00014047001 183 Fw Rev ATGTCTCAAACCACCACCAACCCC TTGCATGGTATGCATGGAGTCGTGG 59.1 59.3 Actin Reid et al. (2006) 82 Fw
Rev
CTTGCATCCCTCAGCACCTT TCCTGTGGACAATGGATGGA
53.8 51.8
6.7.6. Quantitative RT-PCR
The cDNAs were diluted 1:50 with RNase free-water. Aliquots of the same cDNA sample were used with all primers set for qRT-PCR. Reactions were done in 20 µl containing 250 nm of gene-specific primers and master mix iQ SYBR Green Supermix. The detection of PCR product was monitored by measuring the fluorescence after each extension step caused by the binding of SYBR green dye to dsDNA.
Quantitative RT-PCR was performed in the iQ5 2.0 Standard Edition (Bio-Rad), sequence detection system in a 96-well reaction plate, using the following parameters:
Table 2. Reaction conditions for thermal cycling in qPCR.
Cycle Repeat Step Dwell Set point End Temperature
1. Denaturation 1 1 3:00 95,0 2. Annealing 40 1 0:10 95,0 2 0:30 57,0 3 0:30 72,0 3. Elongation (Melt curve) 41 1 0:30 55,0 95,0
The results were normalized by using the Cts (threshold cycles) obtained for actin (endogenous control) present in the same plate. CT (threshold cycle) is the intersection between an amplification curve and a threshold line.
For actin normalization, we utilized the equation:
ΔCt = Ct (target gene) - Ct (actin)
To quantify the effect of water deficit on gene expression, we utilized the equation: ∆∆CT = [∆CT (water stress treatment) - ∆CT (FI)]stage x
where x corresponded to stage of development.
Relative changes of the target gene in the different stages of seed development and different treatments relative to actin (control endogenous) was determined by the equation:
2
-ΔCtThe fold change of the target gene between treatments relative to FI (treatment control) in different stages of seed development was determined by the equation:
6.8. Statistical
analysis
All values of tannins and anthocyanins were based on four replicate samples, and values of mRNA expression were based on three biological and three technical replicates. The results are the mean values ± standard error (SE). Data were evaluated by analysis of variance (ANOVA) with SPSS 12.0 (SPSS, Inc., Chicago, USA). When the F test was significant, means were separated by Duncan's multiple range test (p ≤ 0.05).
7. Results
7.1.
Predawn leaf water potencial (Ψ
pd)
Predawn leaf water potential (Ψpd) was monitored during the grapevine reproductive
season to characterize the vine water status (Figure 10). Significant differences in the vine water status were observed between FI, RDI and NI vines in some stages (véraison and maturation). Ψpd of FI and RDI vines was about -0.2 MPa at pea-size and véraison stages.
Ψpd of NI was the lowest as compared with the other treatments at pea size and véraison; at
those stages there was no statistically significant differences in Ψpd between FI and RDI. At
maturation, Ψpd of RDI and NI were similar and reached about -0.4 MPa. The three
treatments showed a decline of Ψpd at full maturation (FM) as a result of stop in irrigation one
week before full maturation stage.
Figure 10. Predawn leaf water potential Aragonez grapevine measured at pea size, véraison, maturation e full maturation in FI, RDI, and NI vines. Stop irrigation of RDI; Stop
irrigation of FI.
Asterisk indicate significant differences at p ≤ 0.05 by Duncan's tests (n=4).
2007 -1,2 -1 -0,8 -0,6 -0,4 -0,2 0 PS V M FM L eaf P re-d awn w at er p o ten ti al FI RDI NI
*
*
7.2. Total soluble sugar (TSS), titratable acidity (TA) and berry size
measurements
The fresh and dry weight of the berry increased along development in all treatments with differences between treatments observed only at full maturation. RDI and FI showed the higher grape berry fresh weight at full maturation as compared with NI treatment. However, RDI induced a greater berry dry weight at full maturation (Figure 11).
The results obtained for the chemical composition of grape berries during the developmental stages are represented in Figure 12. Total soluble sugar (TSS), expressed in degree Brix, increased along berry development (Figure 12). In general, FI showed a more rapid sugar accumulation until maturation stage (M). However, at full maturation no differences were observed between treatments.
In the same way, irrigated vines (FI and RDI) tend to accelerate the acid breakdown at véraison (Figure 12). However, no differences were observed in the titratable acidity between the different water supply treatments at full maturation.
PS V M FM 0,0 0,4 0,8 1,2 1,6 2,0 2,4 2,8 3,2
Fresh and dry weight
gram/ber
ry
FI RDI NI
Figure 11. Fresh and dry weight (gram) of the berry along development.
Fresh weight
PS V M FM 4 8 12 16 20 24 28 32 36 4 8 12 16 20 24 28 32 36
Brix and tartaric acid
g tartari c aci d L -1 o Br ix FI RDI NI
Figure 12. Total soluble sugar content (TSS. Brix), and titratable acidity (TA) expressed in g tartaric acid L -1 of berries along development.
7.3. Berry seeds
In general, no significant effect of treatment on the number of seeds per berry was recorded. Nevertheless, at full maturation the number of seed/berry was higher in RDI than in FI and NI (Table 3). The trend of seed development was significantly different between treatments since véraison (Figure 13). RDI and NI showed the higher seed fresh weight at
véraison and maturation stages. FI showed a faster weight loos as compared with RDI and
NI. At full maturation, seed weight was higher in FI than in RDI and NI.
0
Brix TA
Table 3. Seed number per berry at full maturation
* Different letters indicate significant differences at p ≤ 0.05 by Duncan's tests. Data are mean ± SE (n = 4).
nºseed / Berry* FI 2,15 ± 0,23 ab RDI 2,80 ± 0,21 b NI 1,93 ± 0,25 a PS V M FM 40 44 48 52 56 60
64
Seed fresh weight
mg FW
FI RDI NI
Figure 13. Seed fresh weight at pea size, véraison, maturation and full maturation in the three water treatment (FI, RDI and NI).
Asterisk indicate significant differences at p ≤ 0.05 by Duncan's tests (n=4).
*
*
7.4. Total tannin concentration
Concentrations of total tannin in seeds of cv. Aragonez during berry development and under the different water regimes are shown in Figure 14.
At véraison all treatments showed an increase in tannin concentration per g FW (Figure 14A) and also per seed (Figure 14B). After véraison, total tannin concentration decreased in all treatments.
At pea size RDI was significantly lower than FI. At maturation RDI was higher than NI and FI. At full maturation, irrigated vines (FI and RDI) showed the highest tannin concentration.
Figure 14. Total tannin content in grape seeds (A) per gram of fresh weight (mg epicatechin eq./ g FW). (B) per seed basis (mg epicatechin eq./ seed). Different letters indicate significant differences at
p ≤ 0.05 by Duncan's tests. Means ± SE (n=4).
A B b a ab a a a a b a b b a b a ab a a a a b a b b a
7.5. Total monomeric anthocyanin
It is the first time to our knowledge that anthocyanin were detected in grapevine seeds. In NI treatment it was detected already at véraison (Figure 15). Seeds from FI and RDI treatments apparently synthesized anthocyanin only after véraison. At full maturation, NI was significantly higher than FI, when the results are expressed in mg/g fresh weight. However, no differences were detected in monomeric anthocyanin per seed.
Figure 15. Monomeric anthocyanin content (A) per gram of fresh weight (mg malvidin eq / g FW) (B) per seed basis (µg malvidin eq/seed).
Asterisk indicate significant differences at p ≤ 0.05 by Duncan's tests. Means ± SE (n=4).
*
*
*
A
7.6. Changes in ANR, LAR and UFGT expression during seed
development
The mRNA levels of anthocyanidin reductase (ANR) and both isoforms of leucoanthocyanidin reductase (LAR1 and LAR2), and UDP-glucose:flavonoid 3-O-glucosyltransferase (UFGT) were determined by real-time quantitative-PCR during seed development. Transcripts encoding for proanthocyanidins enzymes (ANR and LAR1, LAR2) and for anthocyanidin enzyme (UDP-glucose:flavonoid 3-O-glucosyltransferase (UFGT)) showed different expression patterns during seed development and depending on irrigation treatment .
Results are presented in two different ways: analysis of the target gene in fold change relative to actin (endogenous control) and analysis of the differences between stressed treatments (RDI and NI) relative to non stressed (FI) treatment.
7.6.1. ANR expression in vine seeds of the different
irrigation treatments
Accumulation of ANR mRNA was detected in seeds since pea size stage. The expression trend of ANR transcript was the same in the three treatments. Analysis of the target gene in fold change relative to actin (endogenous control) decreased toward véraison (Figure 16A) in irrigation treatments and reached low values at full maturation stage. Nevertheless, some significant differences between treatments were detected at several stages in the mRNA expression. At véraison, NI showed a significant higher ANR expression than watered vines (RDI and FI). At maturation, FI and RDI seeds showed a significant higher ANR expression than NI.
The comparative study of the expression level of ANR transcripts in the seeds of the three treatments relative to FI (control) (Figure 16B), showed that differences between treatments were only significant at véraison and at maturation. At véraison NI showed higher values than watered vines. At maturation, ANR expression was down regulated in NI when compared to control (FI treatment). At full maturation no significant differences were detected.
Figure 16. Transcript levels of ANR in seeds during berry development. (A) Gene expression is expressed relative to actin in each sample. (B) Differential mRNA expression of ANR, in seed under RDI and NI. Results are expressed by fold change (actin-normalized) relative to FI treatment. Asterisk
indicate significant differences at p ≤ 0.05 by Duncan's tests. Values are mean ±SE (n=3). * * a a a aa b b b a b a a B A
7.6.2. LAR1 expression in vine seeds of the different
irrigation treatments
In general, LAR1 transcripts were expressed at low values (<0.1). No differences were observed between treatments at pea size and véraison stages in the analysis of the target gene in fold change relative to actin (Figure 17A), but at maturation, FI peaked and exhibited a higher expression than water stressed vines (RDI and NI) and then declined at full maturation. RDI and NI showed the same expression trend along development.
The comparative analysis between treatments for LAR1 gene expression relative to FI control treatment (Figure 17B) showed that treatments exhibited the same expression level at pea size. At véraison no significant differences were observed among treatments. At maturation, the LAR1 gene expression in RDI and NI was down-regulated relative to control (FI). At full maturation, RDI exhibited a statistically higher expression than NI and FI (control).
Figure 17. Transcript levels of LAR1 in seeds during berry development. (A) Gene expression is expressed relative to actin in each sample. (B) Differential mRNA expression of LAR1, in seed under RDI and NI. Results are expressed by fold change (actin-normalized) relative to FI treatment. Asterisk
indicate significant differences at p ≤ 0.05 by Duncan's tests. Values are mean ±SE (n=3).
a a a a a b a a a c b * A B a
7.6.3. LAR2 expression in vine seeds of the different
irrigation treatments
The transcript expression in the analysis of the target gene in fold change relative to actin, LAR2 trend was similar among treatments, but the expression level was close to zero (Figure 18A). In spite of this small expression, FI and RDI exhibited a higher expression than NI at véraison and maturation.
The comparative analysis of LAR2 transcriptional expression between treatments relative to FI (control) demonstrated that in NI vines the expression was down-regulated at maturation being statistically different at this stage (Figure 18B).
Figure 18. Transcript levels of LAR2 in seeds during berry development. (A) Gene expression is expressed relative to actin in each sample. (B) Differential mRNA expression of LAR2, in seed under RDI and NI. Results are expressed by fold change (actin-normalized) relative to FI treatment. Asterisk indicate significant differences at p ≤ 0.05 by Duncan's tests. Values are mean ± SE (n=3).
aaa a a a b ab a b b a * * A B