PEDIA
TRIC GASTROENTEROLOGY
GROWTH EVALUATION IN INFANTS
WITH NEONATAL CHOLESTASIS
Camila Carbone
PRADO
1, Roberto José Negrão
NOGUEIRA
1,
Antônio de Azevedo
BARROS-FILHO
1, 2, Elizete Aparecida Lomazi da
COSTA-PINTO
1, 2and
Gabriel
HESSEL
1, 2This study was conducted by the 1 Department of Pediatrics and 2 Center for Investigation in Pediatrics (CIPED), School of Medical Sciences, State University of
Campinas – UNICAMP, Campinas, SP, Brazil.
Address for correspondence: Dr. Gabriel Hessel – Departamento de Pediatria – FCM/UNICAMP – Caixa Postal 6111 – 13083-970 – Campinas, SP, Brazil. INTRODUCTION
Nutritional defi ciencies are common in infants with chronic hepatic diseases, especially when cholestasis is present and its onset occurs in the fi rst year of life(3, 4, 10, 21). The
frequency of malnutrition is approximately 50%, particularly in infants with established cirrhosis(3). The pathogenesis of
weight-height defi cit is well characterized in infants and includes(5, 15): 1. reduced food intake; 2. impaired digestion
and absorption of nutrients; 3. increased caloric needs. In neonatal cholestasis, the liver retains substances that are normally excreted in the bile, reducing biliary salts excretion in the proximal intestine. Low intraluminal concentration results in malabsorption of fat-soluble vitamins and food lipids, especially long-chain triglycerides that are essentially bile-dependent for absorption(8, 14). In patients with biliary
atresia, there is a 29% increase in energy expenditure(16). At the time these infants underwent liver transplantation, undernutrition was regarded as the worst prognosis factor(13, 17). To our knowledge, although there are no data
available in the literature, clinical observation has indicated that there are quantitative differences regarding nutritional status and growth defi cit for both types of neonatal cholestasis, intra and extrahepatic. Nutritional and growth assessment may prove useful in establishing adequate nutritional support for each group of patients. Nutritional support is often underestimated but it has essential value in a child with liver disease, since it not only improves the general condition but also prepares the child for a future transplant(12).
Therefore, the objective of this study was to evaluate the nutritional status and growth pattern in infants with intrahepatic cholestasis (IHC) and extrahepatic cholestasis (EHC). ABSTRACT – Background - Chronic liver diseases in childhood often cause undernutrition and growth failure. To our knowledge,
growth parameters in infants with neonatal cholestasis are not available. Aim - To evaluate the nutritional status and growth pattern in infants with intrahepatic cholestasis and extrahepatic cholestasis. Patients and methods - One hundred forty-four patients with neonatal cholestasis were followed up at the Pediatric Gastroenterology Service of the Teaching Hospital, State University of Campinas, Campinas, SP, Brazil, in a 23-year period, from 1980 to 2003. The records of these patients were reviewed and patients were classifi ed into two groups, according to their anatomical diagnosis: patients with intrahepatic cholestasis - group 1, and patients with extrahepatic cholestasis - group 2. Records of weight and height measurements were collected at 4 age stages of growth, in the fi rst year of life: 1) from the time of the fi rst medical visit to the age of 4 months (T1); 2) from the 5th to the 7th month (T2); 3) from the 8th to the 10th month (T3); and 4) from the 11th to the 13th month (T4). The weight-by-age and height-by-age Z-scores were calculated for each patient at each stage. In order for the patient to be included in the study it was necessary to have the weight and/or height measurements at the 4 stages. Analyses of variance and Tukey’s tests were used for statistical analysis. Repeated measurement analyses of variance of the weight-by-age Z-score were performed in a 60-patient sample, including 29 patients from group 1 and 31 patients from group 2. The height-by-age data of 33 patients were recorded, 15 from group 1 and 18 from group 2. Results - The mean weight-by-age Z-scores of group 1 patients at the 4 age stages were: T1=-1.54; T2=-1.40; T3=-0.94; T4=-0.78. There was a signifi cant difference between T2 X T3 and T1 X T4. The weight-by-age Z-scores for group 2 patients were :T1=-1.04; T2=-1.67; T3=-1.93 and T4=-1.77, with a signifi cant difference between T1 X T2 and T1 X T4. The mean weight-by-age Z-scores also showed a signifi cant difference between group 1 and group 2 at stages T3 and T4. The mean height-by-age Z-scores at the four stages in group 1 were: T1=-1.27; T2=-1.16; T3=-0.92 and T4=-0.22, with a signifi cant difference between T3XT4 and T1XT4. The scores for group 2 patients were: T1=-0.93; T2=-1.89; T3=-2.26 and T4=-2.03, with a signifi cant difference between T1XT2 and T1XT4. The mean height-by-age Z-scores also showed a signifi cant difference between group 1 and group 2 at T3 and T4. Conclusion - The weight and height differences between the groups became signifi cant from the 3rd measurement onward, with the most substantial defi cit found in the extrahepatic group. In this group, there is evidence that the onset of weight and height defi cit occurs between the fi rst and second evaluation stages.
HEADINGS – Cholestasis, extrahepatic. Cholestasis, intrahepatic. Nutritional status. Anthropometry. Infant, newborn.
PATIENTS AND METHODS
The records of all infants with intra and extrahepatic cholestasis assisted in the period between 1980 and 2003 were reviewed. Information on ponderal progression was obtained from the records of 60 patients (29 with IHC and 31 with EHC) in four periods of the 1st year of life. Among these 60 patient records, 33 had all of the height measurements in the same four periods. It was not possible to include more patients because of the irregularly made visits or because the patient died.
Collected data included identifi cation of cholestasis etiology and anthropometrical measurements. Measurements of weight and height were recorded in four age stages: T1 – at the fi rst medical visit, which occurred up to the age of 4 months; T2 – values recorded at a consultation that occurred between the 5th and the 7th month of
life; T3 - values recorded at a consultation that occurred between the 8th and the 10th month and T4 – fourth age stage values recorded at
a consultation that occurred between the 11th and the 13th month of
life. The weight-by-age (w/a), height-by-age (h/a) and weight for height (w/h) Z-scores for every patient were calculated at each age stage by the computer software SISCRES(11) having as references
the National Center for Health Statistic’s curves (NCHS)(9). The
patients received nutritional guidance regarding a normocaloric, low-fat diet with medium-chain triglyceride supplementation. They were also prescribed liposoluble vitamins (A, D and E) for oral intake and parenteral administration of vitamin K. The repeated measurement analyses of variance and Tukey’s test were used to explain the variability of Z-scores in relation to group and time factors(6). The study was previously approved by the Research
Ethics Committee of the School of Medical Sciences – UNICAMP, Campinas, SP, Brazil.
RESULTS
Table 1 shows the causes of neonatal cholestasis in groups 1 and 2. As regards IHC, the most frequent causes had an infectious or idiopathic origin, while the main cause for EHC was extrahepatic biliary duct atresia (EHBDA).
Table 2 and Figure 1 show the mean Z-score values for weight-by-age; Table 3 and Figure 2 show height-by-age and Table 4 and Figure 3 show weight-for-height indexes in groups 1 and 2, at four stages of assessment.
Group 1
(n = 29 patients ) Nº %
Cytomegalovirus 10 34.5
Syphilis 2 6.9
Toxoplasmosis 1 3.4
Metabolic disorders 2 6.9
Hypoplasia of the intrahepatic biliary ducts 2 6.9
Idiopathic 12 41.4
Group 2 (n = 31 patients)
Nº %
Extrahepatic biliary duct atresia 28 90.3
Choledochal cyst 3 9.7
TABLE 1 – Etiology of neonatal cholestasis in group 1 (intrahepatic cholestasis = IHC) and group 2 (extrahepatic cholestasis = EHC)
Cholestasis
Intrahepatic (n=29) Extrahepatic (n=31) Tukey (Intra x Extra)
T1 -1.54±1.33 -1.04±0.84 P> 0.05
T2 -1.40±1.61 -1.67±1.06 P> 0.05
T3 -0.94±1.62 -1.93±1.33 P< 0.05
T4 -0.78±1.76 -1.77±1.41 P< 0.05
TABLE 2 – Comparison between age stages of Z-score for weight-by-age in patients of group 1 (intrahepatic cholestasis) and group 2 (extrahepatic cholestasis)
1. ANOVA for repeated measurements: P<0.05 both for intrahepatic and for extrahepatic cholestasis 2. Tukey test:
a. Intrahepatic: T2 x T3, P = 0.0009; T1 x T4, P = 0.0036; T1 x T2 and T3 x T4, P>0.05 b. Extrahepatic: T1 x T2, P = 0.0002; T1 x T4, P = 0.0010; T2 x T3 and T3 x T4, P>0.05
3. T1: appointment up to the 4th month of life; T2: appointment between the 5th and the 7th month; T3: appointment
Cholestasis
Intrahepatic (n=15) Extrahepatic (n=18) Tukey
(Intra x Extra)
T1 -1.27±1.26 -0.93±1.29 P> 0.05
T2 -1.16±1.68 -1.89±1.19 P> 0.05
T3 -0.92±1.65 -2.26±1.56 P< 0.05
T4 -0.22±1.96 -2.03±1.40 P< 0.05
TABLE 3 – Comparison between age stages of Z-score for height-by-age in patients of group 1 (intrahepatic cholestasis) and group 2 (extrahepatic cholestasis)
1. ANOVA for repeated measurements: P<0.05 both for intrahepatic and for extrahepatic cholestasis 2. Tukey test:
a.Intrahepatic: T3 x T4, P = 0.0382; T1 x T4, P = 0.0390; T1 x T2 and T2 x T3, P> 0.05 b. Extrahepatic: T1 x T2, P = 0.0004; T1 x T4, P = 0.0010; T2 x T3 and T3 x T4, P> 0.05
3. T1: appointment up to the 4th month of life; T2: appointment between the 5th and the 7th month; T3: appointment
1 2 3 4
-3,00 -2,25 -1,50 -0,75 0,00 0,75
Intrahepatic Extrahepatic
Z
-S
cor
e
for
w
ei
g
ht
Consultations
FIGURE 1 – Evolution of the mean Z-score for weight-by-age at four assessment stages of patients with intrahepatic and extrahepatic cholestasis (the vertical bars indicate the Standard-deviations and are represented in a single direction)
between the 8th and the 10th month; T4: appointment between the 11th and the 13th month
W/a Z-scores, which were negative in group 1, decreased over a period of time; the same pattern was observed in h/a Z-scores. On the other hand, in group 2, w/a Z-scores, which were also negative, increased over a period of time. The same pattern was observed in h/a Z-scores.
The analysis of group and time interaction effects revealed signifi cant differences. No signifi cant differences were found between the groups at the fi rst and second age stages, but there were signifi cant differences at the third stage, which progressed into the fourth. Group 1 presented signifi cant differences between the values obtained at the second and third stages and between the values at the fi rst and fourth stages, whereas group 2 presented signifi cant differences between the fi rst and second as well as between the fi rst and fourth age stages.
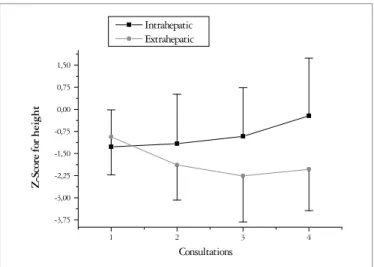
The sample available for recording h/a and for analysis of variance included 15 patients from group 1 and 18 patients from Group 2. Signifi cant differences were observed regarding analysis of the effect of time as well as the interaction between group and time. Figure 2 shows an increased difference between the groups after the third age stage, similarly to w/a Z scores.
When time was compared for each group, signifi cant differences were observed between the third and fourth stages and between the fi rst and fourth stages in group 1, whereas group 2 presented signifi cant differences between the fi rst and second and between the fi rst and fourth age stages.
The statistical analysis has not shown any signifi cant difference between the weight/height indexes in any of the studied effects.
DISCUSSION
This study presents the growth pattern in infants with neonatal cholestasis during the 1st year of life. A signifi cant difference was observed between the groups in relation to weight and height after the third age stage. The defi cit increased in infants with extrahepatic cholestasis. Such infants present normal weight at birth, not only as observed in this study but also reported in the literature by ALAGILLE(1). The onset of
clinical symptoms of obstructive jaundice, choluria and fecal hypocholia occurred during the 1st month of life and most patients were 2 or 3 months old when brought for diagnostic investigation. The onset of cholestasis led to a reduction in intraluminal biliary salts, which was strongly marked in group 2. This reduction impaired digestion and absorption of long-chain triglycerides (LCT) fi nally resulting in reduced utilization
(7, 19). However, at this fi rst age stage, no evidence of malnutrition
was observed in these patients, as the Z-scores for weight and height were slightly higher than the Z-scores of patients in group 1, but with no signifi cant difference. The explanation for these results may be:
1. the birth weights of patients in group 1, which were lower than those in group 2, were considered close to low birth weight values and recovered despite the LCT digestion problem; 2. the patients in group 2 were potentially more prone to be affected
concerning LCT digestion and absorption, but the consequences were still not evident at the time of assessment.
FIGURE 2 – Evolution of the mean Z-score for height-by-age at four assessment stages of patients with intrahepatic and extrahepatic cholestasis (the vertical bars indicate the Standard-deviations and are represented in a single direction)
1 2 3 4
-3,75 -3,00 -2,25 -1,50 -0,75 0,00 0,75 1,50
Intrahepatic Extrahepatic
Z
-S
co
re
fo
r
height
Consultations
Extrahepatic (n=31) Tukey
(Intra x Extra)
T1 -0.24±0.82 -0.49 ± 1.26 P> 0.05
T2 -0.33±0.98 -0.32 ± 1.26 P> 0.05
T3 -0.22±0.83 -0.36 ± 1.11 P> 0.05
T4 -0.33±1.11 -0.23 ± 0.86 P> 0.05
TABLE 4 – Comparison between age stages of Z-score for weight-for-height in patients of group 1 (intrahepatic cholestasis) and group 2 (extrahepatic cholestasis)
1. ANOVA for repeated measurements: P<0.05 both for intrahepatic and for extrahepatic cholestasis 2. Tukey test:
a. Intrahepatic: T1 x T2, T2 x T3, T3 x T4, T1 x T4, P> 0.05 b. Extrahepatic: T1 x T2, T2 x T3, T3 x T4, T1 x T4, P> 0.05
3. T1: appointment up to the 4th month of life; T2: appointment between the 5th and the 7th month; T3: appointment
FIGURE 3 – Evolution of the mean Z-score for weight-by-height at four assessment stages of patients with intrahepatic and extrahepatic cholestasis (the vertical bars indicate the Standard-deviations and are represented in a single direction)
1 2 3 4
-2,0 -1,5 -1,0 -0,5 0,0 0,5 1,0
Intrahepatic Extrahepatic
Z
-S
co
re
for weight/height
Consultas
The second weight and height measurement was subsequently performed (between the 5th and 7th month of life). The w/a and h/a Z-scores showed no signifi cant difference between the groups. The patients in group 2 (84%) underwent surgery, usually during the 3rd month of life. If the catabolism present in this type of surgery interfered in the results of the second measurement, reestablishment of biliary fl ow, on the other hand, could promote better LCT absorption and increased caloric uptake. Another signifi cant result is that, although there was no difference between the groups, a signifi cant difference was observed within the EHC group between the fi rst and second measurements, with an expressive decline in weight and height Z-scores. These results can be discussed as follows:
1. the Kasai procedure is a major surgery that may lead to intense and long-lasting catabolism;
2. prolonged postoperative fasting is recommended, due to anastomosis in the jejunal segment; in most cases parenteral nutrition is not used;
3. the surgery is not entirely successful. Large studies show that the results are good in about 1/3 of the cases, while 2/3 of the patients continue with jaundice(2), which means reduced fat
digestion. SHIGA et al.(20), conducted a study to evaluate the
nutritional status of patients during the postoperative period of biliary atresia. They found that those patients whose total bilirubin levels were above 2 mg/100mL had smaller muscle
area in the arms and lower prealbumin levels when compared to patients whose bilirubin levels were lower than 2 mg/100 mL. The third assessment is similar to the fourth. A signifi cant difference was observed between the groups regarding the w/a and h/a Z-scores. At this stage, the cholestatic condition in most infants in group 1 had been resolved and LCT digestion and absorption were adequate. Consequently, the w/a and h/a Z-scores increased. On the other hand, during the third assessment, patients in group 2 continued showing a decline in Z-scores, this stabilized at the fourth assessment. This may be due to the previously mentioned fact that most patients maintained cholestasis, as revealed by the direct increase in bilirubin and glutamyltransferase. Another explanation could be that, during this period, liver dysfunction begins in those cases where the Kasai surgery was partially successful or unsuccessful, giving rise to other conditions such as anorexia and increased basal metabolism that maintain a status of malnutrition(4, 15, 16, 18).
An assessment of the nutritional status of patients with neonatal cholestasis, especially EHC carriers, is extremely important. This study has demonstrated that there are weight and height defi cits in patients with extrahepatic cholestasis and has identifi ed the stage in which defi cits appear. Based on these results, a rigorous nutritional support therapy is suggested for these patients.
Prado CC, Nogueira RJN, Barros-Filho AA, Costa-Pinto EAL, Hessel G. Antropometria em crianças com colestase neonatal. Arq Gastroenterol. 2006;43(4):305-9.
RESUMO – Racional - As doenças hepáticas crônicas na infância freqüentemente levam à desnutrição e ao défi cit de crescimento, sem haver referência de um padrão defi nido para colestase neonatal. Objetivo - Avaliar o estado nutricional e o padrão de crescimento em crianças com colestase intra-hepática e colestase extra-hepática. Material e métodos - Foram revistos os prontuários de 144 pacientes com colestase neonatal atendidos no Serviço de Gastroenterologia Pediátrica do Hospital de Clínicas da UNICAMP, Campinas, SP, durante o período de 1980 a 2003 e de acordo com o diagnóstico anatômico, classifi cados em dois grupos: grupo 1, pacientes com colestase intra-hepática e grupo 2, com colestase extra-hepática. Os valores de peso e estatura foram obtidos em quatro momentos: 1º) Na primeira consulta realizada até o 4º mês de vida, 2º) entre o 5º e o 7º mês, 3º) entre o 8º e o 10º mês e 4º) entre o 11º e 13º mês. Para cada paciente foi realizado o cálculo do Z-escore em relação ao peso para a idade e estatura para a idade nos momentos 1 a 4. Para o paciente ser incluído no estudo, era necessário ter as medidas de peso e/ou estatura nos quatro estágios. A estatística empregada foi a análise de variância e o teste de Tukey. Para análise de variância com medidas repetidas quanto ao escore-Z de peso para a idade, a amostra utilizada foi de 60 pacientes, sendo 29 do grupo 1 e 31 do grupo 2. Para estatura, a amostra utilizada foi de 33 pacientes, sendo 15 do grupo 1 e 18 do grupo 2.
Resultados - As médias dos escores-Z de peso para a idade nos quatro momentos da avaliação para os pacientes do grupo 1 foram: T1 =-1.54;
T2 = -1.40; T3 = -0,94; T4 = -0.78, havendo diferença signifi cante entre T2×T3 e entre T1×T4. Para os pacientes do grupo 2 foram: T1 = -1.04; T2 = -1.67; T3 =-1.93 e T4 = -1.77, havendo diferença signifi cante entre T1×T2 e T1×T4. Houve também diferença signifi cante entre as médias dos escores-Z de peso para a idade entre o grupo 1 e o grupo 2 no T3 e no T4. As médias dos escores-Z de estatura para idade nos quatro momentos da avaliação para os pacientes do grupo 1 foram: T1 = -1.27; T2 = -1.16; T3 = -0.92 e T4 = -0.22, havendo diferença signifi cante entre T3XT4 e T1XT4. Para os pacientes do grupo 2 foram: T1 = -0.93; T2 = -1.89; T3 = -2.26 e T4 = -2.03, havendo diferença signifi cante entre T1×T2 e T1×T4. Houve também diferença signifi cante entre as médias dos escores-Z de estatura para a idade entre o grupo 1 e o grupo 2 no T3 e no T4. Conclusões - As diferenças de peso e estatura entre os grupos tornaram-se signifi cantes a partir da terceira medida, sendo o défi cit mais acentuado no grupo extra-hepático. Nesse grupo, há evidência de que o agravo pôndero-estatural se instala entre o primeiro e o segundo momento de avaliação.
REFERENCES
1. Alagille D. Cholestasis in the fi rst three months of life. Prog Liver Dis. 1979;6:471-85. 2. Alagille D. Prolonged obstructive jaundice including calculous and noncalculous gall
bladder condition. In: Roy CC, Silverman A, Alagille D, editors. Pediatric clinical gastroenterology. 4th ed. St. Louis: Mosby; c1995. p.603–52.
3. Beath S, Pearmain G, Kelly D, McMaster P, Mayer A, Buckels J. Liver transplantation in babies and children with extrahepatic biliary atresia. J Pediatr Surg. 1993;28:1044-7.
4. Cardoso AL, Porta G, Vieira MA, Carraza FR. Caracterização nutricional de crianças com colestase crônica. J Pediatr (Rio J). 1997;73:43-50.
5. Chin SE, Shepherd RW, Thomas BJ, Cleghorn GJ, Patric MK, Wilcox JA, Ong TH, Lynch SV, Strong R. The nature of malnutrition in children with end-stage liver disease awaiting orthotopic liver transplantation. Am J Clin Nutr. 1992;56:164-8. 6. Daniel WW. Biostatistics: a foundation for analysis in the health sciences. 2nd ed.
New York: John Wiley: c1978. p.215-23.
7. Fomon SJ. Nutrition of normal children. St. Louis: Mosby; c1993. p.147-75. 8. Glasgow JFT, Hamilton JR, Sass-Kortsak A. Fat absorption in congenital obstructive
liver disease. Arch Dis Child. 1973;48:601-7.
9. Hamill PV, Drizd TA, Johnson CL, Reed RB, Roche AF, Moore WM. Physical growth: National Center for Health Statistics percentiles. Am J Clin Nutr. 1979;32:607-29. 10. Kaufman SS, Murray ND, Wood RP, Shaw BW, Vanderhoof JA. Nutritional support
for the infant with extrahepatic biliary atresia. J Pediatr. 1987;110:679-86. 11. Morcillo AM, Lemos-Marini SHV. SISCRES – Sistema de análise do crescimento.
Versão Windows, 2002.
12. Moreno LA, Gottrand F, Hoden S. Improvement of nutritional status in cholestatic children with supplemental nocturnal enteral nutrition. J Pediatr Gastroenterol Nutr. 1991;12:213-6.
13. Moukarzel AA, Najm I, Vargas J, McDiarmid SV, Busuttil RW, Ament ME. Effect of nutritional status on outcome of orthotopic liver transplantation in pediatric patients. Transplant Proc. 1990;22:1560-3.
14. Mowat AP. Hepatitis and cholestasis in infancy: intrahepatic disorders. In: Mowat AP. Liver disorders in childhood. 3rd ed. Oxford: Butterworth-Heinemann; 1994. p.44-78.
15. Novy MA, Schwarz KB. Nutritional considerations and management of the child with liver disease. Nutrition. 1997;13:177-84.
16. Pierro A, Koletzko B, Carnielli V, Superina RA, Roberts EA, Filler RM, Smith J, Heim T. Resting energy expenditure is increased in infants and children with extrahepatic biliary atresia. J Pediatr Surg. 1989;24:534-8.
17. Rodeck B, Melter M, Kardorff R, Hoyer PF, Ringe B, Burdelski M, Oldhafer KJ, Pichlmayr R, Brodehl J. Liver Transplantation in children with chronic end stage liver disease: factors infl uencing survival after transplantation. Transplantation. 1996;62:1071-6.
18. Schneeweiss B, Graninger W, Ferenci P, Eichinger S, Grimm G, Schneider B, Laggner A, Lenz K, Kleinberger G. Energy metabolism in patients with acute and chronic liver disease. Hepatology. 1990;11:387-93.
19. Shiau YF. Lipid digestion and absorption. In: Johnson LR, editor. Physiology of the gastrointestinal tract. 2nd ed. New York: Raven Press; c1987. v.2, p.1527-49. 20. Shiga C, Ohi R, Chiba T, Nio M, Endo N, Mito S, Hino M. Assessment of nutritional status
of postoperative patients with biliary atresia. Tohoku J Exp Med. 1997;181:217-23. 21. Sokol RJ, Stall C. Anthropometric evaluation of infants with chronic liver disease.
Am J Clin Nutr. 1990;52:203–8.