Role of apoptotic regulators in the protective
effect of acetic acid against ethanol - induced
cell death in
Saccharomyces cerevisiae
Dissertação de Mestrado
Mestrado em Bioquímica Aplicada
Trabalho efectuado sob a orientação de
Professora Doutora Manuela Côrte-Real
Trabalho efectuado sob a co-orientação de
Professora Doutora Maria João Sousa
DECLARAÇÃO
Nome: Natália Cristina Alves Rocha
Endereço eletrónico: [email protected] Telefone: 924374066
Nº de identificação civil: 13793505
Título da Tese de Mestrado: Role of apoptotic regulators in the protective effect of acetic acid against ethanol - induced cell death inSaccharomyces cerevisiae
Orientadora: Professora Doutora Manuela Côrte-Real Co-orientadora: Professora Doutora Maria João Sousa
Instituição de acolhimento: Centro de Biologia Molecular e Ambiental (CBMA) Ano de conclusão: 2013
Designação do mestrado: Mestrado em Bioquímica Aplicada
1. É AUTORIZADA A REPRODUÇÃO INTEGRAL DESTA TESE, APENAS PARA EFEITOS DE INVESTIGAÇÃO MEDIANTE DECLARAÇÃO ESCRITA DO INTERESSADO QUE A TAL SE COMPROMETE.
Universidade do Minho, 31 de Outubro de 2013
__________________________________________ (Natália Cristina Alves Rocha)
Agradecimentos
Durante a prossecução deste Mestrado muitas foram as pessoas que, direta ou indiretamente, de forma abnegada e autêntica, me ajudaram e apoiaram. A elas o meu profundo reconhecimento e sincero agradecimento:
Às minhas Orientadoras, Professora Doutora Manuela Côrte-Real e à Professora Doutora Maria João Sousa, por todo apoio prestado e pela excelente orientação científica. Já mais esquecerei toda a dedicação e a oportunidade que me proporcionaram.
À Susana, por toda a simpatia e disponibilidade.
À Minha Família, em especial aos meus Pais e irmãs, um enorme obrigada por acreditarem sempre em mim e naquilo que faço. Obrigada pela paciência, espero muito em breve poder recompensar-vos.
Aos meus amigos de infância, Mara, Ana, Thiago, Maria, Sérgio e Simão, obrigada por todos os momentos bem passados, espero que façam sempre parte da minha história.
Às pessoas que fizeram com que o último ano fosse excecional, Elisabete, Rita Pacheco, Rita Cunha, Vera, Selma, Tânia, Lisandra, Helena, Luísa, Raquel, Pedro, Ruben, Cristina, Sara, Flávio, D. Isabel, Sr. José, um GRANDE obrigada. Todos vocês foram maravilhosos, mesmo com o vosso trabalho tinham sempre um bocadinho para ajudar e uma palavra de ânimo quando tudo parecia mal.
Ao Dário e ao António, por todo o apoio prestado. Sem vocês não era a mesma coisa .
Ao Ricardo pela paciência, pela visão positiva das coisas e por todo o amor!
Por fim, gostaria de agradecer ao Centro de Biologia Molecular e Ambiental, ao programa FEDER através do POFC–COMPETE e ao projeto da FCT PEst- C/BIA/UI4050/2011, FCOMP-01-0124-FEDER-007047 e PTDC/AGR- ALI/102608/2008 pelo financiamento deste trabalho.
Abstract
iii
Abstract
Ethanol is a well-know end product of alcoholic fermentation carried by Saccharomyces cerevisiae. At relatively low concentrations it is an inhibitor of yeast growth, while, high ethanol concentrations reduces cell viability (Birch and Walker, 2000). During fermentation, acetic acid produced by yeast metabolism may accumulate in growth medium and enhance ethanol toxicity (Gibsonet al.,2007). By contrast, studies conducted in our laboratory have shown thatS. cerevisiae cells exposed simultaneously to toxic concentrations of ethanol and low concentrations of acetic acid displayed a higher survival than cells treated only with ethanol (Vieira et al., unpublished results). Later, Trindade showed that Hog1p and Fps1p, involved in acetic acid resistance, do not have a role in the protective effect of acetic acid seen by Vieira (Trindade, 2009). Subsequently, it was also shown that the osmolyte trehalose, the heat shock protein Hsp12p, the MAP kinase Slt2/MPK1 and functional mitochondria play a role in the protection by the undissociated form of acetic acid against ethanol induced cytotoxicity (Afonso, 2011).
With the present master thesis we intended to further understand how acetic acid protects against ethanol-induced cytotoxicity, determining the role of known apoptotic regulators in this protection. We also intended to characterize the death of cells exposed to toxic concentrations of ethanol since this knowledge is important to dissect the role of acetic acid in its inhibition.
This study showed that the deletion in CYC3 or ATP2, ATP10 and NUC1 abolish and decrease, respectively, the protection of acetic acid against loss of cell viability, loss of plasma membrane integrity and the accumulation of superoxide anion, induced by ethanol. Death induced by ethanol was associated with typical markers of apoptosis but also of necrosis. In particular caspase activation and exposure of phosphatidylserine was detected mainly in cells with compromised plasma membrane, but also HMGB1/Nhp6A translocates from the nucleus to the cytosol in response to ethanol. Moreover, the absence of known apoptotic regulatory proteins abrogate (atp2∆, atp10∆, cyc3∆, por1∆, cpr3∆ and yca1∆ mutants), exacerbate (aif1∆, nuc1∆, and cyc1∆cyc7∆mutants) or have no effect (pep4∆mutant) in ethanol induced cell death. Altogether the results obtained with the mutants phenotypes and the characterization of cell death markers indicate that ethanol triggers a regulated cell death process that shares features typical of both apoptosis and necrosis. Whether
the necrotic features reflect a programmed necrosis or a secondary necrosis of apoptotic cells committed to death in response to ethanol, requires further studies.
Resumo
v
Resumo
O etanol é um produto final bem conhecido da fermentação alcoólica conduzida por Saccharomyces cerevisiae. Em concentrações relativamente baixas é um inibidor do crescimento da levedura, enquanto em concentrações elevadas induz perda da viabilidade celular (Birch e Walker, 2000). Durante a fermentação, o ácido acético produzido pelo metabolismo da levedura pode acumular-se no meio extracelular e aumentar a toxicidade de etanol (Gibsonet al.,2007). Por outro lado, estudos realizados no nosso laboratório mostraram que células de S. cerevisiae simultaneamente expostas a concentrações tóxicas de etanol e baixas concentrações de ácido acético exibiam uma maior sobrevivência do que aquelas tratadas apenas com etanol. (Vieira et. al., resultados não publicados). Mais tarde, Trindade mostrou que as proteínas Hog1p e Fps1p, envolvidas na resistência ao ácido acético, não apresentam um papel no efeito protetor do ácido acético observado por Vieira (Trindade, 2009). Posteriormente, mostrou-se que o osmólito trealose, a proteína de choque térmico Hsp12p, a MAP quinase Slt2/MPK1 e mitocôndrias funcionais têm um papel na proteção da forma não dissociada do ácido acético contra citotoxicidade induzida por etanol (Afonso, 2011).
Com a presente dissertação de mestrado pretendeu-se compreender melhor como o ácido acético protege contra a citotoxicidade induzida por etanol, determinando o papel de reguladores conhecidos da apoptose nesta proteção. Também se pretendeu caracterizar a morte de células expostas a concentrações tóxicas de etanol uma vez que este conhecimento é importante para dissecar o papel do ácido acético, na sua inibição.
Este estudo mostrou que a ausência dos genes CYC3 ou ATP2, ATP10 eNUC1 elimina e diminui, respetivamente, a proteção do ácido acético contra a perda induzida pelo etanol da viabilidade celular, da integridade da membrana plasmática e da acumulação de anião superóxido. A morte induzida pelo etanol foi acompanhada de marcadores celulares típicos de apoptose, mas também de necrose. Em particular foi detetada ativação de caspases e exposição de fosfatidilserina principalmente em células com a membrana plasmática comprometida, mas também a translocação do HMGB1/Nhp6A do núcleo para o citosol em resposta ao etanol. Adicionalmente, a ausência de reguladores apoptóticos reduziram (nos mutantes atp2∆, atp10∆, cyc3∆, por1∆, cpr3∆ e yca1∆), potenciaram (nos mutantes aif1∆, nuc1∆, e cyc1∆cyc7∆) ou não afetaram a
sobrevivência celular (no mutante pep4∆) em resposta ao etanol. Os resultados respeitantes aos fenótipos dos mutantes estudados e à caracterização dos marcadores de morte celular indicam que o etanol induz uma morte regulada que partilha características típicas de apoptose e necrose. Se as características de necrose refletem uma necrose programada ou uma necrose secundária de células que desencadearam um processo de morte apoptótico, requer mais estudos no futuro.
Index vii Index Agradecimentos... ii Abstract ...iii Resumo ...v Index ... vii Abbreviations...ix INTRODUCTION... 1
Yeast: biotechnology relevance and applications in fundamental and applied research ... 2
Stress in yeast ... 3
Ethanol stress... 4
Acetic acid stress... 7
Cell Death ... 10
Apoptosis ... 10
Necrosis... 13
Necrosis in yeast ... 15
AIM... 18
MATERIALS AND METHODS ... 20
Yeast Strains ... 21
Media and Growth Conditions ... 21
Cell viability assays... 21
Flow cytometric assays ... 22
Assessment of plasma membrane integrity ... 22
Assessment of superoxide anion intracellular accumulation ... 22
Assessment of mitochondrial membrane potential... 22
Assessment of exposure of phosphatidylserine in the outer surface of the plasma membrane ... 23
Assessment of the translocation of Nhp6Ap from the nucleus into the cytosol by fluorescence microscopy... 24
Assessment of the translocation of Nhp6Ap from the nucleus into the cytosol by flow cytometry... 24
Reproducibility and statistical analysis of the results ... 24
RESULTS ... 25
Acetic acid protects cells from ethanol-induced cell death inSaccharomyces cerevisiae... 26
Protective effect of acetic acid against ethanol stress: the role of known yeast apoptotic regulators. 28 Involvement of the ATP synthase subunits Atp2p and Atp10p ... 28
Involvement of the heme lyase Cyc3p and of the cytochromecisoforms Cyc1p and Cyc7p... 30
Involvement of the yeast voltage dependent anion channel Por1p, ADP/ATP carrier proteins Aac1-3p and of cyclophilin Cpr3p ... 32
Involvement of the yeast ENDO G Nuc1p, Apoptosis Inducing factor Aif1p, metacaspase Yca1p, and the vacuolar protease Pep4p... 34
Does ethanol induce a programmed necrosis inSaccharomyces cerevisiae?... 37
Mitochondrial membrane potential... 39
Detection of caspase activation ... 40
Exposure of phosphatidylserine... 41
Nucleus-cytosolic translocation of Nhp6Ap ... 43
DISCUSSION AND FUTURE PERPECTIVES... 46
Abbreviations
ix
Abbreviations AA – Acetic Acid
ABC – ATP – Binding Casset ADP – Adenosine Diphosphate AIF – Apoptosis Inducing Factor AK – Adenylate Kinase
AnnV – Annexin V
ANT – Adenine nucleotide transcolator ATP – Adenosine Triphosphate
CCHL – Cytochrome C the Heme Lyase CFU – Colony Forming Units
CS – Citrate Synthase
Cyt c –Cytochrome c
DAPI – Diamino – 2 – phenyl – indole dihydrochloride
DHE – Dihydroethidium
DIOC6– 3,3’ – Dihexyloxacarbocyanine Iodide
DNA – Deoxyribonucleic Acid Endo G – Endonuclease G Et – Ethanol
FITC – Fluoroisothiocyanate
gTME – global Transcription Machinery HEPES - 4-(2-Hydroxyethyl )piperazine-1-ethanesulfonic acid
HMGB1 – High Mobility Group Box 1 HPSs – Heat Shock Proteins
HSFs – Heat Shock factors H2O2– Hydrogen Peroxide
IAP – Inhibitors of Apoptosis Proteins MAP Kinases – Mitogen – Activated Protein Kinases
MES – N – Moroholino Ethanesulfonic Acid min – minutes
MMP – Mitochondrial Membrane Permeabilization
MOMP – Mitochondrial Outer membrane Permeabilization
MPTP – Mitochondrial permeability transition pore
N.s. – no significant
NAD+- Nicotinamide Adenine Dinucleotide
NCCD – Nomenclature Committee on Cell Death
Omi/HtrA2 – High Temperature Requirement Proteins A2
OMM – Outer Mitochondrial Membrane PARP1 – Poly ADP – ribose Polymerase PBS - Phosphate Buffered Saline PCD – Programmed Cell Death pH – Potential oh Hydrogen PHD – Plant Homeo Domain PI – Propidium Iodide PS – Phosphatidylserine
RIP1 – Receptor-interacting serine Protein 1 RNA – Ribonucleic Acid
ROS – Reactive Oxygen Species rpm – rotations per minute
SC URA – Synthetic Complete Uracil SD – Standard Deviation
STRE – Transcriptional factor interact with stress response element
TCA – Trichloroacetic
TNFR1 – Tumor Necrosis Factor Receptor 1 TUNEL – Terminal dUTP Nick – End Labeling UFAs – Unsaturated Fatty Acids
VDAC1 – Voltage Dependent Anion – selective Channel
YPD – Yeast Peptone Dextrose YPDA - Yeast Peptone Dextrose Agar
Introduction
2
Yeast: biotechnology relevance and applications in fundamental and applied research
Yeasts are eukaryotic unicellular fungi with similar characteristics to higher eukaryotic cells. These microorganisms nowadays are relevant in both biotechnology, with important economic impact in several fields, and in fundamental research (Sousa et al., 2011). Its simplicity, receptivity to genetic manipulation and traceability make it a powerful tool to elucidate the mechanisms underlying the fundamental cellular processes of eukaryotes and their modes of regulation (Walker, 1998).
Saccharomyces cerevisiae,the most commercially exploited yeast species, has been traditionally used in the brewing, baking and wine-making industries (Muthaiyan and Ricke, 2009). With the advances in the biotechnological field it has been gaining importance in different industries, including the chemical and food industries, as well as in the health and biological, biomedical and environmental fields (Walker, 1998). This yeast species is widely used for the production of macromolecular cellular components such as lipids, proteins including enzymes, and vitamins (Bigelis, 1985; Stewart and Russell, 1985). With a long history of industrial applications, S. cerevisiae has been the subject of various studies of microbiology (Anderson, 1992). S.cerevisiaehas also been used as a model for physiological studies on the effects of osmotic and oxidative stress induced by ethanol and weak acids among other compounds (Braun et al., 2006). The completion of the DNA sequence of the yeast S. cerevisiae genome has made possible research approaches that allow analysis of cellular processes at a whole-genome scale. Many of the proteins encoded by yeast bear a striking primary sequence and functional homology to corresponding proteins found in higher eukaryotic organisms. This similarity accelerated the description of the function of numerous mammalian gene products and contributed to the deciphering of the basic physiological processes of eukaryotic cells. Yeast cells, due to their ability to express functionally proteins of therapeutic interest, have also become an important tool in the drug discovery process (Pauschet al.,2001).
The presence of an apoptotic regulatory network in yeast that encompasses many of the crucial events that occur in mammalian cells stimulated several studies in disease related proteins that have no homologues in this organism and created a new research field with the so-called humanized yeast systems, providing cell-based assays to discover novel medicinal compounds (Mager and Winderickx, 2005). More recently it was recognized that yeast, like mammalian cells, can also dye by programmed necrosis, which enlarge the possibilities to exploit this cellular model to
understand different forms of regulated cell death in higher eukaryotes. Moreover, the knowledge of cell death processes in yeast and of the mechanisms underlying their regulation allows to improve the performance of the fermentative yeast with relevant impact on biotechnological applications.
Stress in yeast
Yeasts require specific internal conditions for optimal growth and functioning, thus fluctuations in available nutrients, temperature, osmolarity and acidity of their environment and the presence of noxious agents such as radiation and toxic chemicals which represent a stress to yeasts (Gasch et al., 2000). Stress can also be imposed by the host defense mechanism on the case of pathogenic yeasts (Moye-Rowley, 2003).
In order to minimize the effects of stress on the survival and proliferation of cells different molecular responses can be induced. An adaptive response can result from exposure to low levels of a stress and may result in transient resistance when the levels of the same stress increase. This adaptation to stress can also lead to increased resistance (or cross-protection) to other types of stress (Jamieson 1992; Leeet al.,1995; Moradas-Ferreira and Costa, 2000). The adaptive response requires new protein synthesis, indicating that changes in gene expression are fundamental. The phenomenon of cross-protection suggests either that different stress conditions can activate similar defense mechanisms or that there is a general stress response that can confer a basic level of protection (Chenet al.,2003).
Studies at the whole genome scale in the yeastS. cerevisiaehave revealed that 10% to 14% of all genes are induced or repressed in response to a wide range of stresses. Induced genes are involved in various processes, including carbohydrate metabolism, detoxification of reactive oxygen species (ROS), protein folding and degradation, vacuolar and mitochondrial functions, autophagy, and metabolite transport. Repressed genes are generally involved in energy consuming and growth-related processes, including RNA processing, transcription and translation, and biosynthesis of ribosomes and nucleotides (Caustonet al.,2001; Gaschet al., 2000).
The major yeast stress-response mechanisms that protect cells against various types of stress are: accumulation of trehalose, synthesis of molecular chaperones, antioxidant proteins and hydrophylins, accumulation of compatible solutes, and changes in the composition of the plasma
Introduction
4
membrane. A specific mechanism to protect cells from different stresses have also been described, for instance, expression of aquaporins has been described as a protection mechanism against freeze stress (Tangheet al., 2002).
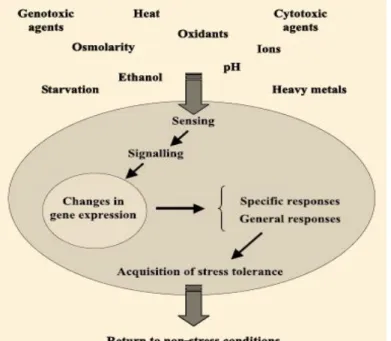
Figure 1 - Schematic representation of
cell events triggered by environmental changes and leading to adaptation to stress (adapted from Salvador et al., 2009)
Ethanol stress
One of the most common stresses that yeast cells encounter during fermentation is the exposure to increasing concentration of ethanol in the medium (Ding et al., 2009). At relatively low concentrations ethanol is an inhibitor of yeast growth, inhibiting cell division, decreasing cell volume and specific growth rate, while high ethanol concentrations reduce cell vitality and increase cell death (Birch and Walker, 2000). Ethanol also influences cell metabolism and macromolecular biosynthesis by inducing the production of heat shock-like proteins, lowering the rate of RNA and protein accumulation, enhancing the frequency of petite mutations, altering metabolism, denaturing intracellular proteins and glycolytic enzymes and reducing their activity (Hu et al., 2007). The main sites for ethanol effects in yeast are the cellular membranes (Mishra and Prasad, 1989), hydrophobic and hydrophilic proteins and the endoplasmic reticulum (Walker, 1998).
In order to circumvent the damage caused by the increasing concentration of ethanol, the yeast cells have created mechanisms of defense (Ding et al., 2009). Thus, the yeast cells can change the plasma membrane composition for antagonizing fluidization and to improve its stability, specifically it has been show that the levels of unsaturated fatty acids (UFAs) (You et al.,2003) and ergosterol (Daum et al., 1998; Swan and Watson, 1998) increase in response to the high concentration of ethanol. The addition of some types of amino acids (Hu et al.,2005; Takagi et al.,
2005) and inositol (Kelley et al., 1998) has also been described as a way to improve tolerance to ethanol, probably increasing the stability of the membrane.
Accumulation of trehalose and induction of heat shock proteins (HSPs), factors that stabilize and/or repair denatured proteins in yeast cells, appear to have a role in the cells ability to tolerate alcohol (Swan and Watson, 1998; Vianna et al., 2008). Some candidate proteins involved in the expression of stress related genes like the zinc finger proteins (MacPherson et al., 2006), and the recently reported alcohol sensitive ring/PHD finger 1 protein (Asr1p) (Betz et al.,2004) also play a role in ethanol tolerance in S. cerevisiae. The global transcription machinery engineering (gTME) technology has also been used to reprogram gene transcription and then improve glucose/ethanol tolerance of yeast cells (Alperet al.,2006).
Introduction
6
Table 1 – Factors related with ethanol tolerance of S. cerevisiae and their function during ethanol stress (adapted from Dinget al.,2009).
Factors involved in ethanol
tolerance Function References
Composition of yeast plasma membrane
Unsaturated fatty acids (UFAs) Ergosterol
Amino acids
Inositol and H+-ATPase
Increase membrane stability and antagonize the fluidity caused by ethanol
Youet al. (2003); Xiaoet al.(2008); Ingram (1990) and Weber and de Bont (1996). Inoue et al. (2000) and Swan and Watson (1998).
Huet al.(2005) and Takagiet al.(2005). Cartwright et al. (1987); Furukawa et al.
(2004); and Fernandes and Sa-Correira (2003).
Factors that stabilize or repair denatured proteins
Trehalose
Heat shock proteins (HSPs)
Stabilize or repair denatured proteins caused by ethanol
Gomeset al. (2002); Ogawa et al.(2000); Barry and Gawrisch (1995); and Lucero et al.(1997).
Craig et al. (1993); Seymour and Pipper (1999); Quanet al. (2004); and Pipperet al.
(1994, 1997).
Transcriptional factor interact with stress response element (STRE)
Heat shock factors (HSFs)
Alcohol sensitive ring/PHD finger 1 gene (Asr1)
Some others genes
Schuller et al. (1994); Marchler et al. (1993); Moskvinaet al.(1998); Watanabeet al.(2007); Gorner et al.(1998, 2002) and Hirataet al.(2003).
Hahnet al.(2004); Wu (1995); Takemoriet al.(2006); Sorger and Pelham (1988); Guo
et al.(2008); and Liuet al.(2008). Daulny et al. (2008); Betz et al. (2004); Izawa et al. (2006); Aravind et al (2003); Capili et al. (2001); Kubota et al. (2004); and van Voorstet al.(2006).
Acetic acid stress
Acetic acid is a normal by-product of the alcoholic fermentation carried out by S. cerevisiae. It can also be produced by contaminating lactic and acetic acid bacteria (Du Toit and Lambrechts, 2002; Pinto et al., 1989; Vilela-Moura et al., 2011) or it can be originated from acid-catalyzed hydrolysis of lignocelluloses (Lee et al., 1999; Maiorella et al., 1983). This weak acid can have negative effects in industrial fermentation processes such as wine production (Garay-Arroyo et al., 2004; Vilela-Moura et al.,2010), or lignocellulosic fermentations for bioethanol production (Klinke et al.,2004; Liu and Blaschek, 2010; Miraet al.,2010b) underpinning its biotechnological relevance.
In most strains of S. cerevisiae, acetic acid is not metabolized by glucose-repressed yeast cells and enters the cell in the non-dissociated form by simple diffusion (Casal et al., 1996). Inside the cell, the acid dissociates and, if the extracellular pH is lower than the intracellular pH, this will lead to an intracellular acidification and to the accumulation of its dissociated form (which depends on the pH gradient), affecting cellular metabolism at various levels (Casal et al., 1996; Guldfeldt and Arneborg, 1998; Leão and van Uden, 1986; Pampulha and Loureiro, 1989). Intracellular acidification caused by acetic acid leads to trafficking defects, hampering vesicle exit from the endosome to the vacuole (Brett et al., 2005). Thus, the undissociated form of this acid causes toxic effects that result in the inhibition of growth and fermentation rates (Pampulha and Loureiro, 1989; Phowchinda et al., 1995). S. cerevisiaecells are normally able to grow on acetic acid medium (pH 5.5), which is used as the sole carbon and energy source. Under this condition the weak acid is partially found in the dissociated form and acetate is transported across the plasma membrane through an electroneutral proton symport transporter. Two genes have been associated with acetate transporter ADY2 (Casal et al., 1996; Paiva et al., 2004) and JEN1, encoding a general monocarboxylate transporter (Casalet al.,1999). Acetate taken up by cells is converted to acetyl-CoA by one of either peroxisomal or cytosolic acetyl-CoA synthetases. Acetyl-CoA is then consumed in the glyoxylate shunt or oxidized in mitochondria through the tricarboxylic acid cycle (Lee et al., 2011; Vilela-Mouraet al., 2008).Under certain conditions, acetic acid is also responsible for inducing two types of cell death, high- and low-enthalpy (Pinto et al., 1989). Exponential-phase cultures of S. cerevisiae treated with high concentrations of acetic acid (120-200 mM), exhibited a necrotic
Introduction
8
phenotype, while cultures treated with low doses (20-80 mM) evidenced an apoptotic programmed cell death (PCD) process (Ludovicoet al., 2001).
Most common mechanisms of yeast adaptation to stress involve plasma membrane transporters and the proton-translocating ATPase. The plasma membrane transporter Pdr12p, a member of ATP-binding cassette (ABC) transporter family, is strongly induced by weak acids, but this response seems not to be very important for acetic acid resistance (Piper et al., 1998). In order to confer resistance to stress, Pdr12p may bind acid anions incorporated in the inner leaflet of the plasma membrane and transport them to the opposite side of the membrane in order promote their transport out of the cell (Weber and de Bont, 1996). In the absence of stress by weak acids, the carrier is not active (Holyoaket al.,2000).
The plasma membrane H+-ATPase, an ATP-driven proton efflux pump has also been shown
to be important in the stress response caused by weak acids (Serrano, 1991). Holyoak and collaborators have observed that the low expression of PMA1 gene, encoding the H +-ATPase,
increases the cell sensitivity to weak acids (Holyoak et al.,1996).
The transcription factor Haa1p is required for a rapid yeast adaptation to acetic acid. The protective effect exerted by Haa1ptowards weak acids decreased steeply with the increase of the liposolubility of the weak acid, being maximal for acetic acid (Fernandes et al., 2005). This transcription factor, directly or indirectly regulate most of the acetic acid induced gene expression, being the main player in reprogramming yeast genomic expression in the adaptation to growth in the presence of acetic acid stress (Mira et al., 2011). The transcription of nine Haa1p-target genes, seem to have an important role in the adaptation of yeast to stress caused by weak acids. Those having more prominent effect were TPO2, TPO3, SAP30, HRK1 (Mira et al., 2011) and YGP1 (Fernandeset al.,2005).
Other transcription factors such as, Msn2p/Msn4p, War1p, Rim101p and Pdr1p/Pdr3p are known as mediators in response to stress caused by weak acids (Miraet al.,2010a).
The stress caused by acetic acid, at low pH leads to activation of two mitogen- activated protein (MAP) kinases, Hog1p and Slt2p. Hog1p-dependent phosphorylation of aquaglyceroporin Fps1p results in its ubiquitination, endocytosis, and final degradation in the vacuole (Mollapouret al., 2009). The Hog1p-directed destabilization of Fps1p decreases acetic acid intracellular accumulation, leading to resistance to acetic acid (Piper, 2011; Zhanget al.,2011).
Protection against acetic acid-induced stress, a condition known to induce a severe amino acid-starvation response, was also associated with reduced levels of the translation factors eIF4A, eEF1A, eEF2 and eEF3A (Almeidaet al.,2009).
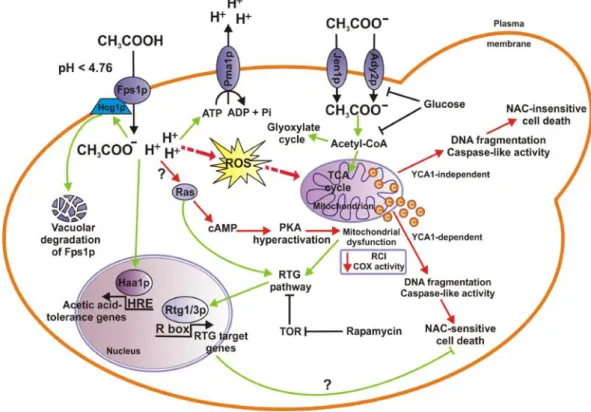
Figure 2 - Mechanisms of acetic acid stress response inS. cerevisiae cells. When yeast cells utilize acetic acid
as the sole carbon source, acetate anion enters cells through a monocarboxylate proton symporter (potentially by Jen1p or Ady2p monocarboxylate transporter) where it is converted into acetyl-CoA, which enters the TCA or the glyoxylate cycle. Both acetate transport and metabolism are inhibited by glucose. At low pH (pKa= 4.76), in the presence of glucose, acetic acid enters cells in its undissociated form by facilitated diffusion or through the Fps1p aquaglyceroporin channel. Once inside the cell the more neutral cytosolic pH causes its dissociation into anions and protons. Concomitant cytoplasmic acidification by protons induces the activation of the Pma1p, a plasma membrane ATPase that pumps protons out of the cell. Stress induce by acetic acid may activate Hog1p, a MAP-kinase involved in phosphorylation and subsequent ubiquitination, endocytosis, and final vacuolar degradation of Fps1p, and transcription factor Haa1p enabling cells to adapt to acetic acid (adapted from Giannattasioet al.,2013).
Introduction
10
Cell Death
Cell death has many forms and shapes. Cell death research encompasses not only the study of apoptosis, autophagic cell death, necrosis and other modes of cellular demise, but also the role these phenomena play in physiological and pathological processes including development, aging, and disease (Fulda et al., 2009). In the last decades, cell death attracted growing interest of the scientific community, mostly because of its crucial role in tissue homeostasis and development of multicellular organisms (Baehrecke, 2002). Since the first descriptions of programmed cell death mechanisms, several attempts have been made to classify cell death subroutines based on morphological and biochemical characteristics (Galluzziet al.,2012).
In 2009, the Nomenclature Committee on Cell Death (NCCD) proposed a set of recommendations for the definition of distinct cell death morphologies and for the appropriate use of cell death-related terminology, including ‘apoptosis’, ‘necrosis’ and ‘mitotic catastrophe’ (Kroemeret al.,2009). Recently, NCCD proposed a functional classification of cell death subroutines that applies to both in vitro and in vivo settings and includes extrinsic apoptosis, caspasedependent or -independent intrinsic apoptosis, regulated necrosis, autophagic cell death and mitotic catastrophe (Galluzziet al.,2012).
Apoptosis
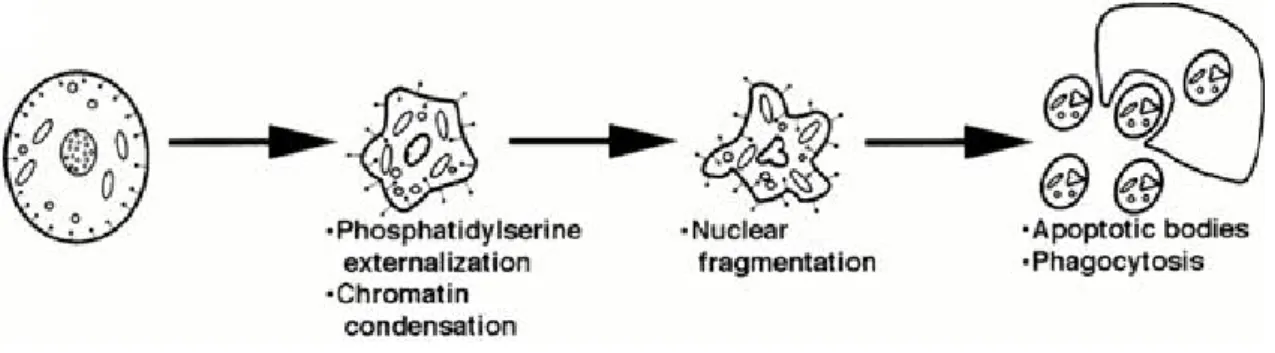
Apoptosis is a programmed cell death process that is important for many biological functions. This process occurs normally during development and aging and as a homeostatic mechanism to maintain cell populations in tissues. It also occurs as a defense mechanism in immune reactions or when cells are damaged by disease or noxious agents (Norbury and Hickson, 2001). Apoptosis is a type of cell death with its own characteristics, such as exposure of phosphatidylserine from the inner leaflet to the external leaflet of the plasma membrane, chromatin condensation, internucleosomal DNA fragmentation, cell volume decrease and finally formation of apoptotic bodies which are subsequently removed by phagocytes without causing an inflammatory response (Lawen, 2003).
The mechanisms of apoptosis are highly complex and sophisticated, involving an energy-dependent cascade of molecular events. It is known that there are two main apoptotic pathways: the extrinsic or death receptor pathway and the intrinsic or mitochondrial pathway (Igney and Krammer, 2002). These pathways converge on the same terminal or execution pathway and are initiated by the cleavage of caspase-3 (Martinvalet et al., 2005). Briefly, the apoptotic process consists of 3 consecutive phases: trigger by extracellular or intracellular stimuli, execution by activation of intracellular proteases and elimination of dead cells by engulfment of cell debris by neighboring cells or macrophages (Saikumaret al., 1999).
Figure 3 – Schematic representation of the morphological features of apoptosis (adapted by Jones, 1997).
It has become clear that, among other cellular processes, the apoptotic core machinery is conserved in yeast, which brings great advantages for the discovery of basic mechanisms that may also be extended to human apoptosis (Gutiérrez et al., 2010). In 1997 yeast apoptosis was firstly observed (Madeo et al., 1997) and since then multiple yeast orthologues of crucial mammalian apoptotic proteins have been identified, such as caspases (Madeoet al.,2002), AIF (Wissing et al., 2004), Omi/HtrA2 (Fahrenkrog et al., 2004), IAP (Walter et al., 2006) and Endo G (Büttner et al., 2007).
Over the years, different agents capable of inducing apoptosis in yeast were identified, such as acetic acid, ethanol, hydrogen peroxide, sorbitol or glucose, sodium chloride, among others (Pereiraet al., 2008). In order to detect apoptosis in yeast, various tests have been developed; they include determination of viability [by colony forming units], ROS accumulation [by dihydroethidium
Introduction
12
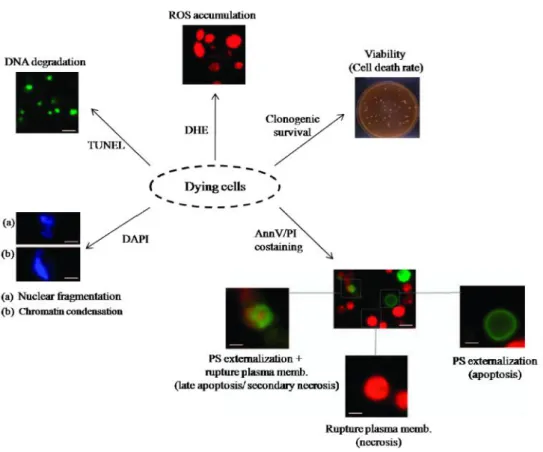
(DHE) staining], DNA fragmentation [using TUNEL (Terminal dUTP nick-end labeling) assay], exposure of phosphatidylserine [by Annexin V (AnnV) staining], chromatin condensation [by DAPI (4,6-diamino-2-phenyl-indole dihydrochloride) staining] and cell integrity [by Propidium iodide (PI) staining] (Fig. 4) (Gutiérrezet al.,2010).
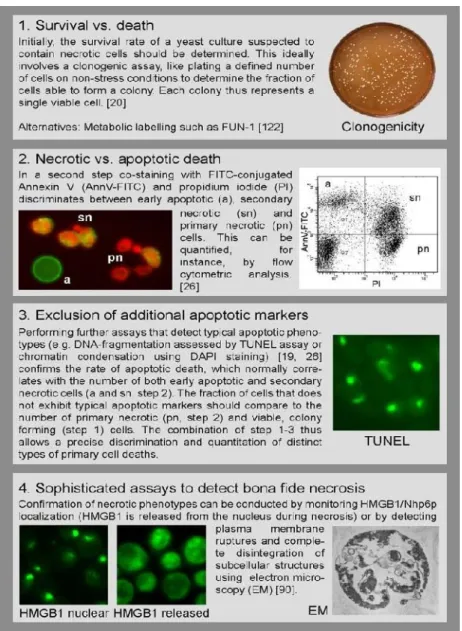
Figure 4 - Assays routinely used in the field of yeast PCD. Co-staining of annexinV (AnnV) and propidium
iodide (PI) allows discrimination between early apoptotic cells exhibiting phosphatidylserine (PS) externalization (Ann+, PI-), cells showing rupture plasma membrane indicate of primary necrosis (Ann-, PI+) and late
apoptotic/secondary necrotic cells, which show both PS exposition and membrane permeability (Ann+/PI+).
DNA fragmentation is measured using the TUNEL test accumulation of ROS is usually measured using dihydroethidium (DHE). Nuclear fragmentation and chromatin condensation can be observed upon DAPI staining (adapted from Gutiérrezet al.,2010).
Introduction
12
(DHE) staining], DNA fragmentation [using TUNEL (Terminal dUTP nick-end labeling) assay], exposure of phosphatidylserine [by Annexin V (AnnV) staining], chromatin condensation [by DAPI (4,6-diamino-2-phenyl-indole dihydrochloride) staining] and cell integrity [by Propidium iodide (PI) staining] (Fig. 4) (Gutiérrezet al.,2010).
Figure 4 - Assays routinely used in the field of yeast PCD. Co-staining of annexinV (AnnV) and propidium
iodide (PI) allows discrimination between early apoptotic cells exhibiting phosphatidylserine (PS) externalization (Ann+, PI-), cells showing rupture plasma membrane indicate of primary necrosis (Ann-, PI+) and late
apoptotic/secondary necrotic cells, which show both PS exposition and membrane permeability (Ann+/PI+).
DNA fragmentation is measured using the TUNEL test accumulation of ROS is usually measured using dihydroethidium (DHE). Nuclear fragmentation and chromatin condensation can be observed upon DAPI staining (adapted from Gutiérrezet al.,2010).
Necrosis
Necrosis occurs generally in response to physico-chemical stress, including hypoxia, ischemia, hypoglycemia, extreme temperature changes and nutrient deprivation (Nicotera et al., 1999) and is morphologically characterized by a gain in cell volume (oncosis), swelling of organelles, plasma membrane rupture and subsequent loss of intracellular contents (Kroemer et al.,2009). It is known that this process triggers various cellular phenomena, such as uncoupling of the respiratory chain, production of ROS, nitroxidative stress by nitric oxide or similar compounds, and mitochondrial membrane permeabilization (MMP) often controlled by cyclophilin D, lysosomal changes, ROS production by Fenton reactions, lysosomal membrane permeabilization, nuclear changes (hyperactivation of PARP-1 and concomitant hydrolysis of NAD+), lipid degradation (following the
activation of phospholipases, lipoxygenases and sphingomyelinases), increase in the cytosolic concentration of calcium (Ca2+) that result in mitochondrial overload and activation of noncaspase
proteases (e.g., calpains and cathepsins) (Nicoteraet al.,1999).
The necrotic death was long considered an unregulated process. However, it is increasingly clear that this process does not occur by accident and that there are multiple signaling pathways implied in it (Vanlangenakker et al., 2008). Thus, the term programmed necrosis has emerged to identify a cell death process characterized by rapid loss of plasma membrane integrity prior to the exposure of a phagocytic signal. Studies on this issue have shown that there are several stimuli capable of triggering regulated necrosis, including alkylating DNA damage, excitotoxins and the ligation of death receptors (He et al., 2009; Zhang et al., 2009), for example, TNFR1, and Toll-like receptors (Vanlangenakkeret al.,2008).
This new concept of necrosis, as a regulated entity, represents a paradigm shift in biology and medicine, may shed new light on disease pathogenesis and provide opportunities for therapeutics not thought possible in the recent past (Kunget al.,2011).
Introduction
14
Table 2 – Features of necrosis (adapted from Kunget al.,2011).
Necrosis in yeast
Although apoptosis is the most discussed type of cell death and is recognized as the primary cause of cell death, necrosis has also been described in yeast. This kind of death does not occur only as a result of brutal chemical or physical insults, but can occur in physiological conditions, as reasonable concentrations of a compound may induce it (Eisenberg et al., 2010). Acetic acid and hydrogen peroxide are examples of agents capable of inducing not only apoptosis, but also necrosis in yeast. The type of death is dependent on the dose, i.e., apoptosis is triggered by low doses and higher doses of the same compound may lead to necrosis. This applies to acetic acid (Ludovico et al., 2001), to copper and manganese (Liang et al., 2007), to the antifungal agent amphotericin B (Phillips et al., 2003) and possibly also to pheromones (Zhang et al., 2006). Merely increasing the dosage of typical apoptotic triggers may, in most cases, stimulate non-regulated type of necrotic
Necrosis Morphology
Cell Swelling
Mitochondria Marked swelling
Chromatin condensation Usually not prominent
Cell fragmentation Cell rupture
Membrane blebbing Not characteristic
Membrane integrity Defective at early stages
Tissue inflammation Severe
Functions
Cellular ATP levels Markedly depleted
Production of ATP Markedly decreased
Consumption of ATP Continued
MPTP opening An early defining event in the mitochondrial necrosis pathway
Loss of ∆Ψm An early defining event in the mitochondrial necrosis pathway
Release of apoptogenic factors Not classic, but may be present because of OMM rupture following MPTP
opening
Caspase activation Not classically present but may occur with OMM rupture
Activation of other proteases Calpains, cathepsins, and other lysosomal proteases sometimes activated
death, likely resulting from radical damage of cellular structures and integrity. In the case of acetic acid, however, it is also feasible that increasing concentrations interfere with intracellular pH homeostasis in a regulated way that might resemble the detrimental effects of vacuolar dysfunction (Hauptmann et al., 2006). Tunicamycin-induce cell death in S. cerevisiae is accompanied by an excessive production of ROS, by a large loss of plasma membrane integrity, while at the same time lacking apoptotic DNA fragmentation. The sensitive to this agent is increased in calcineurin-deficient mutants or by the calcineurin inhibitor FK506. This allowed to conclude that tunicamycin induces a non-apoptotic, possibly necrotic death in yeast (Dugeon et al.,2008). Hsp90p, cytosolic chaperone for many kinases including RIP1 which serves a pro-necrotic signaling function in mammalian cells (Lewiset al.,2000), has been functionally associated with the regulation of necrosis as well (Dugeon et al., 2008). Disruption of Hsp90p function with the inhibitor radicicol, prevent the massive cell death described above, thus it is plausible that calcineurin and Hsp90p act with opposing functions in the regulation of controlled necrotic cell death in yeast (Dugeonet al.,2008).
Since in yeast there is no clear homolog of RIP1, exact molecular function of Hsp90p during yeast necrosis is unknown. Other types of yeast serine/threonine kinases such as Slt2p (Mpk1p), have been suspected to be targets of Hsp90p and might bear a comparable role to RIP1 (Truman et al.,2007; Zhaoet al.,2007).
It is known that mitochondria play a role in apoptosis in both yeast and mammals, as well as in necrosis of mammalian cells (Kroemer et al., 2007; Eisenberg et al., 2007 and Pozniakovsky et al.,2005). The production of ROS has been linked to apoptosis under diverse conditions, although it has also been described that ROS accumulation increases in necrosis in mammalian cells. To which extent ROS may also play an executor role during necrotic cell death in yeast remains unknown (Festjenset al.,2006).
Some studies, demonstrated that yeast Endo G encompasses a vital (anti-necrotic) as well as a lethal (pro-apoptotic) function (Büttner et al., 2007). Dual-vital and lethal-functions are well described for several other crucial regulators of apoptosis, including caspases, cytochrome c or the apoptosis inducing factor AIF (Launayet al.,2005).
Disruption of normal vacuolar/lysosomal function derives in necrotic cell death, at least in part due to failure of intracellular pH control. Intriguingly, lysosomal proteins (i.e. cathepsins, which need a rather acidic pH to exhibit their proteolytic function) together with non-lysosomal proteases
Introduction
16
(i.e. calpains) have been directly linked to necrotic cell death execution. This raises the possibility that dysfunction of vacuoles/lysosomes (and thus disruption of homeostatic pH control) may trigger necrosis by release of pro-necrotic proteases, which would find an optimal pH for their enzymatic activity in the acidified cytosol (Nakayamaet al.,2002; Yamashimaet al.,1998).
Several studies have addressed the possible link between peroxisomal function and necrosis in yeast. Deletion of S.cerevisiae PEX6, encoding a protein crucial for peroxisomal protein import, increased the sensitivity towards both acetic acid stress and stress upon entry into early stationary phase. This was accompanied by excessive ROS production and markers of necrosis (Jungwirth et al.,2008).
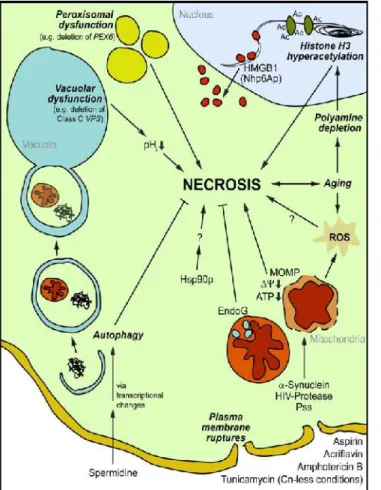
Figure 5 - Schematic view of stimuli and
cellular processes that interfere with yeast necrosis. Autophagy as well as proper vacuolar and peroxisomal functions are homeostatic processes that counteract necrosis in yeast. Dysfunction of these processes induces defined cellular events (e.g. cytosolic acidification) that can culminate into increased necrotic death accompanied by typical morphological and cell biological changes. These include plasma membrane rupture, mitochondrial outer membrane permeabilization (MOMP), dissipation of mitochondrial potential (∆Ψm↓), ATP depletion (ATP↓), overproduction of ROS and nuclear release of high mobility group box-1 (HMGB1) protein. Besides external stimuli (e.g. Acriflavin or Amphotericin B), endogenous triggers of yeast necrosis exist including Endo G depletion, heterologous expression of α- synuclein, HIV protease and proteinaceouselicitor harpin (Pss). In addition, chronological aging represents a physiological scenario closely interrelated to necrotic cell death, which is regulated by a network of epigenetic histone modifications and intracellular levels of polyamines (adapted from Eisenberget al.,2010).
The identification of the necrotic cell death occurs due to the absence of apoptotic markers studied extensively and by the occurrence of early plasma membrane permeabilization (Eisenberget al.,2009). Figure 4 summarizes in more detail the available methodologies and outlines a strategy to determine the different modes of cell death in yeast.
Previous data obtained in our lab showed thatS. cerevisiaecells exposed simultaneously to toxic concentrations of ethanol and low concentrations of acetic acid displayed a higher survival (measured either by CFU or by propidium iodide staining) than cells treated only with ethanol. These results indicated that acetic acid induces a cellular response that provides protection against the cytotoxic effect of ethanol (Vieira et al., unpublished results). Evidence of the involvement of the aquaglyceroporin Fps1p and of the MAP kinase Hog1p in acetic acid stress (Mollapour and Piper, 2006) triggered new studies. To address the possible involvement of the aquaglyceroporin Fps1p and of the MAP kinase Hog1p in the protector effect of acetic acid against ethanol stress (Mollapour and Piper, 2006), the loss of cell viability and plasma membrane integrity induced by ethanol in absence and presence of ethanol were determined. We found that the deletion of these genes did not abrogate the protection effect suggesting that it does not depend on Hog1p and Fps1p (Trindade, 2009).
Later Afonso showed that the osmolyte trehalose, the heat shock protein Hsp12p, the MAP kinase Slt2/MPK1 and functional mitochondria play a role in the protection by the undissociated form of acetic acid against ethanol induced cytotoxicity (Afonso, 2011).
With the present master thesis we intended to further understand how acetic acid protects against ethanol-induced cytotoxicity, determining the role of mitochondria in this protection. We also intended to characterize the death of cells exposed to toxic concentrations of ethanol since this knowledge would be important to dissect the role of acetic acid in its inhibition.To achieve these goals, cell viability and cytometric assays were performed on wild type cells and in knockout mutant cells, lacking known apoptototic regulators that have been involved in mitochondrial mediated death, during exposure to 13% (v/v) ethanol and to 13% (v/v) ethanol and 0.1% (v/v) of acetic acid.
MATERIALS AND
METHODS
Yeast Strains
Saccharomyces cerevisiaestrain BY4741 (MATa his3Δ1 leu2Δ0 met15Δ0 ura3Δ0) and the respective knockouts mutant strains inATP2, ATP10, POR1, YCA1, AIF1, PEP4, CPR3, CYC3, NUC1, AAC1-3 and CYC1CYC7 genes, were used in this work and were obtained from EUROSCARF collection, except the∆cyc1∆cyc7strain that was kindly provided Dr. Bjorn Johansson (CBMA, UM).
Media and Growth Conditions
For cell viability experiments, yeast cells were grown on YPDA plates (1% yeast extract, 2% bacto-peptone, 2% glucose and 2% agar) at 30 °C for 2-3 days. After growth on YPDA, cells were then inoculated (OD640nm=0. 5-0.6) in Erlenmeyers 50ml with 10 ml of YPD medium (ratio 1:5), at
26ºC overnight with shaking (120 rpm).
For fluorescence microscopy observations, yeast cells were grown under the same conditions with the exception of culture medium. For this purpose a defined minimal medium (SC medium) containing 2% glucose, 0.17 % yeast nitrogen base without amino acids, 5 % ammonium sulphate, 0.2% Drop-out mixture lacking histidine, lysine, metionine, leucine and uracil, 0.008% histidine, 0.008% lysine, 0.04% leucine and 0.008% methionine.
Cell viability assays
For cell viability assays, 1.3 ml of 1x10⁷cells/ml (OD640 = 0.5 – 0.6) were transferred to
microcentrifuge tube with a small hole in the lid to allow some transfer of oxygen. The cells were centrifuged and resuspended in 1.3 ml of YPD medium at pH 3.5. Cell viability assays were done using 13% (v/v) ethanol or 13% (v/v) ethanol and 0.1% (v/v) of acetic acid. Ethanol and acetic acid used were obtained from stock solutions of absolute ethanol (> 99%, v/v) and of 1M acetic acid, at pH 3.5. Cells were incubated at 26 ºC with shaking (120 rpm), during 3 hours. Samples of 50 µl were collected at different times (60, 120, 180 min). After 3 dilutions (one dilution at 1:10 and two dilutions at 1:20), 7 drops of 40 µl of the last dilution were plated on YPDA. Cell viability was analyzed by counting colony forming units (c.f.u) after 2-3 days of growth at 30ºC. The percentage of
Material and methods
22
survival for the different times was calculated by the formula: number of colonies in time X min (TX)/ number of colonies in time 0 (T0) x100.
Flow cytometric assays
In all the flow cytometric assays the samples were analyzed in an Epics® XL™ (Beckman Coulter) flow cytometer, and data were analyzed with version 2.5.0 of the flowing software. At least 20,000 cells from each sample were analyzed.
Assessment of plasma membrane integrity
Integrity of the cell plasma membrane was analyzed by flow cytometry using the impermeable dye propidium iodide (PI) (Molecular Probes, SIGMA). 100 µl of samples were collected at specific intervals (60, 120 and 180 min). Cells were harvested by centrifugation, ressuspended in 500 µL PBS (1x) to which 1 µl of a PI stock solution (1mg/mL) was added and incubated for 10 minutes at room temperature in the dark.
Assessment of superoxide anion intracellular accumulation
Intracellular accumulation of superoxide anion was detected by flow cytometry using Dihydroethidium (DHE) (Molecular Probes, SIGMA).100 µl of samples were collected at specific intervals (60, 120 and 180 min). DHE was added to yeast cell suspensions (1x10⁶ cells /ml) to a
final concentration of 5 µg /ml, and incubated for 40 minutes in the dark at room temperature.
Assessment of mitochondrial membrane potential
Mitochondrial membrane potential was measured by flow cytometry, using cells stained with 3,3’-Dihexyloxacarbocyanine iodide (DiOC6). Cells were collected and suspended in suspension buffer
[10 mM 2-(N-morpholino)ethanesulfonic acid (MES), 0.1 mM Mgcl2and 2% glucose, pH 6.0 (set with
double staining, cells were subsequently incubated with 1 µl of a PI stock solution (1mg/mL) for 10 minutes at room temperature.
Detection of caspase activation
Detection of caspase activation was performed using “caspACE, FITC-VAD- fmk In Situ Marker” (Promega). Briefly, for the caspACE kit 1x10⁶cells were washed in PBS, suspended in 100
µl staining solution containing 50 µM of FITC-VAD-fmk and incubated for 20 minutes at 30ºC in the dark. After incubation cells were washed once and suspended in PBS. For double staining with PI, cells were subsequently incubated with 1 µl of a PI stock solution (1mg/mL) for 10 minutes at room temperature prior to analysis by flow cytometry.
Assessment of exposure of phosphatidylserine in the outer surface of the plasma membrane
Phosphatidylserine exposure was detected by a FITC-coupled Annexin V reaction with the ApoAlertAnnexin V Apoptosis Kit (BD Biosciences). For that purpose cells were harvested (0.3 OD) and washed in sorbitol buffer (1.2 M sorbitol; 0.5 mM MgCl; 35mM K2HPO4, pH 6.8). To facilitate the
probe diffusion through cell wall, an incubation step with glusulase (3%, v/v) and 7 U/ml of lyticase at 28 °C was performed. Phase-contrast microscopy was used to monitor cell wall digestion step, controlling in this way damage to the unfixed spheroplasts. Cells were subsequently centrifuged (10 min at 1500 rpm) and ressuspended in 200 µl of binding buffer (1.2 M sorbitol; 10 mM HEPES/NaOH, pH 7.4; 140 mM NaCl; 2.5 mM CaCl2). 2 µl Annexin V (1 µg/ml) and 1 µl PI (4
µg/ml) were added to 40 µl of the cell suspension and the mixture incubated for 20 min at room temperature in the dark. Finally, extra 400 µl of binding buffer were added to the mixture just prior to analysis by flow cytometry.
Material and methods
24
Assessment of the translocation of Nhp6Ap from the nucleus into the cytosol by fluorescence microscopy
BY4741 strain and the respective knockouts mutant strains in ATP2, ATP10, CYC3, CPR3 and POR1 genes were transformed with the plasmids pUG35 and pUG35-NHP6A-EGFP, kindly provided by Dr. Frank Madeo (University of Gratz, Austria) by standard protocol. Yeast cells were grown in defined minimal medium (SC medium), as described above. 100 µl of samples were collected at specific intervals (60, 120 and 180 min). Cells were harvested by centrifugation, ressuspended in 10 µl of water. Cells were visualized in a Leica Microsystems DM5000B epifluorescence microscope using appropriate filter settings with a 100x oil immersion objective. Images were acquired with a Leica DCF350FX digital camera and processed with LAS AF Leica Microsystems software.
Assessment of the translocation of Nhp6Ap from the nucleus into the cytosol by flow cytometry Cells expressing GFP-tagged Nhp6Ap were harvested by centrifugation, ressuspended in 500 µL PBS (1x) to which 1 µl of a PI stock solution (1mg/mL) was added and incubated for 10 minutes at room temperature in the dark prior to analysis by flow cytometry. Samples of 100 µl were collected at specific intervals (60, 120 and 180 min).
Reproducibility and statistical analysis of the results
The results obtained are represented by the mean and standard deviation (SD) values of at least three independent experiments. Statistical analyses were carried out using GraphPad Prism Software v 6.00. P-values lower than 0.05 were assumed to represent a significant difference.
Results
26
Acetic acid protects cells from ethanol-induced cell death inSaccharomyces cerevisiae As referred above ethanol is the main end product of alcoholic fermentation carried out by S.cerevisiae and above a certain concentration exerts cytotoxic effects through perturbation of multiple processes responsible of cellular homeostasis. During fermentation, some weak acids such as acetic, butyric and pyruvic acids, produced by yeast metabolism, may accumulate in the growth medium and enhance ethanol toxicity, which results for instance in a higher inhibition of yeast growth and fermentation (Gibson et al., 2007). However, previous data obtained in our laboratory showed that S. cerevisiae cells exposed simultaneously to toxic concentrations of ethanol and low concentrations of acetic acid displayed higher survival than cells treated only with ethanol. These results indicated that acetic acid induces a cellular response that provides protection against the cytotoxic effect of ethanol (Vieiraet al.,unpublished results; Andreiaet al., 2011).
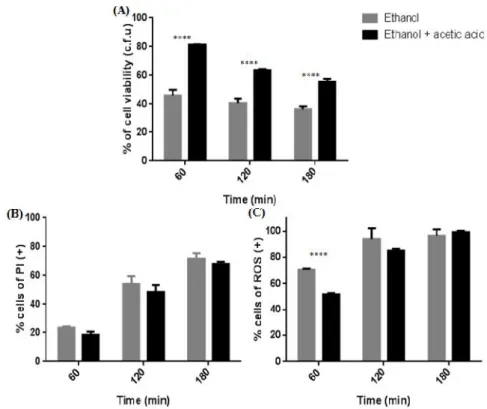
In this thesis, as referred above, one of our goals was to further understand how acetic acid protects cells from ethanol-induced death. In a first phase we evaluated cell viability by CFUs counts and plasma membrane integrity by PI staining of S. cerevisiae BY4741 cells exposed to 13% (v/v) ethanol either without or with 0.1% (v/v) acetic acid, pH 3.5, for 3 hours. The presence of acetic acid led to an increase of the percentage of CFUs associated with a decrease in the percentage of cells stained with PI when compared with cells only treated with ethanol, though only reaching statistical significance for the loss of cell viability (Fig. 7A, B). Subsequently, we evaluated the intracellular levels of superoxide anion with DHE, as an indicator of oxidative stress (Fig.7C) and found that acetic acid lead to a decreased accumulation of superoxide though this protective effect was only statistically different after 60 min.
Figure 7 - Acetic acid protects S. cerevisiae BY4741 cells from ethanol cytotoxicity. (A) – Cell viability (%) assessed by CFUs counts. 100% corresponds to the number of CFUs at time 0 min. The differences between the two cultures are statistically significant for time 60, 120 and 180 min. (P<0.0001). (B) – Cells with loss of plasma membrane integrity expressed as a percentage of PI positive stained cells. The differences between different cultures are not statistically significant. (C) - Cells displaying accumulation of superoxide expressed as a percentage of DHE positive stained cells. The differences between the two cultures are statistically significant for time 60 min. (P<0.0001). All experiments were performed in YPD medium at pH 3.5. Cells were incubated with 13% (v/v) of ethanol (Et) or co-incubated with 13% (v/v) ethanol and 0.1% (v/v) of acetic acid (Et + AA), for 3 hours. All the values represent the average of 3 independent experiments and the respective standard deviations.
Results
28
Protective effect of acetic acid against ethanol stress: the role of known yeast apoptotic regulators Data obtained in our laboratory (Afonso, 2011), showed that cell cultures without functional mitochondrial did not displayed protection by acetic acid against ethanol-induced cell death when assessed by CFUs counts. However, under this condition a significant protection against loss of plasma membrane integrity was still observed. Thus, mitochondrial functions, namely respiration, appear important for acetic acid to increase cell viability of cells exposed to ethanol but is dispensable for the preservation of plasma membrane integrity. In order to try to understand the exact role of mitochondria in the protection by acetic acid, we selected a group of S. cerevisiae knockout mutants in the BY4741 genetic background lacking known regulators of yeast apoptosis, some of which are involved in mitochondrial mediated apoptotic death, and evaluated the loss of cell viability, plasma membrane integrity and the levels of intracellular accumulation of superoxide anion as described above (Fig. 8, 9, 10 and 11). The experiments were performed using 13% (v/v) of ethanol in the absence or presence of 0.1% (v/v) of acetic acid, pH3.5. The mutant strains selected lack oxidative phosphorylation, cytochrome c, orthologues of putative components of mammalian permeability transition pore (PTP), and the yeast orthologues of the mammalian ENDO G, AIF, Cathepsin D and of the yeast metacaspase Yca1p.
Involvement of the ATP synthase subunits Atp2p and Atp10p
Synthesis of ATP from ADP and phosphate, catalyzed by F0F1-ATP synthases, is the most
abundant physiological reaction in almost any cell. F0F1-ATP synthases are membrane-bound
enzymes that use the energy derived from an electrochemical proton gradient for ATP formation (Diezet al.,2004).ATP2encodes the beta subunit of F1sector (Saltzgaber-Mulleret al.,1983), and
ATP10 is a mitochondrial inner membrane protein component that acts as Atp6p-specific chaperone and is required for the biogenesis of the hydrophobic F0 sector of the mitochondrial ATPsynthase
complex (Paul et al., 2000). Although Atp2p is essential for the function of ATP synthase, it is not essential for life in yeast. Deletion of this gene, like deletions in many other genes necessary for the function or maintenance of mitochondria, lead to a "petite" phenotype that is associated with a slow-growing in glucose and inability to growth on non-fermentable carbon sources (Saltzgaber-Muller et al.,1983).
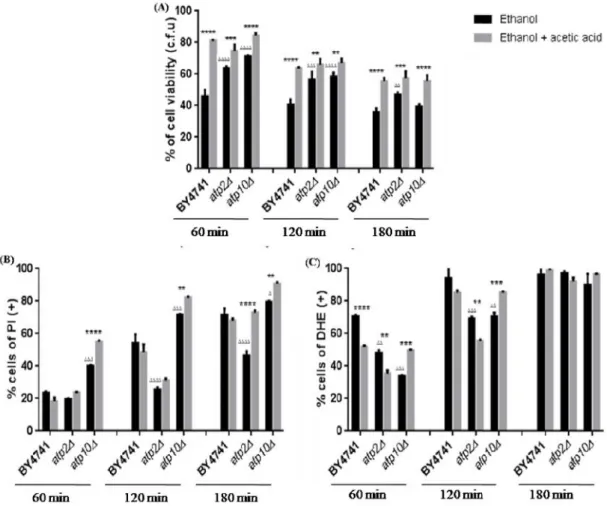
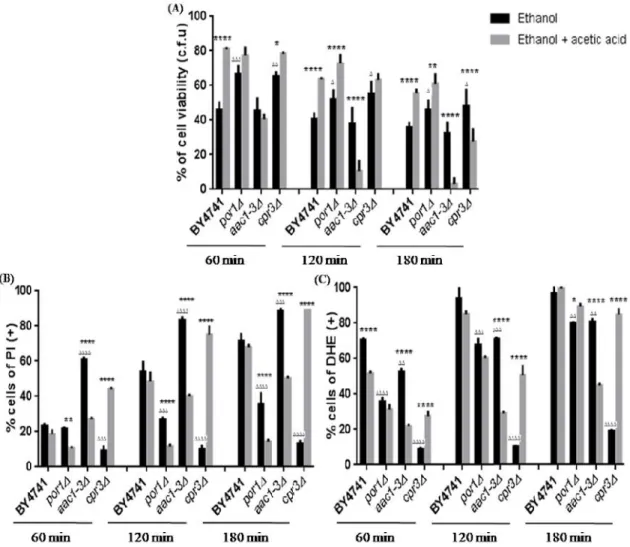
The protective effect of 0.1% (v/v) of acetic acid on 13% (v/v) of ethanol-induced death verified in the wild-type strain was not abolished by deletion of ATP2or ATP10suggesting that these proteins are not involved in the protection by the acid (Fig. 8A). However, when the mutant cells atp2∆ andatp10∆ treated with 13% (v/v) of ethanol were compared with cells treated with 13% (v/v) of ethanol and 0.1% (v/v) of acetic acid, there was no protection against the loss of plasma membrane integrity by acetic acid in the case of the atp2∆ mutant, and with the atp10∆ mutant there was even an increase in the percentage of cells with compromised plasma membrane (Fig. 8B). However, and consistent with these data, while 0.1% (v/v) acetic acid decreased the accumulation of superoxide anion induced by 13% (v/v)ethanol in theatp2∆ mutant for 60 and 120 min., it had the opposite effect in theatp10∆ mutant (Fig. 8C).
Figure 8 - Acetic acid protectsS. cerevisiaeBY4741,atp2∆andatp10∆cells from ethanol cytotoxicity. (A) – Cell viability (%) assessed by CFUs counts. 100% corresponds to the number of CFUs at time 0 min. (B) – Cells with loss of plasma membrane integrity expressed as a percentage of PI positive stained cells. (C) - Cells
The protective effect of 0.1% (v/v) of acetic acid on 13% (v/v) of ethanol-induced death verified in the wild-type strain was not abolished by deletion of ATP2orATP10 suggesting that these proteins are not involved in the protection by the acid (Fig. 8A). However, when the mutant cells atp2∆ andatp10∆ treated with 13% (v/v) of ethanol were compared with cells treated with 13% (v/v) of ethanol and 0.1% (v/v) of acetic acid, there was no protection against the loss of plasma membrane integrity by acetic acid in the case of the atp2∆ mutant, and with the atp10∆ mutant there was even an increase in the percentage of cells with compromised plasma membrane (Fig. 8B). However, and consistent with these data, while 0.1% (v/v) acetic acid decreased the accumulation of superoxide anion induced by 13% (v/v)ethanol in theatp2∆ mutant for 60 and 120 min., it had the opposite effect in theatp10∆ mutant (Fig. 8C).
Figure 8 - Acetic acid protectsS. cerevisiaeBY4741,atp2∆andatp10∆cells from ethanol cytotoxicity. (A) – Cell viability (%) assessed by CFUs counts. 100% corresponds to the number of CFUs at time 0 min. (B) – Cells with loss of plasma membrane integrity expressed as a percentage of PI positive stained cells. (C) - Cells
Results
30
displaying accumulation of superoxide expressed as a percentage of DHE positive stained cells. All experiments were performed in YPD medium at pH 3.5. Cells were incubated with 13% (v/v) of ethanol (Et) or co-incubated with 13% (v/v) of ethanol and 0.1% (v/v) of acetic acid (Et + AA), for 3 hours. All the values represent the average of 3 independent experiments and the respective standard deviations. * Represent statistical analysis of cells treated only with ethanol and ∆ represent statistical analyses of cells treated with ethanol and acetic acid. ****/∆∆∆∆: P<0.0001; ***/∆∆∆: P<0.001; **/∆∆: 0.01and */∆: P<0.05.
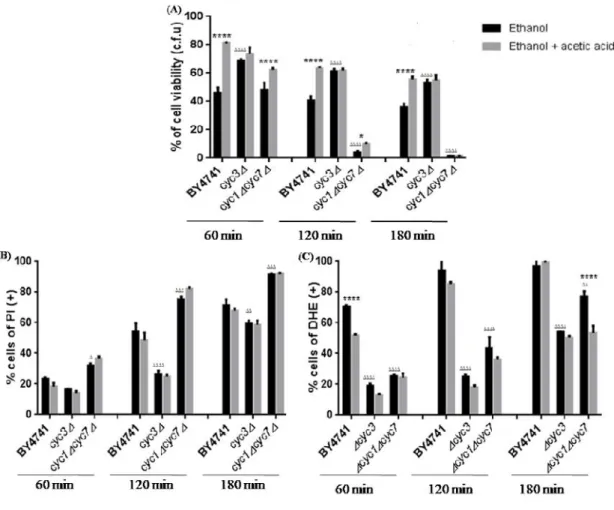
Involvement of the heme lyase Cyc3p and of the cytochromecisoforms Cyc1p and Cyc7p
CYC3 gene encodes cytochrome cheme lyase (CCHL), essential for the covalent binding of the heme group to isoforms 1 and 2 of the apocytochromecand thus to the formation of the mature cytochromec.
The presence of 0.1% (v/v) of acetic acid did not cause a significant increase in cell survival in thecyc3∆ mutant at any time of treatment (Fig. 9A). Similarly, the protective effect of acetic acid against loss of plasma membrane integrity and accumulation of intracellular superoxide was not significant at any time of treatment suggesting that Cyp3p has a role in the protective effect of the acid against ethanol (Fig. 9A, B).
CYC1andCYC7encode the iso-1-cytochromecand iso-2-cytochromec, respectively.
Cells lacking both cytochromecisoforms exhibited increase cell survival in response to 13% (v/v) of ethanol plus 0.1 % (v/v) of acetic acid after 60 and 120 min., but lost the protective effect of acetic acid after 180 min (Fig. 9A). Though there was no protection against the loss of plasma membrane integrity at any time, 0.1% (v/v) of acetic acid decreased significantly the level of superoxide anion after 180 min. (Fig. 9B, C).