Doi: https://doi.org/10.25186/.v15i.1629
Agronomic performance of coffee in response to framework
pruning in cycles of the “safra zero”
Pedro Lage Maia1 , Guilherme Augusto Teixeira Tassone2 , Denis Henrique Silva Nadaleti3 , Cesar Elias Botelho4 , Deila Magna dos Santos Botelho3 , Priscila Carvalho Moreira5 , Gladyston Rodrigues Carvalho4
1Engenheiro Agrônomo, Perdões, MG, Brasil
2Universidade Federal de Lavras/UFLA, Departamento de Agricultura/DAG, Lavras, MG, Brasil
3Universidade Federal de Lavras/UFLA, Instituto Nacional de Ciência e Tecnologia do Café/INCT Café, Lavras, MG, Brasil 4Empresa de Pesquisa Agropecuária de Minas Gerais/EPAMIG, Campus da Universidade Federal de Lavras, Lavras, MG, Brasil 5Demax, São Paulo, SP, Brasil
Contact authors: pmaia58@gmail.com, gui.tassone@hotmail.com, denishenriquesilva@yahoo.com.br, cesarbotelho@epamig.br, deilamagna@hotmail.com, pricmoreira@yahoo.com.br, pricmoreira@yahoo.com.br, grodriguescarvalho@gmail.com
Received in October 3, 2019 and approved in March 10, 2020 ABSTRACT
In this paper, we aimed at selecting genotypes of Coffea arabica L. that are responsive to framework pruning, with high productive potential and desirable agricultural features. We evaluated 18 progenies in the F5 generation, 8 of them being from the group Catucaí (breeding of seedlings of Red Catuaí with coffee seeds of the Icatu germplasm) and ten descendants from the Timor Hybrid (breeding of the Red and Yellow Catuaí with the Timor Hybrid), as well as two commercial cultivars as control (Tupi IAC 1669-33 and Obatã IAC 1669-20). The experiment was carried out at the experimental field of the Fed-eral University of Lavras. The coffee was pruned in August 2014 after the sixth crop and once again in August 2016, being two cycles in the “safra zero” system. The design used was in randomized blocks (RBD) with three repetitions and 20 treatments (18 progenies and two commercial cultivars) totaling 60 experimental plots. We evaluated the area under the progress curve of incidence and severity of leaf rust and cercosporiosis, the productivity (sacs ha-1), sieve #16 and over (%), mocha-type grains (%) and apparent specific mass of grains (tonm-3). The genotype 12 (H516-2-1-1-18-1-4) was responsive
to the framework pruning and kept its productivity stable in both pruning cycles, being efficient in such system of crop conduction, besides presenting low incidence and severity of coffee leaf rust and cercosporiosis and high sieve.
Key words: Timor hybrid; Cercosporiosis; Leaf rust.
1 INTRODUCTION
Coffee crop is one of the most important Brazilian commodities, having Brazil figuring as the biggest world producer and exporter of such a product, as well as its second-biggest consumer, outstanding in its high influence on the international agribusiness context. In this sense, this sector has internalized new production techniques to enhance coffee production and quality to maintain itself competitive regarding the global scenario.
One of the main aspects that surround the expansion of such a crop involves the incidence of pests and diseases, with a special highlight on the coffee leaf rust (Hemileia vastatrix. Berk. et Br) and cercosporiosis (Cercospora coffeicola Berk & Cooke), with losses that float according to their incidence and severity. These pathogens constitute important coffee phytosanitary problems, resulting in serious damages such as defoliation, reduction of productivity and performance and also in the loss of coffee quality (Souza; Maffia; Mizubuti, 2012; Zambolim, 2016).
In the coffee crop management, one of the most used practices is pruning, responsible for the maintenance of the coffee production capacity, and among their types there is the
framework pruning, the most used one aiming at renewing the plants production capacity, deleting the non-productive vegetative tissues and avoiding the closure of the harvest in cases of dense plantations. (Thomaziello et al., 2000; Fernandes et al., 2012).
The usage of framework pruning developed a management system called “safra zero”, which aims at maintaining the harvest size and eliminating the need of burdensome crops in low crop years, preferring the use of pruning cycles after a crop with high pending level (Japiassú et al., 2010). This system presents a high potential for mountain region, being recent in the Brazilian coffee crop, with responses in productivity varying according to the climate of the pruning year and genotype (Nadaleti et al., 2018).
For the application of this technique, it is essential to use of the adequate cultivars and the correct management to enhance the grains productivity in short-term, in more satisfactory levels than the free-growth plantation (Carvalho et al., 2013).
Acknowledging the aforementioned, we aimed, in this paper, at selecting genotypes of Coffea arabica L. that are responsive to framework pruning, with a high productive potential jointly with the desirable agricultural features.
2 MATERIAL AND METHODS
We carried out this research on the experimental field of the Coffee Crop sector of the Agriculture Department at the Federal University of Lavras, located in Lavras city, State of Minas Gerais. Such a city is at 950 meters of altitude, 21º 14’ of Sothern latitude and 44º571 of Western longitude, with an average temperature of 21 ºC and 1067 mm of average rain precipitation in the agricultural year 2016/2017, and 23 ºC and 940 mm in the agricultural year 2017/2018 (Instituto Nacional de Meteorologia - INMET, 2019). The testing was implanted in December 2015, in spacing of 3,5m (between lines) x 0,70m (between plants), corresponding to a stand of 4.082 plants ha-1.
We evaluated 18 progenies in F5 generation, 8 of them
being from the group Catucaí (breeding between cultivars of the Catuaí group with coffee plants of the Icatu germplasm) and ten descendants of the “Timor Hybrid” (breeding between the Red and Yellow Catuaí with the Timor Hybrid) as well as two productive and leaf rust resistance commercial cultivars as witness (Tupi IAC 1669-33 and Obatã IAC 1669-20).
We used the completely randomized blocks method (CRB) as experimental design with three repetitions, with 20 treatments (18 progenies and two commercial cultivars) totaling 60 experimental plots. Each plot was constituted by 15 plants resulting in an entirely useful plot.
The experiment was held based on the technique recommendations for the coffee crop, with cultural, nutritional, and phytosanitary treats according to the need of the plants (Matiello et al., 2015).
The framework pruning was held on August 2014 after the sixth crop and once again in August 2016, taking out the edge part of the coffee plagiotropic branches, maintaining from 30 to 40 cm of the orthotopic ones. Subsequently, we held the collar pruning of the orthotropic branch at two meters high from the ground level, conducting only some growth over the cutting point.
Before the second framework pruning, the productivity evaluations were measured in liters of coffee harvested by the total of fruit detachment by plot, annually by seven crops (2008/2009 to 2013/2014 and 2015/2016), the latter referring to the first cycle after the pruning. We obtained the data from the month of May to July each year, with subsequent
conversion to sacs kg of processed coffee ha-1, according to the
performance of each genotype.
After the second framework pruning, we evaluated the following agricultural variables: The area under incidence progress curve (AUIPC) and severity (AUSPC) of the leaf rust were obtained by biweekly foliar samplings from 03/05 to 14/06, 2018, totaling four evaluations prior to the harvest. The collects took place in the middle third of the plants, at the 3rd or
4th pair of leaves of the plagiotropic branches randomly, in both
sides of the plant, totaling 30 leaves by plot. The incidence in percentage was estimated by the number of leaves with symptoms of leaf rust divided by the total amount of leaves per plot. To determine the severity, we used the diagram scale, with six levels of severity: 0 (absence of diseases), 1 (less than 3% of severity), 2 (from 3 to 6% of severity), 3 (from 6 to 12% of severity), 4 (from 12 to 25% of severity) and 5 (from 25 to 50% of severity). This scale has as reference the visual evaluation proposed by Capucho et al. (2011). After the obtaining of results, we determined the AUIPC and AUSPC according to the equation proposed by Shaner and Finney (1977).
For areas under the incidence progress curve (AUIPC) and severity (AUSPC) of cercosporiosis, we adopted the same foliar samplings aforementioned. The incidence was determined in percentage by the number of leaves with symptoms of the disease divided by the total number of leaves in the plot. As for the severity, we used the diagram scale proposed by Custodio et al. (2011), which has six levels of severity (%) with intervals of 0.1-3; 3.1-6,0; 6.1-12.0; 12.1-18.0; 18.1-30.0; 30.1-50.0 of the sick foliar area. After the obtaining of results, we determined the AUIPC and the AUSPC.
The harvest took place in the second half of July 2018, by the total fruit detachment in fabric, measured in liters of harvested coffee and followed by the conversion to
productivity in sacs ha-1 of processed coffee according to the
performance of each genotype.
As for the performance, we used samplings of four litters of coffee harvested by the total fruit detachment, conditioned in twisted polyethene sacs and sun-drying oriented until reaching ±11,0% of water level. The samplings were processed and weighted to determine the performance of each genotype. The physical evaluations on the grains were carried out stemming from such samplings.
For the sieve #16 and over (%) and mocha-type grains (%), we selected a sampling with 100 grams of free-impurities coffee and pieces of grains, using a group of sieves (19/64 to 12/64 for flat grains and 13/64 to 08/64 to mocha-type grains). We summed the weight value of the grain left in the flat sieve of size 16/64 and over, as well as summed the weight of the grains left in the oblong sieves (13, 12, 13, 10, 09, and 08/64) according to the protocol proposed by Brasil (2003). We obtained the apparent specific mass using a hectoliter weight scale with capacity for a liter. The results were shown in ton. m3.
The data were submitted to the analysis of variance, using the software ‘Sisvar’ version 5.6 (Ferreira, 2014). The variables, when significant to the test F (p<0,05), were compared according to the Scott-Knott test (p<0,05). The data was submitted to the normality test of Shapiro Wilk and, as for the variables that do not meet the presumption of normal
distribution of data, we used the transformation of (X + 0.5)0.5, being the most suitable for this data.
We also used the values of productivity to establish a ratio between the framework pruning cycles productivity in the “safra zero” system with the productivities before the pruning, as it follows:
• Comparison between the average productivity of the
first biennium of the “safra zero” cycle and the average productivity before framework pruning;
• Comparison between the average productivity of the first
and second biennium of the “safra zero” cycle;
• Comparison between the average productivity of the
two biennia of the “safra zero” cycle with the average productions before framework pruning;
3 RESULTS AND DISCUSSION
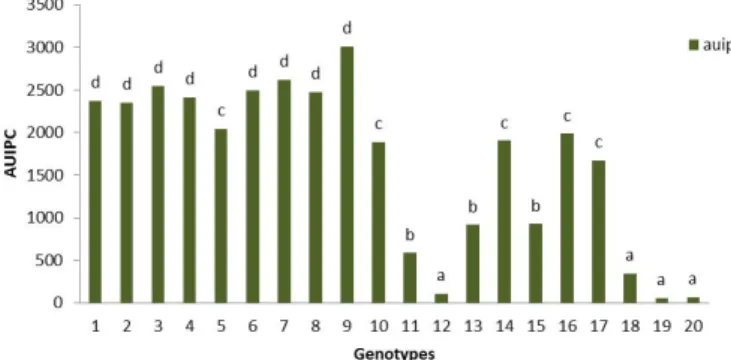
For the AULRIPC, four groups were formed, in which the genotypes 12, 18, 19 (Tupi IAC 1669-33) and 20 (Obatã IAC 1669-20) presented lower incidence values of the coffee leaf rust (Figure 1). All the mentioned genotypes are offspring to the germplasm “Timor Hybrid”, which, in its case, has at least the greatest resistance genes SH5 and SH9 (Bettencourt; Lopes; Palma, 1992). Besides the already identified genes, other genes, related to the resistance to leaf rust are likely present in these genotypes (Varzea; Marques, 2005), conditioning a higher resistance to the genotypes arisen from such breeding processes. Other authors also confirmed the resistance to leaf rust of materials originated from the “Timor Hybrid” (Paiva et al., 2010; Reis et al., 2018).
The second group was composed by the genotypes 11, 13, and 15, with amplitude from 585 to 925, not differing significantly among themselves (Figure 1). According to Botelho et al. (2010) the intermediate incidence of genotypes is interesting since it is not possible to select genotypes with horizontal resistance on those free from diseases. The genotypes with intermediate resistance to the disease probably present resistance either of the vertical or specific types, overlapping the manifestation of the horizontal resistance.
The average numbers followed by the same letter does not differ among themselves, by the Scott-Knott test, to 5% of probability.
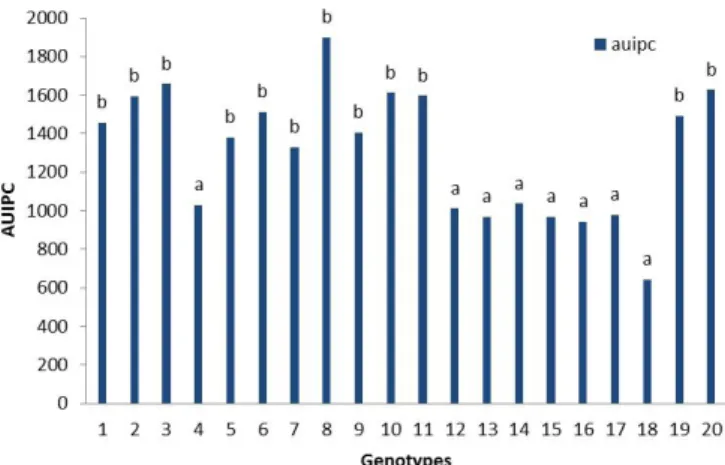
The third and fourth group were composed by the genotypes 5, 10, 14, 16, and 17 and by the genotypes 1, 2, 3, 4, 5, 6, 7, 8, and 9 respectively, with higher values of AULRIPC. As for the AULRSPC, two groups were formed, in which the genotypes 1, 4, 5, 10, 11, 12, 13, 14, 15, 16, 17, 18, 19 (Tupi IAC 1669-33) and 20 (Obatã IAC 1669-20), presented lower values of disease severity (Figure 2). Such results support those found by Petek et al. (2006), in which the cultivars Catigua MG1, Sacramento MG1, Araponga MG1, Paraíso H419-1 and MGS Catiguá 3 were tolerant to the coffee leaf rust, which means they presented incidence and, mainly, severity at intermediate indexes.
Figure 1: Area under leaf rust incidence progress curve (AULRIPC) in coffee genotypes.
Figure 2: Area under leaf rust severity progress curve (AULRSPC) in coffee genotypes.
The average numbers followed by the same letter does not differ among themselves, by the Scott-Knott test, to 5% of probability.
Another important aspect is that a lower severity rate can indicate horizontal resistance and, according to Campbell and Madden (1990), in natural conditions of epidemic diseases, the severity is the component that best differentiates the levels of horizontal resistance.
The second group was composed by the six following genotypes, 2, 3, 6, 7, 8, and 9, with higher values of AULRSPC, indicating higher severity of this disease in these materials, which means a larger damaged foliar area. This higher severity found in these genotypes may be caused by the advent of new breeds of the fungi Hemileia vastatrix, as already reported by Sera et al. (2010) with a resistance gene of the Catucaí cultivars (“Icatu” x “Catuaí”), different from the SH5, was completely ruptured by some kind of breed of Hemileia vastatrix.
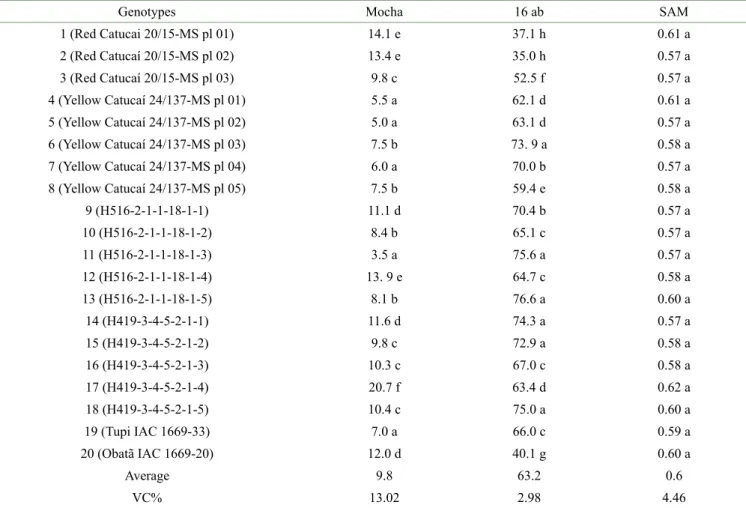
For AUCIPC, two groups were formed. The first group consisted of genotypes 4, 12, 13, 14, 15, 16, 17 and 18 which presented lower values for AUCIPC (Figure 3). In some work carried out by Botelho et al. (2017), they observed the genetic
variability for resistance to cercosporiosis, evaluating accesses to active germplasm banks and, according to the authors, experimental repetitions at different moments of the year can increase the selection reliability.
The average numbers followed by the same letters do not differ among themselves, through the Scott-Knott test, to 5% of probability.
The second group presented higher values of AUCIPC, being composed by the genotypes 1, 2, 3, 5, 6, 7, 8, 9, 10, 11, 19 (Tupi IAC 1669-33) and 20 (Obatão IAC 1669-20) (Figure 3). Patrício et al. (2011) reported that there is no relation between the resistance to leaf rust and the resistance to cercosporiosis, once materials such as Obatã IAC 1669-20 and “Timor Hybrid”, both resistant to leaf rust, did not present resistance to cercosporiosis, confirming the results of this work.
The average numbers followed by the same letter do not differ among themselves, by the Scott-Knott test, to 5% of probability.
For the percentage of sieve #16 and over, six groups formed where we highlight the genotypes 6, 11, 13, 14, 15, and 18 with higher values, varying from 72.9% to 76.6% (Table 1). The high percentage of bigwig grains indicate nice conditions of nutritional and sanitary management in all stages of fruit filling, besides having a higher potential of value aggregation to coffee commercialization (Nadaleti et al., 2018).
The other groups, except the three latter, presented satisfactory values of grains left in the sieves #16 and above. These values are similar to those found by Carvalho et al. (2012), in which they observed percentages of sieve #16 and above in the span from 51.0% to 68.7%.
According to Ferreira et al. (2013), the larger the grains are, the more uniform the plot is to be processed, influencing directly in the physical aspect of the product, being desirable in the usage of espresso coffee machines, for one, in which the toasted grains are exposed to the consumer.
In what concerns the percentage of mocha-type grains, we noted that there was a formation of 8 groups, two groups of the genotypes 4, 5, 7, 11, and 19 presented lower percentages of mocha-type grains varying from 3.5 to 7.0% (Table 1). For the production of certified seeds, the criteria for standardization indicates maximum tolerance of 12% of mocha seeds (Carvalho et al., 2013; Paiva et al., 2010). Thus, only the genotypes belonging to group five (genotypes 1, 2, and 12) and the genotype 17 belonging to group 6 presented values above the maximum allowed.
According to Nadaleti et al. (2018), even though the mocha-type grain is not considered a physical defect in the methodology of physical classification, it is still a defect for the coffee enhancers, for there is only the formation of a seed in the fruit, resulting in a low performance of the processed coffee. We must emphasize that, according to Silva et al. (2016), the pruning does not contribute to the increase in the percentage of mocha-type grains.
As for the apparent specific mass, the evaluated
genotypes presented values from 0.57 to 0.60 ton./m3, no
significant difference was observed between them (Table 1). Considering the productivity values before the pruning management, the genotypes 1, 2, 6, 14, 15, 19 (Tupi IAC 1669-33) and 20 (Obatã IAC 1669-20) outstood among all, with their productivity values varying from 39.5 to 50.5 sacs
ha-1 (Table 2). Yet, regarding their average productivity in the
first biennium under the “safra zero” system, the values varied
from 18.4 to 40.8 sacs ha-1, with a general average of 33.8 sacs
ha-1 and formation of two groups. The first group is composed
of 14 genotypes with productivity varying from 32.4 to 40.8 sacs ha-1.
Figure 3: Area under cercosporiosis incidence progress curve (AUCIPC) in coffee genotypes.
Figure 4: Area under cercosporiosis severity progress curve (AUCSPC) in coffee genotypes.
As for the AUCSPC, there was no significant difference between genotypes (Figure 4). These data support Gomes et al. (2015) who did not find a significant effect to the cercoporiosis in the selection of breeding progenies between the cultivars of the Icatu and Catuaí coffee.
Such data are similar to those found by Carvalho et al. (2013), in which the progenies evaluation of the Yellow Catuaí IAC 2077-1-2-12-70 and Mundo Novo IAC 515-20 in the first year after the framework pruning, obtained average
productivity of 70.95 sacs ha-1. Nevertheless, the “safra
zero” system consists of eliminating a burdensome crop and, thus, this first harvest after the framework pruning must be divided by the biennium to enable a comparison of average production;
When we compare the average productivity in the first biennium under the “safra zero” system to the average prior to the pruning, we perceive that the genotypes 4, 9, 12, 16, 17, 18, and 19 (Tupi IAC 1669-33) outstood, presenting a ratio higher than 100%, emphasizing their responsiveness to the framework pruning.
These data support Reis et al. (2018), who also found higher values in response to the pruning for the Tupi IAC 1669-33, Yellow Catucaí 20/15, Araponga MG1 and Acauã Cultivars, these demonstrating efficiency to the “safra zero” system, for they presented a lower vegetative growth during their reproductive development.
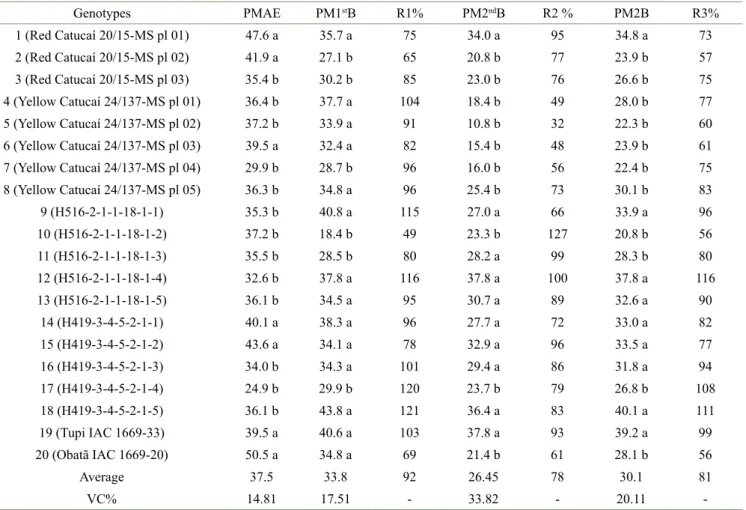
Table 1: Averages for the percentage of mocha-type grains (Mocha), percentage of sieve #16 and above (16 ab) and specific apparent mass (SAM) of the coffee genotypes.
Genotypes Mocha 16 ab SAM
1 (Red Catucai 20/15-MS pl 01) 14.1 e 37.1 h 0.61 a 2 (Red Catucaí 20/15-MS pl 02) 13.4 e 35.0 h 0.57 a 3 (Red Catucaí 20/15-MS pl 03) 9.8 c 52.5 f 0.57 a 4 (Yellow Catucaí 24/137-MS pl 01) 5.5 a 62.1 d 0.61 a 5 (Yellow Catucaí 24/137-MS pl 02) 5.0 a 63.1 d 0.57 a 6 (Yellow Catucaí 24/137-MS pl 03) 7.5 b 73. 9 a 0.58 a 7 (Yellow Catucaí 24/137-MS pl 04) 6.0 a 70.0 b 0.57 a 8 (Yellow Catucaí 24/137-MS pl 05) 7.5 b 59.4 e 0.58 a 9 (H516-2-1-1-18-1-1) 11.1 d 70.4 b 0.57 a 10 (H516-2-1-1-18-1-2) 8.4 b 65.1 c 0.57 a 11 (H516-2-1-1-18-1-3) 3.5 a 75.6 a 0.57 a 12 (H516-2-1-1-18-1-4) 13. 9 e 64.7 c 0.58 a 13 (H516-2-1-1-18-1-5) 8.1 b 76.6 a 0.60 a 14 (H419-3-4-5-2-1-1) 11.6 d 74.3 a 0.57 a 15 (H419-3-4-5-2-1-2) 9.8 c 72.9 a 0.58 a 16 (H419-3-4-5-2-1-3) 10.3 c 67.0 c 0.58 a 17 (H419-3-4-5-2-1-4) 20.7 f 63.4 d 0.62 a 18 (H419-3-4-5-2-1-5) 10.4 c 75.0 a 0.60 a 19 (Tupi IAC 1669-33) 7.0 a 66.0 c 0.59 a 20 (Obatã IAC 1669-20) 12.0 d 40.1 g 0.60 a Average 9.8 63.2 0.6 VC% 13.02 2.98 4.46
The average numbers followed by the same letter in the column do not differ among themselves, by the Scott-Knott test, to 5% of probability. Regarding the average productivity of the second biennium of the “safra zero” system, two groups formed, emphasizing 10 genotypes that presented higher
productivities, varying from 27.0 to 37.8 sacs ha-1. Comparing
the average productivity obtained to the one observed in the first cycle of the “safra zero” system, the genotype 12 outstood presenting a ratio of 100%, highlighting its adaptation and responsiveness to the framework pruning cycles, with stability in productivity.
The other genotypes presented average numbers in the second biennium after the pruning in the “safra zero” system lower than the average of the first cycle, since the average ratio was of 78%. These results coincide with other authors who affirm that the pruning, in a general manner, does not increase the productivity (Silva et al., 2016; Fernandes et al., 2012; Japiassú et al., 2010). However, according to Nadaleti et al. (2018), we must consider that this pruning system eliminates the workforce costs with the harvest in alternated years, whereas such a practice has great participation in the final cost of the process coffee sacs.
In their research, Barros et al. (2004) found satisfactory values for the comparison of the harvest cost of a crop with
expected productivity of 80 sacs ha-1 every other year, in both
the traditional and ”safra zero” systems. They concluded that the cost of harvest operations for the “safra zero” system represented approximately 56% of the value spent in the traditional system.
When we take into account the average productivity of the two biennia in the “safra zero” system, nine genotypes presented better productivities, varying from 31.8 to 40.1
sacs ha-1. Among them, the genotypes 12, 17, and 18
outstood for presenting a ratio higher than 100% when compared to the average productivity obtained prior to the first pruning, expressing that the materials are responsive to the pruning.
In a general analysis, we observed a positive response to framework pruning from genotypes that also presented lower incidence and severity to rust, being the offspring of the breeding with “Timor Hybrid”, considering
that the main damage caused by the leaf is defoliation, reducing severely the active photosynthetic area and, as result, the reduction in production of photoassimilates and other plants stock substances, which are essential to the post-pruning growth.
4 CONCLUSIONS
The genotype 12 (H516-2-1-1-18-1-4) was responsive to the framework pruning and kept its productivity stable in both pruning cycles, being efficient in such system of crop conduction, besides presenting low incidence and severity of coffee leaf rust and cercosporiosis and high sieve.
5 REFERENCES
BARROS, U. V. et al. Comparação entre o custo da colheita tradicional e o custo da colheita com esqueletamento simultâneo. Coffea: revista brasileira de tecnologia
cafeeira, 1(4):7-8, 2004.
Table 2: Averages of the average productivity prior to the framework pruning (PMAE); average productivity of the first biennium of the “safra zero” system (PM1stB); average productivity of the second biennium in the “safra zero” system (PM2ndB); average productivity in the two biennia in the “safra zero” system (PM2ndB), ratio between PM1thB and PMAE (R1%); ratio between PM2ndB and PM1stB (R2%) and ratio between PM2B and PMAE (R3%) of the coffee genotypes.
Genotypes PMAE PM1stB R1% PM2ndB R2 % PM2B R3% 1 (Red Catucaí 20/15-MS pl 01) 47.6 a 35.7 a 75 34.0 a 95 34.8 a 73 2 (Red Catucaí 20/15-MS pl 02) 41.9 a 27.1 b 65 20.8 b 77 23.9 b 57 3 (Red Catucaí 20/15-MS pl 03) 35.4 b 30.2 b 85 23.0 b 76 26.6 b 75 4 (Yellow Catucaí 24/137-MS pl 01) 36.4 b 37.7 a 104 18.4 b 49 28.0 b 77 5 (Yellow Catucaí 24/137-MS pl 02) 37.2 b 33.9 a 91 10.8 b 32 22.3 b 60 6 (Yellow Catucaí 24/137-MS pl 03) 39.5 a 32.4 a 82 15.4 b 48 23.9 b 61 7 (Yellow Catucaí 24/137-MS pl 04) 29.9 b 28.7 b 96 16.0 b 56 22.4 b 75 8 (Yellow Catucaí 24/137-MS pl 05) 36.3 b 34.8 a 96 25.4 b 73 30.1 b 83 9 (H516-2-1-1-18-1-1) 35.3 b 40.8 a 115 27.0 a 66 33.9 a 96 10 (H516-2-1-1-18-1-2) 37.2 b 18.4 b 49 23.3 b 127 20.8 b 56 11 (H516-2-1-1-18-1-3) 35.5 b 28.5 b 80 28.2 a 99 28.3 b 80 12 (H516-2-1-1-18-1-4) 32.6 b 37.8 a 116 37.8 a 100 37.8 a 116 13 (H516-2-1-1-18-1-5) 36.1 b 34.5 a 95 30.7 a 89 32.6 a 90 14 (H419-3-4-5-2-1-1) 40.1 a 38.3 a 96 27.7 a 72 33.0 a 82 15 (H419-3-4-5-2-1-2) 43.6 a 34.1 a 78 32.9 a 96 33.5 a 77 16 (H419-3-4-5-2-1-3) 34.0 b 34.3 a 101 29.4 a 86 31.8 a 94 17 (H419-3-4-5-2-1-4) 24.9 b 29.9 b 120 23.7 b 79 26.8 b 108 18 (H419-3-4-5-2-1-5) 36.1 b 43.8 a 121 36.4 a 83 40.1 a 111 19 (Tupi IAC 1669-33) 39.5 a 40.6 a 103 37.8 a 93 39.2 a 99 20 (Obatã IAC 1669-20) 50.5 a 34.8 a 69 21.4 b 61 28.1 b 56 Average 37.5 33.8 92 26.45 78 30.1 81 VC% 14.81 17.51 - 33.82 - 20.11
BRASIL. MINISTÉRIO DA AGRICULTURA, PECUÁRIA E ABASTECIMENTO. Instrução Normativa nº 8, de
11 de junho de 2003. República Federativa do Brasil,
Brasília, 2003. p.22-29.
BETTENCOURT, A. J.; LOPES, J.; PALMA, S. Factores genéticos que condicionam a resistência às raças de Hemileia vastatrix Berk. et Br. dos clones-tipo dos grupos 1, 2 e 3 de derivados de Híbrido de Timor. Brotéria
Genética, 13:185-194, 1992.
BOTELHO, C. E. et al. Seleção de progênies F4 de cafeeiros obtidas pelo cruzamento de Icatu com Catimor. Revista
Ceres, 57(3):274-281, 2010.
BOTELHO, D. M. dos S. et al. Cercosporiosis resistance in coffee germplasm collection. Euphytica, 213(6):117, 2017. CAMPBELL, C. L.; MADDEN, L. V. Introduction to plant
disease epidemiology. New York: J. Wiley, 1990. 655p. CARVALHO, A. M. et al. Desempenho agronômico de
cultivares de café resistentes à ferrugem no Estado de Minas Gerais, Brasil. Bragantia, 71(4):481-487, 2012. CARVALHO, G. R. et al. Comportamento de progênies
F4 de cafeeiros arábica, antes e após a poda tipo esqueletamento. Coffee Science, 8(1):33-42, 2013. CAPUCHO, A. S. et al. Development and validation of a
standart area diagram set to estimate severity of leaf rust in Coffea arabica and C. canephora. Plant Pathology, 60:1144-1150, 2011.
CUSTÓDIO, A. A. de P. et al. Comparison and validation of diagrammatic scales for brown eye spots in coffee tree leaves. Ciência e Agrotecnologia, 35(6):1067-1076, 2011. FERNANDES, A. L. T. et al. Condução das podas do cafeeiro
irrigado por gotejamento cultivado no cerrado de Minas Gerais. Enciclopédia Biosfera, 8(15):487-494, 2012. FERREIRA, A. D. et al. Desempenho agronômico de
seleções de café Bourbon Vermelho e Bourbon Amarelo de diferentes origens. Pesquisa Agropecuária Brasileira, 48(4):388-394, 2013.
FERREIRA, D. F. Sisvar: A guide for its Bootstrap procedures in multiple comparisons. Ciência e
Agrotecnologia, 38(2):109-112, 2014.
GOMES, C. A. et al. Seleção de progênies do cruzamento entre cultivares de cafeeiros Icatu e Catuaí. Ceres, 62(1):62-70, 2015.
INSTITUTO NACIONAL DE METEOROLOGIA - INMET.
BDMEP dados históricos. Available in: <http://www.
inmet.gov.br/portal/>. Access in: 25 abril 2019.
JAPIASSÚ, L. B. et al. Ciclos de poda e adubação
Nitrogenada em lavouras cafeeiras conduzidas no sistema “safra zero”. Coffee Science, 5(1):28-37, 2010.
MATIELLO, J. B. et al. Cultura de café no Brasil: Manual de recomendações. Fundação Procafé, Varginha, 2015. 585p. NADALETI, D. H. S. et al. Productivity and sensory
quality of arabica coffee in response to pruning type “esqueletamento”. Journal of Agricultural Science, 10(6):207-216, 2018.
PAIVA, R. N. et al. Comportamento agronômico de progênies de cafeeiro (Coffea arabica L.) em Varginha-MG. Coffee
Science, 5(1):49-58, 2010.
PATRICIO, F. R. A.; BRAGHINI, M. T. Efeito de Fungicidas Triazóis Sobre o Controle da Cercosporiose em Mudas de Cafeeiro. Instituto Biológico, 78(2):241-249, 2011. PETEK, M. R. et al. Seleção de progênies de Coffea arabica
com resistência simultânea à mancha aureolada e à ferrugem alaranjada. Bragantia, 65(1):65-73, 2006. REIS, E. A. C. et al. Characterization of coffee cultivars leaf
rust-resistant subjected to framework pruning. Coffee
Science, 13(1):63-70, 2018.
SILVA, V. et al. Recuperação de cultivares de café
submetidas ao esqueletamento aos quatro anos e meio de idade. Coffee Science, 11(1):55-64, 2016.
SHANER, G.; FINNEY, R. E. The effect of nitrogen fertilization on the expression of slow mildewing resistance in Knox wheat. Phytopathology, 67(8):1051-1056, 1977.
SERA, G. H. et al. Seleção para a resistência à ferrugem em progênies das cultivares de café IPR 99 e IPR 107.
Bragantia, 69(3):547-554, 2010.
SOUZA, A. G. C.; MAFFIA, L. A.; MIZUBUTI, E. S. G. Cultural and aggressiveness variability of Cercospora coffeicola.
Journal of Phytopathology, 160(10):540-546, 2012.
THOMAZIELLO, R. A. et al. Café arábica: Cultura e técnicas de produção. Campinas: Instituto Agronômico, 2000. 82p. (Boletim Técnico, 187).
VÁRZEA, V. M. P.; MARQUES, D. V. Population variability of Hemileia vastatrix vs. coffee durable resistance. In: ZAMBOLIM, L.; ZAMBOLIM, E. M.; VÁRZEA, V. M. P. (Ed.). Durable resistance to coffee leaf rust. Viçosa: UFV, 2005. p.53-74.
ZAMBOLIM, L. Current status and management of coffee leaf rust in Brazil. Tropical Plant Pathology, 41(1):1-8, 2016.