Work Project, presented as part of the requirements for the Award of a Master Degree in Finance
from the NOVA – School of Business and Economics
HOW DO EUROZONE STOCK MARKETS REACT TO ECB UNCONVENTIONAL MONETARY
POLICY ANNOUNCEMENTS? A COMPARISON ACROSS COUNTRIES
JOÃO FRANCISCO VENTURA SANTOS ALVES
#2510
A Project carried out on the International Masters in Finance Program, under the supervision of
Professor Miguel Ferreira
2
Abstract
This research applies a short-term event study methodology to estimate the abnormal returns of
the Eurozone indices around the European Central Bank’ unconventional monetary
announcements. It considers all the publicly available nonstandard policy statements between
September 2008 and the end of 2016. The ones related to Asset Purchase Programs had a
significant positive effect on the Italian, Portuguese and Spanish stock markets throughout the
entire sample while the German and Dutch indices show a negative one. Moreover, it is
observable that some indices such as the BEL20 delivered significant negative cumulative
abnormal returns when the European Central Bank announced the first tools concerning the
Provision of Liquidity during the crisis, but nowadays the reaction to this kind of events is
almost null.
3
1 – Introduction
There has been a broad discussion about the effectiveness of the conventional monetary policy
in the last decades. In a deep recession, most of the times Central Banks reach the so-called
zero lower bound (ZLB) that theoretically prevents them from lowering interest rate further
below zero because households and corporations would prefer to convert their savings into
cash. Indeed, Keynes (1936) stated that any central bank action is harmless when short-term
interest rates approach the ZLB and more recently Krugman (2003) argued that the ZLB
demands fundamental changes and defined deflation as a "black hole" where central banks
struggle to step out. However, in the 90s other theorists started to defend that there was room
for central banks being capable in long-run even when interest rates are dangerously close to
zero (e.g. Mishkin (1996)), by increasing liquidity, through the purchase of long-term assets.
In fact, in 2001 this view was reinforced by the Bank of Japan (BOJ) that introduced a massive
quantitative easing (QE) program. BOJ became the first major central bank in the modern era
to pursue masterful unconventional monetary measures with the aim of improving credit
conditions by "credit easing" and to foster the economic growth.
Unconventional Monetary Policies (UMP) can take many different forms, ranging from the
funding for a lending scheme (FLS) in UK, the purchase of Mortgage Backed Securities (MBS)
and agency debt in the US, the acquisition of different types of private assets purchases in Japan
and even the introduction of negative interest rates in Denmark. These non-conventional tools
began to be broadly used during the global financial crisis where the panic felt by investors led
to the break of the usual functioning between policy and market rates. In November 2008, the
Federal Reserve (FED) launched a massive program of long-term treasury bonds purchases (the
4
first QE), whereas ECB only started its QE in March of 2015 through the so-called Expanded
Asset Purchase Programme (Expanded APP). Until then, ECB made some attempts to stabilize
the markets through several initiatives: Long Term Refinancing Operations (LTROS) in 2008,
Covered Bonds Purchase Programme (CBBP1) in 2009, Securities Market Programme (SMP)
in 2010, Outright Monetary Transactions (OMT) in 2012. However, the impact of these tools
was, in general, limited and short-lived. The nature and the scope of measures also greatly
differed from the classic definition of quantitative easing's buy and hold. These instruments
were mostly intended to rebuild the monetary transmission channel in the euro area, to provide
liquidity to the distressed Eurozone Banks affected by the global crisis and helping peripherical
countries to lower their government bond yields when the European Sovereign Debt Crisis
started in 2010. That is why we discuss the difference between quantitative easing and credit
easing. As highlighted by Bernanke (2009), the first one increases the magnitude of central
bank liabilities to accelerate the economic growth and inflation in the economy while the second
one only intends to improve the functioning of the bond markets.
Now, it is worth asking what the relation between Monetary Policy and Stock Markets is?
According to the Discount Cash Flow Model (DCF), the price of a share is given by the
expected future net cash flows. Hence, Central Banks may have a significant impact on equity
returns either by changing the discount rate applied by the practitioners or by influencing them
about the future economic activity. More precisely, there are many ways in which
unconventional measures can affect share prices, the first one and probably the most immediate
is through the portfolio rebalancing channel. By purchasing debt securities, Central Banks will
artificially increase the demand for these instruments, thus reducing the risk premium offered
to market agents. Therefore, investors will have strong incentives to find higher returns in more
5
risky assets such as corporate shares, and consequently raising its prices. It is important to refer
that Conventional Measures are not able to achieve this effect - IMF (2013) -, and moreover,
these large-scale asset purchases also have had a tremendous impact on depreciating exchange
rates and boosting the stocks of the big exporting companies in Eurozone consequently.
Lower interest rates also incentive borrowing for consumption and investment that may also
have positive effects on the equity markets. Furthermore, it is also worth mentioning the
reduction of the default and redenomination risk across Eurozone, translating in higher returns
in more peripherical equity markets. Finally, there is an important signaling channel (OMT was
a good example of this since it was never implemented, but the power of Mario Draghi's words,
moved the markets), because Central banks have more information about the shape of the
economy than investors, Jenny Tang (2015), and some announcements will ultimately influence
the asset allocation of all market agents for the near future - Falargiada & Ritz (2015). Here the
signal of the effect on stock markets is not straightforward, meaning that more easing during a
crisis sometimes might lead to lower stock returns, given that investors may assume that future
conditions are even worse than they were expecting before the announcements - Hosono and
Isobe (2014).
In this research, a short-term event study will be addressed to measure the market efficiency
and the effect of the ECB Unconventional Monetary Policy Announcements in the different
Eurozone stock markets, using countries stock market indices and considering a larger sample
than the similar works about this topic (2008-2016).
First, this paper tries to review the existent literature about market efficiency and the effect of
Central Banks announcements on share prices. Then one may find a section with further
research about the European Central Bank interventions, stock market reactions and the
6
hypothesis of this study. After that, the empirical methodology, the events a and the data used
in this study is explained in detail. Finally, the analysis of the results, the following conclusion
and some limitations of the empirical model applied in this research.
2 – Literature Review
The efficient market hypothesis (EHM) states that news reaching to the market will be
immediately incorporated into the stock prices, meaning that an efficient market will reflect all
available information to investors. The expression "all available information" has derived in 3
different forms of EMH: weak efficiency, semi-strong efficiency and strong efficiency - Bodie
et al. (2011). The first one would imply that news are only incorporated in the prices after a
while, given that excess returns will be accumulated for a longer period. The second one means
that stock markets are rapid to incorporate new information about monetary policies, while the
third one is even more strict, stating that all monetary policy decisions are awaited and thus
already incorporated in the stock price. Therefore, this study and most of the existent literature
apply the semi-strong form, where markets will react to policy interventions in a short period.
The relation between Conventional Monetary Policy and stock market performance has been
extensively addressed in the previous literature especially in the United States of America
-Jensen and Johnson (1995), Bomfin (2003), Bernanke and Kuttner (2005). Most of the authors
found a positive reaction to expansionary monetary policies, with the response mentioned
above being stronger during "bad times." In Europe, there are also several previous studies
reporting a positive correlation between interest rate cuts and stock prices - Angeloni and
Ehrmann, (2003), Bohl et al. (2008). However, not all studies found a positive relationship
7
between expansionary initiatives and stock prices. For example, Bredit el al. (2007) stated that
the German Dax was nearly efficient at the end of last decade, not reacting to surprise
announcements, while Fioderdelisi, Gallopo, & Rocci (2014) only found evidence of market
reaction (with the nonlinear trend) when interest rates remain unchanged.
It is noticeable that most of the papers deal with a period that ends before 2008, not considering,
therefore, the spread of the global crisis and of course the special weapons that were created to
fight it. Central banks since then started to hugely intervene in the markets with monetary easing
(purchases of government and corporate bonds) and liquidity provision operations (e.g., longer
maturities for refinancing operations and extension of accepted collaterals). In fact, there are
already some studies that deal with the impact of the UMP announcements on the stock markets,
but from different standpoints, ranging from the effect in various sectors, the separation by type
of events, impact on value and growth stocks and different time horizons.
Kuhihara (2014) was one of the first scholars that studied the overall implications of the ECB's
UCP announcements on the Eurozone stock markets, concluding that Monetary Authorities
have the power to influence future interest rates, and consequently the share prices. A high
number of studies so far, consider general stock market indices, such as Hosono and Isobe
(2014), that reported a negative relationship between ECB unconventional monetary policy
surprises and stock prices. Others, like Jansen & Tsai (2010), stated that communications and
transportation companies are by far the most affected sectors by unconventional monetary
policy announcements. Moreover, Ricci (2015) concluded that European banks with riskier
assets are more sensitive to non-standard monetary policy interventions, while Fratiani &
Marchionne (2014) tried to prove that target news to the banking system are associated with
8
positive cumulative abnormal returns. From another perspective, Haitsma, Unalmis & Haan
(2016) argue that unconventional announcements have a greater effect on the value stocks
comparing to the growth ones. Since this empirical work uses different sub-samples, some
researchers also intend to analyze the shocks in distinct temporal windows. Apparently,
according to Hayo & Niehof (2011), there was no significant change between the pre-crisis and
the financial crisis, while Wang & Mayes (2012) states that there were adverse reactions to
surprise announcements before the crisis, and then this pattern changed afterward. Finally,
Rogers, Scotti & Wright (2014) found that there is evidence of a greater impact of
non-conventional measures on the stock market, contrasting to non-conventional announcements.
3 – Research Question and Hypothesis
This study provides more details about the construction of the events in the fifth chapter.
Nevertheless, one may find in this study three different subsamples: Global Crisis, European
Sovereign Debt, and Latest ECB Monetary Policies. There is also a distinction between two
types of unconventional policies: Asset Purchase Programs and Provision of Liquidity.
In a first stage, the ECB's policy was mainly oriented to provide liquidity on a grand scale to
European Banks that were massively affected by the Global Crisis. To do so, the ECB among
others, increased the average maturity of its refinancing operations, it eased the collateral
requirements and provided liquidity at a fixed rate and full-allotment basis after the Lehman
Brother's fall in September 2008. Apart from these operations, ECB also launched its first
outright asset purchase program called CBPP1, which was designed to buy covered bank bonds
9
(an important market for banking finance), to repair the monetary transmission channel in the
European Union.
Meanwhile, most of the investors became concerned about the excessive level of debt of the
southern countries. The initial increase of the bond yields in Greece, Portugal rapidly spread
over Italy and Spain due to banks bailout and austerity policies. In the spring of 2010, the
Governing Council announced the SMP, which enabled the ECB to buy public and private
bonds. The conditions in the second half of 2011 worsened even more, and some of the previous
liquidity provision operations were prolonged and reintroduced - ECB (2011). These measures
were further extended in 2012 since the yields were still very high and the Governing Council
decided to substitute the SMP by the OMT on 2th of August.
By the time, none of these measures were regarded as pure quantitative easing, since all the
purchases were fully sterilized. In the first stage, the key interest rate of ECB was not close to
the ZLB and all Central Bank's actions were limited by the Lisbon Treaty that did not allow
sovereign bailouts or monetary financing. In fact, Constancio (2011) mentioned that ECB had
always been ruled by a "separating principle", which means that conventional and
unconventional instruments had different goals. As such, the alternative measures adopted by
the ECB were regarded as a complement to the use of the interest rate in signaling the monetary
policy stance - Cour-Thirmann & Winkler (2013). Nevertheless, as referred by Belke (2013),
these non-standard measures were successful to help the Eurozone banks with substantial losses
in impairments and to alleviate the cost of debt of the peripheral countries. In 2013 the risk of
the break-up of the euro area was already behind us as it can easily be proved by the high
interbank market recover and the low level of European yields (see appendix). However, some
10
entities like the German Central Bank have always been against non-standard tools, since they
leave more room for the most indebted countries such as Portugal, Spain, and Italy to postpone
the much-needed structural reforms. It is kind of intuitive that a higher debt leads to higher
yields (e.g., Ardagna et al. (2007) and Laubach (2009)), but we have witnessed the opposite
phenomenon in the past few years. The Eurozone yields have been consistently decreasing since
2012, while the public debt in some European countries has been raising to date. Some papers,
as Falagiarda & Reitz (2015), conclude therefore that SMP, OMT and other similar
interventions had an enormous contribution to "artificially" inverse this relationship.
At the end of 2013, the inflation and high unemployed turned to be a real issue in Europe. When
Mario Draghi finally recognized the perverse effects that deflationary tendencies could have
brought to Europe, the ECB intervened again more aggressively in the markets. At first, the
ECB launched the APP (Asset-Backed Securities Purchase Programme (ABSPP) and CBPP3)
in 2014. After that, between 2015 and 2016 Mario Draghi announced its Expanded version,
including non-sterilized purchases of Government and Corporate Bonds (PSPP and CSPP
respectively) with the aim of raising inflation and fostering economic growth. The Expanded
APP was extended three times until the end of 2016 (in size and and/or duration).
Over again, most of the literature nowadays focuses on the effect of UMP announcements on
the sovereign bonds yields. Not only Krishnamurthy et al. (2014) found that default risk was
the dominant channel in which the SMP and OMT had a significant role in decreasing the yields
of Italy, Portugal, and Spain, but also Rivolta (2015) observed that the effects of the
unconventional measures on the bond yields vary between countries and time, concluding that
LTROS (provision of liquidity) reduced yields of sovereign bonds of larger countries as France
11
and Italy and the most relevant effects were achieved when ECB announced the CBPP (1 &2)
and the SMP. Mateo and Falagiarda (2015) also state that the announcements made between
2010-2013 (European sovereign debt crisis) had a larger effect on Italian yields than the ones
made after the Lehman Brother's fall. Moreover, this author says that CBPP, the SMP, and
OMT were the most effective programs in reducing the spread between the Italian and German
long-term bonds. In this way, Krishnamurthy et al. (2014) also argue that the most evident
decreases in yields are found around the SMP and OMT announcement dates but did not find
any reaction for the LTROS in GIIPS countries (Greece, Ireland, Italy, Portugal and Spain).
Finally, another interesting finding is the one of Ricci (2015) that explains different reactions
to similar interventions in the markets, giving as an example the fact of the provision of
liquidity, which shows adverse response during the Global Crisis and a positive one throughout
the European Sovereign Debt Crisis.
Nevertheless, some results might be extended to the stock market as well. However, most of
the papers cover the time range between 2008-2012 and some of them have opposite
conclusions. Rogers et al. (2014) highlight that UCP announcements had positive stock
reactions during the crisis, whereas Hosono and Isobe (2014) argues that stock market reacted
negatively to surprise announcements because investors could have thought that the economic
conditions were even worse. In addition, Fiordesi et al (2014) state that the largest impact on
the stock market was observed during the European Debt Crisis and Van Hilten (2016) found
that most of the countries' stock markets reacted in the same way, excepting from Greece
(probably due to its sovereign crisis that developed independently of the external factors as
mentioned by Gonzalez-Hermosillo and Johnson (2014)). Furthermore, the last author observed
that peripheral countries show much larger and more significant event day returns than northern
12
countries during the sovereign crisis, providing some evidence of the decrease in default and
redenomination risk of Italy, Portugal, and Spain. Another relevant study is the one of Pinto de
Sousa that applies an event study to analyze the impact of UMP news in stock prices,
concluding again that Italy Spain and Portugal showed consistent positive cumulative abnormal
returns, while the reaction of other countries was most of the times negative. To my knowledge,
there is no research considering the overall effect of the Expanded APP on the Eurozone stock
markets. Although there are some articles - ECB (2014) - explaining that the ABSPP was
limited both in scope and in size (the market in Europe for this kind of assets is incredibly small)
and some others analyzing individual events. For instances, Geordadis (2016) studied the effect
of the EAPP announcement (22nd of January) on the global financial markets, concluding that
even though this event was already anticipated by the markets, the enormous size of the
purchases constituted a surprise factor that excited the markets around that day.
As it was mentioned before, this paper will assume a semi strong version of the EHM, meaning
that it expects that stock prices react in a manner of days (even one day) to the announcements.
Overall, the announcements about Asset Purchase Programs might have had a higher effect
than the ones regarding the provision of liquidity. Concerning the first two samples, the surprise
announcements mainly happened during the European sovereign debt crisis - again Rogers et
al. (2014) – therefore, this empirical works expects higher effects on the stock market during
this sample. However, since the first unconventional measures implemented by the ECB were
related to liquidity injections, it is presumable that those announcements had a bigger impact
during the global crisis. Moreover, SMP and OMT were the very first tools related to sovereign
bonds purchases, hence this study expects a positive correlation between these events and the
stock markets in the southern European countries apart from Greece - again
Gonzalez-13
Hermosillo and Johnson (2014) - due to the fall of the redenomination risk. Previous in this
discussion it was also mentioned that German Central Bank had always been against
non-standard tools since UMP are associated with complacency in the reform agenda of the GIIPS
and financial stability of the Eurozone. Thus, the stock markets in Germany and maybe in some
other wealthier countries like Netherlands might react negatively to most of the announcements.
Regarding the latest sub-sample, this papers expects a greater reaction about the PSPP
(especially the first announcement) and almost no correlation between the stock market and
other programs' announcements (ABSPP, CBPP3 and CSPP), meaning that the Expanded APP
as a whole, should have had a lesser impact than the Purchase Programs held during the
sovereign crisis.
4 – Empirical Methodology
The event study methodology was introduced by Fama in 1969, and it has been widely used in
the finance literature. The short-term event study applied in this research, as referred by
Bernanke (2002), provide us a robust estimate of the market's response to monetary policy
announcements, and it also allows us to work with a tiny sample of events - Yacine Ait-Sahalia
(2012). Furthermore, there are also some pitfalls regarding long-term measurement, including
the fact of multiple events occur in the post-event window - Kothari & Warner (2007). The
primary goal this method is to verify whether the realized returns are consistent with the
expected returns or they can be regarded as abnormal in a significant way - Rivolta (2015).
Choosing the length of the event windows is also a major issue, bearing that in mind this
research defines a very narrow event window (0;0) where it only cares about the abnormal
returns calculated on the day of the announcement, to avoid the noise of other exogenous
14
announcements. As a robustness check it was also built another two event windows ((-1;1);
(-2;2)) with the corresponding relaxation of the contamination screen to study a possible
delayed and an anticipated reaction of the investors. It is relevant to say that the event date is
the exact date on which the event was announced, and this is the first trading day the information
became public. In this sample, there are three cases when the events were announced on a
non-trading day (public holidays in Greece and Austria), so the next non-trading days were used as the
event day.
4.1 CAR
The idea of calculating abnormal returns (ARs) is to measure the abnormality by separating the
event from other market events. The ARs, of ECB i and event T, are defined as the difference
between the return and the expected return (normal return), given the absence of the event in a
predefined estimation window:
𝐴𝑅
𝑖,𝑇= 𝑅
𝑖;𝑇− 𝐸[𝑅
𝑖,𝑇|𝛺
𝑖,𝑇]
(4.1.1.a)
For the wider windows, this research calculates the cumulative abnormal returns (CAR)
measure. This measure accumulates abnormal returns across time and is defined as:
𝐶𝐴𝑅
𝑖(𝑇1,𝑇2)= ∑
𝐴𝑅
𝑖,𝑡 𝑇2𝑡=𝑇1
(4.1.1.b)
4.2 Model
A market model is applied with the parameters being obtained with daily log returns of each
country’s index and a broad European benchmark Euro Stoxx Total Market over a 252-day
estimation window and ending 15 days before each event. The market model is built upon the
assumption of a constant and a linear relationship between the asset returns and the returns of
the market index, such that:
15
with
𝐸[𝜀
𝑖,𝑇] = 0 ,
(4.2.b)
and
𝑉𝐴𝑅[𝜀
𝑖,𝑇] = 𝜎
𝜀,𝑖2(4.2.c)
Additionally, the model parameters in the estimation window are estimated by ordinary least
squares (OLS) regressions. One may wonder why neither CAPM nor multi factor models were
used instead, but Brown and Warner (1980 and 1985) showed that results based on this model
are not substantially different from the ones obtained with more complex models, considering
narrow event windows. As a robustness check (see appendix) this paper achieves similar results
with the same market model (Scholes & William's Estimation) and with the return model, that
can be defined as a limited market model with and beta equal to one for each stock - MacKinlay
(1997). Gregory O’ Donohoe (2014) stated that the later model is used to validate the results
since it works well when relevant events are likely to be included in the estimation window -
or when the crisis period is included in the sample - Fuller, Netter, and Stegemoller (2002).
There are also similar studies using the heteroscedasticity-based approach of Rigobon and Sack
(2004). However, Rosa (2011) empirically proved that even though simple event-study models
contain bias, this bias is relatively small and the OLS approach tends to outperform the Rigobon
and Sack method for any sample, thus concluding that event-study methodology should always
be preferred. Finally, this paper disregards the addition of a surprise factor to the model because
as it was mentioned before by Rogers at al. (2014), most of the surprise announcements were
held during the sovereign crisis.
4.3 Significance test – T-test
This study uses the student’s t-test developed by Student (1908). The null hypothesis is that the
Cumulative Average Abnormal Return (CAAR) are not different from zero. The alternative
hypothesis is that they are significantly different from zero.
16
5 – Data and Event Sample
This paper uses daily data since it is the most efficient way to deal with the effects of UCP on
financial variables - Rogers at al. (2014). Data covering the different countries' indices and the
market benchmark was retrieved from Bloomberg. The data found in the appendix was taken
from Thompson and Reuters Database stream.
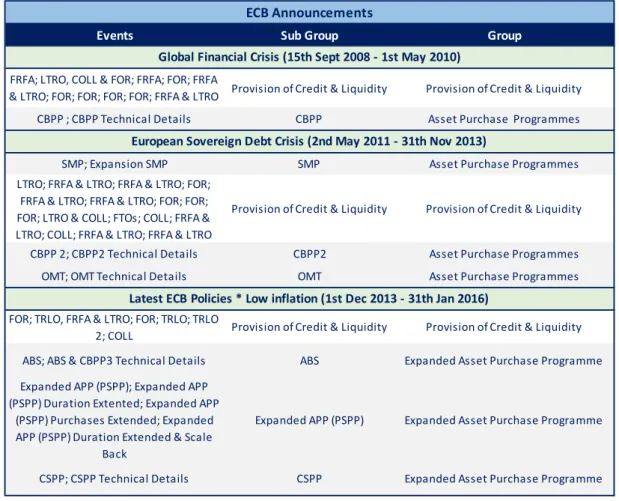
All the events were collected from the ECB's press releases. The first sub sample (Global Crisis)
starts on 15th of September 2008 (when the Lehman Brothers collapsed) and runs until the first
of May 2010. The second sub-period (European Sovereign Debt Crisis) starts on the 2nd of
May (when the IMF agreed on a bailout to rescue Greece) and goes until the end of November
2013. The latest one starts on the first day of December 2013 (where the Eurozone inflation
rate was already below 1%) and runs until the end of 2016.The events are separated into two
groups: Asset Purchase programs and Provision of Liquidity. While the programs of the first
group were already discussed before, the second one needs to be clarified. So, this group
includes the following non-conventional tools: FRFA or fixed rate tenders with full allotment
for the main refinancing operations; LTROs or Longer Maturities for Refinancing Operations;
COLL or Extensions of the list of collateral assets; FOR or Liquidity provisions in foreign
currencies through swap lines with other central banks and TLROs or targeted longer-term
refinancing operations. By using an event study methodology, we need to deal with the problem
of the overlapping events. In this sample, it is noticeable that there are some event days where
conventional monetary policies also take place (see appendix). Secondly, that different tools of
the provision of liquidity are announced on the same day (here it is not an issue since there is
no distinction between them). Thirdly there are some event days where both asset purchases
17
and provision of liquidity's tools were announced simultaneously (the only serious case is the
one related to the announcement of CBPP1). This work follows a similar method used by
Rivolta (2012), that considers the Asset Purchase Programs as the main events, dropping all
other announcements if they were held simultaneously (e.g., provision of liquidity and
conventional tools).
Table 1 – ECB’s Announcements
6 – Analysis
This chapter intends to test the hypothesis mentioned in chapter three through a short-event
study. This paper will analyze each sub-period separately, and then, in the end, it will have the
Events Sub Group Group
FRFA; LTRO, COLL & FOR; FRFA; FOR; FRFA
& LTRO; FOR; FOR; FOR; FOR; FRFA & LTRO Provision of Credit & Liquidity Provision of Credit & Liquidity
CBPP ; CBPP Technical Details CBPP Asset Purchase Programmes
SMP; Expansion SMP SMP Asset Purchase Programmes
LTRO; FRFA & LTRO; FRFA & LTRO; FOR; FRFA & LTRO; FRFA & LTRO; FOR; FOR; FOR; LTRO & COLL; FTOs; COLL; FRFA & LTRO; COLL; FRFA & LTRO; FRFA & LTRO
Provision of Credit & Liquidity Provision of Credit & Liquidity
CBPP 2; CBPP2 Technical Details CBPP2 Asset Purchase Programmes
OMT; OMT Technical Details OMT Asset Purchase Programmes
FOR; TRLO, FRFA & LTRO; FOR; TRLO; TRLO
2; COLL Provision of Credit & Liquidity Provision of Credit & Liquidity ABS; ABS & CBPP3 Technical Details ABS Expanded Asset Purchase Programme Expanded APP (PSPP); Expanded APP
(PSPP) Duration Extented; Expanded APP (PSPP) Purchases Extended; Expanded APP (PSPP) Duration Extended & Scale
Back
Expanded APP (PSPP) Expanded Asset Purchase Programme
CSPP; CSPP Technical Details CSPP Expanded Asset Purchase Programme Source: ECB Press Releases
ECB Announcements
Global Financial Crisis (15th Sept 2008 - 1st May 2010)
European Sovereign Debt Crisis (2nd May 2011 - 31th Nov 2013)
18
aggregated results of the sample for the two different groups: Asset Purchase Programs and
Provision of Credit & Liquidity.
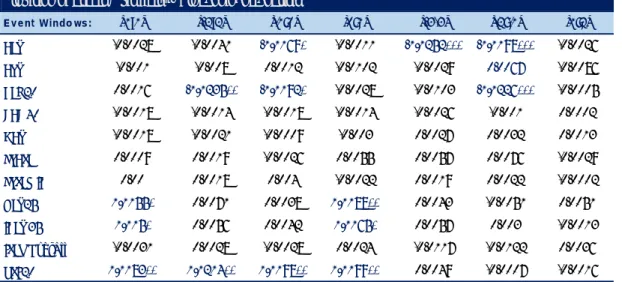
Global Crisis
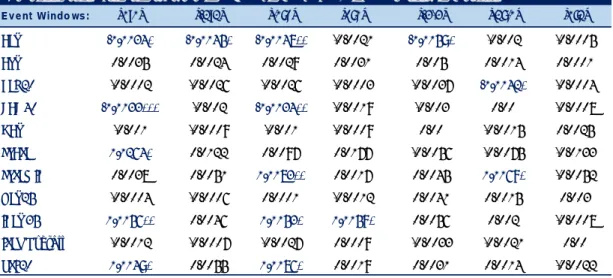
Table 2 – ResultsThe labeled sub-sample “Global Crisis” that starts after the Lehman Brother’s fall is also known
by the appearance of the first wave of unconventional measures introduced by ECB, mostly
concerning the provision of liquidity. It is observable a significant underperformance of the
AEX and BEL 20, consistent with the findings of Hosobo and Isabele (2014). It is also worth
pointing out the strong anticipation reaction of the both indices especially for the Dutch
benchmark that has a strong significant abnormal return for the window (-2;-1). Conversely, the
results of the HEX 25, IBEX 35 and PSI 20 show significant positive evidence against the null
hypothesis, being stronger for the Portuguese index. Contrary to AEX and BEL 20, these stock
markets do not seem to have anticipated these events, since the (0,0) is the window with the
most statistically robust abnormal returns.
Provision of Credit & Liquidity - Global Financial Crisis
Event Windo ws: [0;0] [-1;1] [-1;0] [0;1] [-2,2] [-2;-1] [1;2] AEX -0.0028 -0.0041 -0.0058* -0.0011 -0.0141*** -0.0087*** -0.0026 ATX -0.001 -0.008 0.0012 -0.0102 -0.0029 0.0067 -0.0086 BEL 20 0.0016 -0.0124** -0.0081* -0.0028 -0.0103 -0.0115*** -0.0005 CAC 40 -0.0018 -0.0014 -0.0018 -0.0014 -0.0026 -0.001 0.0002 DAX -0.0018 -0.0021 -0.0009 -0.003 0.0027 0.0032 0.0013 FTASE 0.0009 0.0019 -0.0026 0.0055 0.0057 0.0076 -0.0029 FTSEMIB 0.00 0.0018 0.004 -0.0022 0.0019 0.0022 -0.0002 HEX25 0.0044* 0.0071 0.0038 0.0077** 0.0043 -0.0051 0.0051 IBEX 35 0.004* 0.0056 0.0042 0.0054* 0.0057 0.003 -0.0013 ISEQ Overall -0.0031 0.0028 -0.0028 0.0024 -0.0117 -0.0122 0.0036 PSI 20 0.0072** 0.0103** 0.0087** 0.0088** 0.0049 -0.0007 -0.0016
*** 99% significance level, **95% significance level, *90% significance level
19
Table 3 - ResultsAlthough the CBPP1 could have been included in the previous group since its first goal was to
provide liquidity to the distressed European banks, it was the first program introduced by the
ECB meant to purchase assets. It is relevant to say that the communication of this tool was
divided in two announcements: the program itself and its technical details. The most significant
market reaction is found in the first announcement, even though there is no clear trend. Contrary
to the previous findings, the BEL 20 shows overperformance in the shortest windows.
Furthermore, PSI 20 keeps over performing but reveals some anticipation effect.
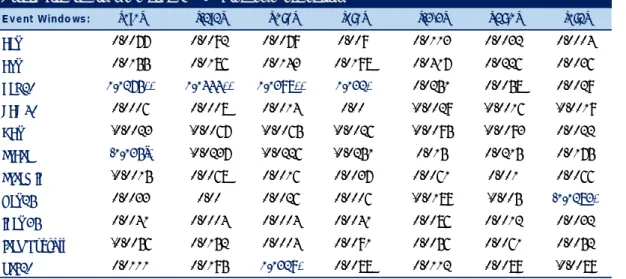
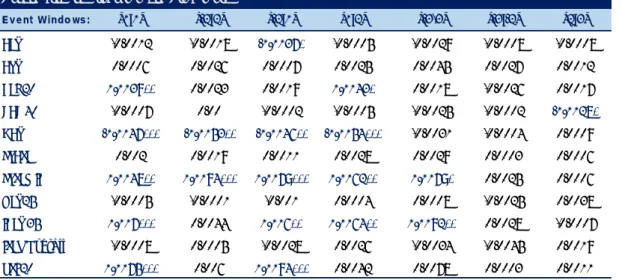
European Debt Crisis
This was the period where we observed more surprise announcements, mostly intended to
decrease the sovereign yields of the most indebted countries at the time. Then, as it was largely
expected, the asset purchase programs especially the SMP had positive reactions of the markets
in Italy, Spain, and Portugal. Even though this study focuses on very short windows, it is
noticeable a both anticipated and delayed effect of these announcements on the previous
indices, supporting evidence of a rebalancing portfolio effect. Moreover, it seems that these
Asset Purchase Programmes (CBPP 1) - Global Financial Crisis
Event Windo ws: [0;0] [-1;1] [-1;0] [0;1] [-2,2] [-2;-1] [1;2] AEX 0.0077 0.0092 0.0079 0.009 0.0113 0.0032 0.0004 ATX 0.0155 0.0186 0.0143 0.0198 0.0417 0.0226 0.0036 BEL 20 0.0164** 0.0333** 0.0287** 0.021* 0.0251 0.0058 0.0029 CAC 40 0.0006 0.0008 0.0014 0.00 -0.0029 -0.0016 -0.0019 DAX -0.0023 -0.0067 -0.0065 -0.0026 -0.0095 -0.0093 0.0022 FTASE -0.024`* -0.0237 -0.0226 -0.0251 0.015 0.0215 0.0175 FTSEMIB -0.0015 0.0068 0.0016 0.0037 0.0061 0.001 0.0066 HEX25 0.0033 0.00 0.0026 0.0006 -0.0189 -0.005 -0.0172* IBEX 35 0.0041 0.0004 0.0004 0.0041 0.0086 0.0012 0.0032 ISEQ Overall -0.0056 0.0152 0.0004 0.0091 0.0056 0.0061 0.0052 PSI 20 0.0111 0.0195 0.0218* 0.0088 0.0112 0.0089 -0.0089
*** 99% significance level, **95% significance level, *90% significance level
20
events are associated with negative CAARs in the German and Dutch stock markets which it
was also expected since the German Central Bank was always tried to rule out this kind of
sovereign bailouts.
Table 4 - Results
Table 5 - Results
Overall, liquidity tool’s announcements did not have a significant effect on the markets,
despites the BEL 20 that shows the same trend identified in the previous sample.
Asset Purchase Programmes (SMP, CBPP2 & OMT) - European Sovereign Debt Crisis
Event Windo ws: [0;0] [-1;1] [-1;0] [0;1] [-2,2] [-2;-1] [1;2] AEX -0.0028* -0.0034 -0.0047** -0.0014 -0.0051 -0.0006 -0.0017 ATX -0.0078** -0.0025 -0.0062 -0.0042 -0.0038 0.0014 0.0026 BEL 20 0.0022 -0.0015 -0.0012 0.0019 0.0015 -0.0048* 0.0041 CAC 40 0.0009 0.0024 0.0022 0.0011 -0.0018 0.00 -0.0027 DAX -0.0073*** -0.0077*** -0.0057** -0.0093*** -0.0049 0.004* -0.0015 FTASE -0.0071 -0.0033 -0.0025 -0.0078 0.0108 0.0038 0.0141 FTSEMIB 0.0054** 0.013*** 0.0084** 0.01*** 0.0103* -0.0015 0.0064* HEX25 -0.0018 0.0007 -0.0034 0.0023 0.0037 -0.0063 0.0119* IBEX 35 0.0086*** 0.0055 0.0077* 0.0064 0.0113* 0.0044 -0.0018 ISEQ Overall 0.0015 -0.0027 -0.004 0.0027 -0.0058 -0.0106 0.0033 PSI 20 0.0082*** 0.0023 0.0048 0.0057 0.0128* -0.0042 0.0088*
*** 99% significance level, **95% significance level, *90% significance level
Market Model (OLS Estimation) - Benchmark: Euro Stoxx TMI
Provision of Credit & Liquidity - European Sovereign Debt Crisis
Event Windo ws: [0;0] [-1;1] [-1;0] [0;1] [-2,2] [-2;-1] [1;2] AEX -0.0001 -0.0005 -0.0005 0.00 -0.0005 -0.0011 0.0007 ATX 0.0018 0.0013 0.0025 0.0007 0.0031 -0.001 0.0023 BEL 20 -0.0015 -0.0029* -0.0026* -0.0019 -0.0047** -0.0023* -0.0008 CAC 40 -0.0002 -0.0016 -0.0007 -0.0011 -0.0017 -0.0009 -0.0006 DAX -0.0003 0.001 0.0018 -0.0011 0.0014 0.0024* -0.0007 FTASE 0.0002 -0.0009 0.0036 -0.0042 0.0185 0.0015 0.0168** FTSEMIB -0.0012 -0.0028 -0.0025 -0.0015 -0.0045 -0.0012 -0.002 HEX25 0.0016 0.001 0.0017 0.001 0.0021 0.0004 0.000 IBEX 35 0.0002 0.0013 -0.0003 0.0017 -0.001 -0.0003 -0.0009 ISEQ Overall -0.0003 -0.0001 -0.0004 0.000 0.0016 -0.0002 0.0021 PSI 20 -0.0008 0.0006 -0.0008 0.0006 -0.0004 -0.0001 0.0005
*** 99% significance level, **95% significance level, *90% significance level
21
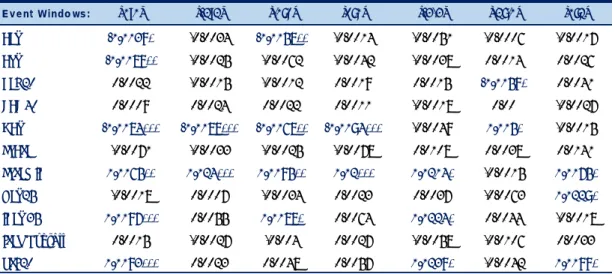
Latest ECB Policies
Table 6 - Results
Table 7 - Results
Concerning this last period, it is possible to verify the inexistence of any market reaction about
liquidity tool's announcements. Regarding the expanded asset purchase program, the trend is
more or less similar to the one found in the last sample (CAC 40 shows significant negative
CAARs), but the results are not strongly significant. One of the main reasons might be the fact
that the markets almost did not react to the ABSPP, CBPP3 and CSPP's announcements (see
Provision of Credit & Liquidity - Latest ECB Policies
Event Windo ws: [0;0] [-1;1] [-1;0] [0;1] [-2,2] [-2;-1] [1;2] AEX -0.001 -0.0006 -0.0002 -0.0013 0.0009 0.0023 -0.0005 ATX -0.0007 -0.0044 0.0006 -0.0057 -0.0001 0.0033 -0.0027 BEL 20 0.0007 0.0017 0.0032 -0.0008 -0.0001 0.001 -0.0018 CAC 40 0.001 0.0005 0.0006 0.0009 0.0002 -0.0001 -0.0007 DAX -0.0013 0.0006 0.0006 -0.0013 -0.0001 0.0012 0.000 FTASE -0.0013 0.011 0.0076 0.0021 0.0119 0.007 0.0062 FTSEMIB 0.0029 0.0033 0.0007 0.0055 0.0059 -0.0012 0.0041 HEX25 0.0009 -0.0025 -0.0007 -0.0009 -0.0004 0.0001 -0.0014 IBEX 35 -0.0028 -0.0035 -0.0041 -0.0022 -0.004 -0.0028 0.0016 ISEQ Overall -0.0021 -0.0052 -0.0019 -0.0053 -0.0044 0.0003 -0.0027 PSI 20 -0.0015 0.001 0.0016 -0.0021 -0.0004 0.0008 0.0002
*** 99% significance level, **95% significance level, *90% significance level
Market Model (OLS Estimation) - Benchmark: Euro Stoxx TMI
Expanded Asset Purchase Programme (ABSPP3, CBPP3, PSPP & CSPP) - Latest ECB Policies
Event Windo ws: [0;0] [-1;1] [-1;0] [0;1] [-2,2] [-2;-1] [1;2] AEX -0.0023* -0.0034* -0.0037** -0.0021 -0.0049* -0.002 -0.0005 ATX 0.0035 0.0024 0.0029 0.0031 0.005 0.0014 0.0001 BEL 20 -0.0002 -0.0026 -0.0026 -0.0003 -0.0037 -0.0031* -0.0004 CAC 40 -0.0022*** -0.002 -0.0023** -0.0019 -0.003 0.00 -0.0008 DAX -0.001 -0.0009 -0.001 -0.0009 0.00 -0.0015 0.0025 FTASE 0.0153* 0.0122 0.0097 0.0177 -0.0056 -0.0075 -0.0133 FTSEMIB 0.0038 0.0051 0.0072** 0.0017 0.0045 0.0058* -0.0052 HEX25 -0.0004 -0.0006 0.0001 -0.0012 0.0041 0.0015 0.003 IBEX 35 0.0045** 0.0046 0.0042* 0.0048* 0.0056 0.002 -0.0008 ISEQ Overall -0.0012 -0.0007 -0.0027 0.0009 -0.0033 -0.0021 0.00 PSI 20 0.0039* 0.0055 0.0075* 0.0019 0.0031 0.0014 -0.0022
*** 99% significance level, **95% significance level, *90% significance level
22
appendix). Notwithstanding, the most significant event of all sample is when the ECB
announced the PSPP on the 22nd January of 2015. The market reaction was massive in all
countries (see appendix), and the results show both anticipated and delayed effects. The latest
announcements concerning its expansion seem to have been priced before by the market agents.
All Sample
Table 8 - Results
Table 9 - Results
Provision of Credit & Liquidity - All Sample
Event Windo ws: [0;0] [-1;1] [-1;0] [0;1] [-2,2] [-2;-1] [1;2] AEX -0.0012 -0.0018 -0.0023* -0.0006 -0.0048** -0.003** -0.0006 ATX 0.0003 -0.0029 0.0016 -0.0042 0.0004 0.0024 -0.0023 BEL 20 0.00 -0.0053*** -0.0034** -0.0019 -0.0058** -0.0048*** -0.0009 CAC 40 -0.0005 -0.0011 -0.0008 -0.0008 -0.0017 -0.0008 -0.0004 DAX -0.001 -0.0002 0.0006 -0.0018 0.0016 0.0025** 0.0001 FTASE 0.0002 0.0023 0.002 0.0005 0.0113 0.0041 0.007 FTSEMIB 0.00 0.00 0.0003 -0.0004 -0.0004 0.00 -0.0003 HEX25 0.0025** 0.0024 0.002 0.0029* 0.0024 -0.0016 0.0015 IBEX 35 0.0009 0.0019 0.0005 0.0023 0.0007 0.0003 -0.0006 ISEQ Overall -0.0015 0.00 -0.0014 -0.0001 -0.0044 -0.0045 0.0017 PSI 20 0.0018 0.004 0.0029 0.0029 0.0015 -0.0001 -0.0003
*** 99% significance level, **95% significance level, *90% significance level
Market Model (OLS Estimation) - Benchmark: Euro Stoxx TMI
Asset Purchase Programmes - All Sample
Event Windo ws: [0;0] [-1;1] [-1;0] [0;1] [-2,2] [-2;-1] [1;2] AEX -0.0012 -0.0018 -0.0026* -0.0005 -0.0029 -0.0008 -0.0008 ATX 0.0006 0.0026 0.0007 0.0025 0.0045 0.0027 0.0012 BEL 20 0.0028** 0.0023 0.0019 0.0032* 0.0018 -0.0026 0.0017 CAC 40 -0.0007 0.00 -0.0002 -0.0005 -0.0025 -0.0002 -0.0017* DAX -0.0036*** -0.0042** -0.0035** -0.0043*** -0.0031 -0.0004 0.0009 FTASE 0.002 0.0019 0.0011 0.0028 0.0029 0.0003 0.0006 FTSEMIB 0.0037** 0.0083*** 0.0069*** 0.0051** 0.0069* 0.0025 0.0006 HEX25 -0.0005 -0.0001 -0.001 0.0004 0.0008 -0.0025 0.0038 IBEX 35 0.006*** 0.0044 0.005** 0.0053** 0.0081** 0.0028 -0.0007 ISEQ Overall -0.0008 0.0005 -0.0028 0.0026 -0.0034 -0.0045 0.0019 PSI 20 0.0064*** 0.006 0.0083*** 0.0042 0.0078 0.0003 0.0011
*** 99% significance level, **95% significance level, *90% significance level
23
Finally, this paper studies the market reaction to the two different types of unconventional
policies for all sample (see tables above) and one may observe that the overall response was
stronger when Asset Purchases Programs' announcements took place.
7 – Conclusion
The findings of this study show with empirical evidence that stock markets in the peripherical
countries (Italy, Portugal and Spain) due to the decrease in the redenomination risk, tend to
have higher cumulative abnormal returns concerning asset purchase programs' announcements.
It also proves that none of the unconventional tools had a significant impact in the Greek market
and finally some stock markets showed underperformance to surprise events during the Global
Crisis. These results are in line with the scarce existent literature. Besides, this paper also
provides a more recent sub sample that at my knowledge has not been addressed in previous
studies. First, the newest liquidity tools (including the TLROs) do not affect the markets.
Second, the investors did not pay much attention to the announcements about the ABSPP,
CBPP3 and CSPP. Third, the overall short term reaction to the PSPP announcement and its
extensions is less significant comparing to the SMP program, probably because Mario Draghi
signaled these last events further in advance. It is also important to point out that the statically
significance of the liquidity tool's announcements has decreased throughout the time.
Looking for the aggregate sample, one might draw some conclusions about the two different
groups. Regarding the provision of the liquidity, the Belgian index negatively reacted to these
announcements while the Finnish stock market showed a positive reaction. Even though the
southern equity markets showed higher CAARs for asset purchase events during the sovereign
24
crisis, this pattern still holds for the last sample whereas DAX shows an apparent
underperformance for the all sample. It is also interesting to observe that the Irish stock market
does not react to ECB, unconventional announcements, even during the sovereign crisis when
the Irish sovereign yield was above 10% which means that the rebalancing portfolio did not
play a role in this case. As a matter of consistency, the findings presented so far are in line with
the ones achieved using a different model (see appendix). Finally, all the results suggest that
European stock markets are semi efficient when unconventional measures are announced since
they respond in a short notice of the time, implying there are almost no delayed reactions on
the second day after the announcements.
This research is an important development in the literature of the stock market response to
unconventional policies announcements. However, some drawbacks relate to the methodology
applied in this study. Firstly, the period analyzed (2008-2016) had many different interventions
and some of them in the same day, implying that we needed to deal with overlapping events
and set some selection criteria to overcome this issue. Secondly, it is impossible to control other
factors that occur at the same time in different countries which might also play a role in the
stock markets. Even though this paper has some limitations, it encompasses a bigger sample
than the existent literature, and it achieves new findings.
25
8 – References
Fama, Eugene F., et al. "The adjustment of stock prices to new information." International Economic Review
1969 pp. 1-21
Mackinlay. "The econometrics of financial markets." Vol.2. Princeton, NJ: Princeton University Press, 1997.
Kothari, S.P., and Jerold B.Warner. "The econometrics of event studies." 2004
Cynthia J. Campbell, Arnold R.Cowan, Valentina Salotti. "Multi-Country Event Study Methods." Iowa State
University 11-2010.
Brett W. Fawley and Christopher J.Neely "Four Stories of Quantitative Easing." Federal Reserve Bank of
St.Louis Review, January / February 2013, 95 (1), pp. 51-58.
"Global Impact and Challenges of Unconventional Monetary Policies." International Monetary Fund
Washington, D.C.
Michael Joyce, David Miles, Andrew Scott and Dimitri Vayanos. "Quantitative Easing and Unconventional
Monetary Policy – an introduction." The Economic Journal 122 (November).
Andrew G Haldane, Matt Roberts-Sklar, Tomasz and Chris Young. "QE: the story so far." Staff Working Paper
No. 624 Bank of England
Gauti Eggertsson and Michael Woodford. "The Zero Bound on Interest Rates and Optimal Monetary Policy."
Princeton University – March 19, 2003
Giulia Rivolta. "An Event Study Analysis of ECB Unconventional Monetary Policy." Working paper n.
2014-02. Università Degli Studi di Milano.
Matteo Falagiarda, Stefan Reitz. "Announcements of ECB unconventional programs: Implications for the
sovereign spreads of stressed euro area countries." Journal of International Money and Finance 53 (2015) pp
276-295.
John H. Rogers, Chiara Scotti, Jonathan H. Wright. "Evaluating Asset-Market Effects of Unconventional
Monetary Policy: A Cross-Country Comparison. Board of Governors of the Federal Reserve System.
International Finance Discussion Papers.
Number 1101. March 2014
Ornella Ricci. "The impact of monetary policy announcements on the stock price of large European banks during
the financial crisis." Journal of Banking & Finance 52 (2015) 245-255.
"Effectiveness of the ECB program of asset purchases: where do we stand?" Policy Department An economic
and scientific policy. June 2016.
26
Appendix – Work Project –
HOW DO EUROZONE STOCK MARKETS REACT TO ECBUNCONVENTIONAL MONETARY POLICY ANNOUNCEMENTS? A COMPARISON ACROSS COUNTRIES
João Francisco Ventura Santos Alves 2510
Date Events Sub Group Group
08.10.2008* FRFA Provision of Credit & Liquidity Provision of Credit & Liquidity 15.10.2008 LTRO, COLL & FOR Provision of Credit & Liquidity Provision of Credit & Liquidity 18.12.2008 FRFA Provision of Credit & Liquidity Provision of Credit & Liquidity 03.02.2009 FOR Provision of Credit & Liquidity Provision of Credit & Liquidity 05.03.2009* FRFA & LTRO Provision of Credit & Liquidity Provision of Credit & Liquidity 19.03.2009 FOR Provision of Credit & Liquidity Provision of Credit & Liquidity 06.04.2009 FOR Provision of Credit & Liquidity Provision of Credit & Liquidity 07.05.2009* CBPP CBPP Asset Purchase Programmes 04.06.2009 CBPP Technical Details CBPP Asset Purchase Programmes 25.06.2009 FOR Provision of Credit & Liquidity Provision of Credit & Liquidity 24.09.2009 FOR Provision of Credit & Liquidity Provision of Credit & Liquidity 03.12.2009 FRFA & LTRO Provision of Credit & Liquidity Provision of Credit & Liquidity 04.03.2010 FRFA & LTRO Provision of Credit & Liquidity Provision of Credit & Liquidity
10.05.2010 SMP SMP Asset Purchase Programmes
10.06.2010 LTRO Provision of Credit & Liquidity Provision of Credit & Liquidity 02.09.2010 FRFA & LTRO Provision of Credit & Liquidity Provision of Credit & Liquidity 02.12.2010 FRFA & LTRO Provision of Credit & Liquidity Provision of Credit & Liquidity 17.12.2010 FOR Provision of Credit & Liquidity Provision of Credit & Liquidity 03.03.2011 FRFA & LTRO Provision of Credit & Liquidity Provision of Credit & Liquidity 09.06.2011 FRFA & LTRO Provision of Credit & Liquidity Provision of Credit & Liquidity 29.06.2011 FOR Provision of Credit & Liquidity Provision of Credit & Liquidity 08.08.2011 Expansion SMP SMP Asset Purchase Programmes 25.08.2011 FOR Provision of Credit & Liquidity Provision of Credit & Liquidity 15.09.2011 FOR Provision of Credit & Liquidity Provision of Credit & Liquidity 06.10.2011 CBPP2 CBPP2 Asset Purchase Programmes 03.11.2011* CBPP2 Technical Details CBPP2 Asset Purchase Programmes 08.12.2011* LTRO & COLL Provision of Credit & Liquidity Provision of Credit & Liquidity 16.12.2011 FTOs Provision of Credit & Liquidity Provision of Credit & Liquidity 09.02.2012 COLL Provision of Credit & Liquidity Provision of Credit & Liquidity
02.08.2012 OMT OMT Asset Purchase Programmes
06.09.2012 OMT Technical Details OMT Asset Purchase Programmes 06.12.2012 FRFA & LTRO Provision of Credit & Liquidity Provision of Credit & Liquidity 22.03.2013 COLL Provision of Credit & Liquidity Provision of Credit & Liquidity 02.05.2013* FRFA & LTRO Provision of Credit & Liquidity Provision of Credit & Liquidity 08.11.2013 FRFA & LTRO Provision of Credit & Liquidity Provision of Credit & Liquidity 24.01.2014 FOR Provision of Credit & Liquidity Provision of Credit & Liquidity 05.06.2014* TRLO & FRFA & LTRO Provision of Credit & Liquidity Provision of Credit & Liquidity 17.06.2014 FOR Provision of Credit & Liquidity Provision of Credit & Liquidity 03.07.2014 TRLO Provision of Credit & Liquidity Provision of Credit & Liquidity
04.09.2014* ABS ABS Asset Purchase Programmes
02.10.2014 ABS & CBPP3 Technical Details ABS Asset Purchase Programmes 22.01.2015 Expanded APP (PSPP) Expanded APP (PSPP) Asset Purchase Programmes 03.12.2015* Expanded APP (PSPP) Duration Extended Expanded APP (PSPP) Asset Purchase Programmes 10.03.2016* Expanded APP (PSPP) Purchases Extended Expanded APP (PSPP) Asset Purchase Programmes 21.04.2016 CSPP CSPP Asset Purchase Programmes 03.05.2016 TRLO 2 Provision of Credit & Liquidity Provision of Credit & Liquidity 02.06.2016 CSPP Technical Details CSPP Asset Purchase Programmes 05.10.2016 COLL Provision of Credit & Liquidity Provision of Credit & Liquidity 08.12.2016 Expanded APP Duration Extended & Scale Back Expanded APP (PSPP) Asset Purchase Programmes * the event coincides with a change of the key ECB interest rates
Source: ECB Press Releases
27
Date Events Group Description
08.10.2008* FRFA Provi s i on of Credi t & Li qui di ty
Fi xed ra te tender procedure wi th ful l a l l otment on the ma i n refi na nci ng opera tion (MROs ).
15.10.2008 LTRO, COLL & FOR, Provi s i on of Credi t & Li qui di ty
Expa ns i on of the l i s t of a s s ets el i gi bl e a s col l a tera l , encha ncement of the provi s i on of l onger-term refi na nci ng opera tions a nd provi s i on of US Dol l a r l i qui di ty through a forei gn excha nge s wa ps .
18.12.2008 FRFA Provi s i on of Credi t & Li qui di ty
The ma i n refi na nci ng opera tions wi l l continue to be ca rri ed out through a fi xed ra te tender procedure.
03.02.2009 FOR Provi s i on of
Credi t & Li qui di ty Extens i on of the l i qui di ty s wa p a rra ngements wi th the FED.
05.03.2009* FRFA & LTRO Provi s i on of Credi t & Li qui di ty
The Governi ng Counci l of the Europea n Centra l Ba nk (ECB) ha s deci ded to continue the fi xed ra te tender procedure wi th ful l a l l otment for a l l ma i n refi na nci ng opera tions , for a s l ong a s needed, a nd i n a ny ca s e beyond the end of 2009.In a ddi tion, the Governi ng Counci l deci ded to continue wi th the current frequency a nd ma turi ty profi l e of s uppl ementary l onger-term refi na nci ng opera tions a nd s peci a l -term refi na nci ng opera tions for a s l ong a s needed, a nd i n a ny ca s e beyond the end of 2009.
19.03.2009 FOR Provi s i on of Credi t & Li qui di ty
The Governi ng Counci l wi l l ca rry on conducting US dol l a r l i qui di ty-provi di ng opera tions
06.04.2009 FOR Provi s i on of Credi t & Li qui di ty
Es tabl i s hment of a tempora ry reci proca l currency a rra ngement (s wa p l i ne) wi th the Fed.
07.05.2009* CBPP As s et Purcha s e Progra mmes
Announcement of the Covered Bond Purcha s e Progra mme a nd Enha nced Credi t Support progra mme
04.06.2009 CBPP Techni ca l Detai l s
As s et Purcha s e
Progra mmes Techni ca l Detai l s of the CBPP1. 25.06.2009 FOR Provi s i on of
Credi t & Li qui di ty Extens i on of the l uqui di ty s wa p a rra ngements wi th the FED 24.09.2009 FOR Provi s i on of
Credi t & Li qui di ty
The Governi ng Counci l wi l l ca rry on conducting US dol l a r l i qui di ty-provi di ng opera tions
03.12.2009 FRFA & LTRO Provi s i on of Credi t & Li qui di ty
The Governi ng Counci l wi l l ca rry on conducting i ts ma i n refi na nci ng opera tions a s fi xed ra te tender procedures wi th ful l a l l otment for a s l ong a s i s needed, a nd to enha nce the provi s i on of l onger-term refi na nci ng opera tions .
04.03.2010 FRFA & LTRO Provi s i on of Credi t & Li qui di ty
The Governi ng Counci l wi l l ca rry on conducting i ts ma i n refi na nci ng opera tions a s fi xed ra te tender procedures wi th ful l a l l otment for a s l ong a s i s needed, a nd to enha nce the provi s i on of l onger-term refi na nci ng opera tions .
* the event coincides with a change of the key ECB interest rates Source: ECB Press Releases
28
FRFA08 10 2008 Event Windo ws: [0;0] [-1;1] [-1;0] [0;1] [-2,2] [-2;-1] [1;2] AEX -0.0205*** -0.0176** -0.0234*** -0.0147** -0.0478*** -0.0182*** -0.0091 ATX -0.0285*** -0.0888*** -0.0668*** -0.0505*** -0.0886*** -0.0392*** -0.0209* BEL 20 -0.0145** -0.047*** -0.0302*** -0.0313*** -0.0112 -0.0029 0.0063 CAC 40 -0.0018 0.0152*** 0.011*** 0.0024 0.0046 0.004 0.0023 DAX -0.0041*** -0.0169* -0.0089** -0.0121** -0.0161** -0.0015 -0.0105** FTASE 0.0108 0.035 0.0155 0.0302* 0.0821*** 0.028 0.0433** FTSEMIB -0.0049 -0.006 -0.0047 -0.0063 -0.0273** -0.0133** -0.0091 HEX25 0.0138** 0.0156 -0.0098 0.0393*** 0.0546*** -0.0261*** 0.0669*** IBEX 35 0.01** 0.0105 0.0298*** -0.0094 0.0169 0.0433*** -0.0365*** ISEQ Overall -0.0026 -0.0485* -0.0671*** 0.016 -0.0162 -0.0681*** 0.0545*** PSI 20 0.0076 0.0244 0.0013 0.0308** -0.0249 -0.0497*** 0.0172*** 99% significance level, **95% significance level, *90% significance level
Market Model (OLS Estimation) - Benchmark: Euro Stoxx TMI
LTRO, COLL & FOR15 10 2008
Event Windo ws: [0;0] [-1;1] [-1;0] [0;1] [-2,2] [-2;-1] [1;2] AEX -0.0149*** -0.0467*** -0.0437*** -0.0179*** -0.0584*** -0.0274*** -0.0161** ATX 0.0158* 0.0195 0.0465*** -0.0112 -0.0325 0.0446*** -0.0929*** BEL 20 0.0058 -0.0798*** -0.0705*** -0.0035 -0.0893*** -0.0893*** -0.0058 CAC 40 -0.0033 -0.0066 -0.0043 -0.0057 0.008 0.00 0.0114*** DAX -0.0099*** -0.0076 -0.0072 -0.0103** 0.0171** 0.0211*** 0.0059 FTASE -0.0101 -0.0112 -0.0107 -0.0106 -0.1674*** -0.0487*** -0.1086*** FTSEMIB 0.0029 -0.0043 0.0156** -0.017** 0.033** 0.0327*** -0.0026 HEX25 0.0101 0.0263** 0.0091 0.0273*** -0.0062 -0.0274*** 0.0111 IBEX 35 0.0147** 0.0293*** 0.0132 0.0308*** 0.0303** -0.005 0.0206** ISEQ Overall 0.0148 0.0442** 0.0105 0.0485** -0.0917*** -0.1015*** -0.005 PSI 20 0.0178** 0.0327** 0.0422*** 0.0083 0.0393** 0.0475*** -0.026**
*** 99% significance level, **95% significance level, *90% significance level
29
FRFA18 12 2008 Event Windo ws: [0;0] [-1;1] [-1;0] [0;1] [-2,2] [-2;-1] [1;2] AEX 0.0041 0.0074 0.0037 0.0078 -0.0094 -0.0107 -0.0028 ATX -0.0132 -0.0562** -0.0164 -0.053** -0.0112 -0.0146 0.0166 BEL 20 0.009 0.0039 0.0096 0.0033 -0.006 -0.0169 0.0019 CAC 40 -0.0073** -0.0073 -0.0093 -0.0054 -0.008 0.0033 -0.004 DAX 0.0059 -0.006 0.0025 -0.0025 -0.0002 -0.0009 -0.0052 FTASE -0.0104 0.0013 0.0008 -0.0099 -0.0195 -0.0153 0.0063 FTSEMIB 0.0067 0.022** 0.0109 0.0178** 0.0141 0.0038 0.0037 HEX25 -0.0013 0.0014 -0.0017 0.0018 -0.0044 -0.0107 0.0076 IBEX 35 0.002 0.012 0.0064 0.0076 0.0117 0.0056 0.0041 ISEQ Overall -0.0388* -0.0357 -0.0162 -0.0583** -0.0428 -0.0051 0.001 PSI 20 0.0024 0.0129 0.0182 -0.0028 0.0207 0.0096 0.0086*** 99% significance level, **95% significance level, *90% significance level
Market Model (OLS Estimation) - Benchmark: Euro Stoxx TMI FOR03 02 2009 Event Windo ws: [0;0] [-1;1] [-1;0] [0;1] [-2,2] [-2;-1] [1;2] AEX 0.0011 0.002 0.0118 -0.0086 -0.0103 0.0051 -0.0165 ATX -0.0074 -0.0183 -0.0216 -0.004 -0.0117 0.016 -0.0203 BEL 20 -0.0011 -0.013 -0.0047 -0.0095 0.0019 0.0084 -0.0053 CAC 40 -0.0007 0.0083 0.0049 0.0026 0.0061 0.0026 0.0043 DAX 0.0078 0.0146 0.0103 0.0121 0.0076 -0.01 0.0099 FTASE -0.0081 -0.0342 -0.0261 -0.0162 -0.0111 0.0236 -0.0266 FTSEMIB -0.0045 -0.0144 -0.0116 -0.0074 -0.0121 -0.007 -0.0006 HEX25 -0.006 0.01 -0.0135 0.0174 0.0103 0.0016 0.0148 IBEX 35 -0.0021 -0.0172 -0.009 -0.0103 -0.0173 -0.0019 -0.0132 ISEQ Overall -0.0157 0.0214 0.0107 -0.005 0.0253 0.0298 0.0112 PSI 20 -0.0062 -0.0162 -0.0065 -0.016 -0.0118 0.0126 -0.0181
*** 99% significance level, **95% significance level, *90% significance level
30
FRFA & LTRO05 03 2009
Event Windo ws: [0;0] [-1;1] [-1;0] [0;1] [-2,2] [-2;-1] [1;2] AEX -0.0039 0.0106 -0.0029 0.0095 -0.0014 -0.0152 0.0177 ATX 0.0134 0.0259 0.0242 0.0151 0.0492 0.0322 0.0036 BEL 20 0.0203* -0.0017 -0.0016 0.0202 0.0048 -0.0374** 0.0219 CAC 40 0.0075** 0.0163** 0.012** 0.0117* 0.0183* 0.0076 0.0033 DAX -0.0088 0.015 0.0068 -0.0006 0.0333* 0.0225* 0.0196* FTASE 0.022 -0.0025 -0.016 0.0355 0.0029 -0.038 0.0189 FTSEMIB -0.0156** -0.059*** -0.0288*** -0.0459*** -0.0863*** -0.0243** -0.0464*** HEX25 0.018** 0.0263* 0.0251** 0.0192 0.0217 -0.0005 0.0042 IBEX 35 -0.0017 -0.0175 -0.0214* 0.0022 -0.0247 -0.0142 -0.0087 ISEQ Overall 0.0319 0.0212 0.0377 0.0154 0.0169 0.0119 -0.0268 PSI 20 0.0218** 0.0252 0.0071 0.0399** 0.0135 -0.0271* 0.0187
*** 99% significance level, **95% significance level, *90% significance level
Market Model (OLS Estimation) - Benchmark: Euro Stoxx TMI FOR19 03 2009 Event Windo ws: [0;0] [-1;1] [-1;0] [0;1] [-2,2] [-2;-1] [1;2] AEX -0.0045 -0.0093 -0.0145 0.0007 -0.0187 -0.0237** 0.0095 ATX 0.0254 0.037 0.032 0.0304 0.0528 0.019 0.0085 BEL 20 -0.0117 -0.0068 -0.0144 -0.0042 -0.0019 0.0019 0.008 CAC 40 -0.0036 -0.0103 -0.0092 -0.0047 -0.0158* -0.0057 -0.0064 DAX 0.0033 0.0039 0.0029 0.0043 -0.0055 -0.0065 -0.0023 FTASE 0.031 0.0458 0.0264 0.0504* 0.0618 0.0037 0.0271 FTSEMIB 0.011 0.0453*** 0.0366*** 0.0197* 0.0756*** 0.0292*** 0.0354*** HEX25 0.0185** -0.0058 0.0135 -0.0008 -0.0211 -0.0118 -0.0278** IBEX 35 -0.0036 -0.0087 -0.0042 -0.0081 0.001 0.0085 -0.004 ISEQ Overall -0.0117 0.0191 0.00 0.0075 0.005 0.0171 -0.0004 PSI 20 0.0052 0.0065 0.016 -0.0043 0.0153 0.0155 -0.0054
*** 99% significance level, **95% significance level, *90% significance level
31
FOR 06 04 2009 Event Windo ws: [0;0] [-1;1] [-1;0] [0;1] [-2,2] [-2;-1] [1;2] AEX -0.0017 -0.0004 -0.0029 0.0009 -0.0142 -0.0082 -0.0043 ATX -0.0042 -0.0065 0.0189 -0.0295 0.0004 0.0119 -0.0073 BEL 20 0.0017 -0.0178 -0.0064 -0.0097 -0.0336 -0.0195 -0.0157 CAC 40 -0.004 -0.0129* -0.0116* -0.0053 -0.0211** -0.0114* -0.0057 DAX -0.0027 0.0024 0.0013 -0.0017 0.0092 0.0125 -0.0005 FTASE -0.003 0.0094 0.0071 -0.0007 0.064 0.0191 0.0479* FTSEMIB -0.0058 0.0052 0.0041 -0.0047 0.0134 0.0046 0.0146 HEX25 0.0097 0.0094 0.0182 0.0009 0.0009 0.0191 -0.0279** IBEX 35 0.0058 0.0185 0.0077 0.0166 0.0099 -0.004 0.008 ISEQ Overall -0.0049 -0.0157 -0.0134 -0.0072 -0.0203 -0.0223 0.0069 PSI 20 0.0128 0.0147 0.0127 0.0149 0.0077 -0.0034 -0.0017*** 99% significance level, **95% significance level, *90% significance level
Market Model (OLS Estimation) - Benchmark: Euro Stoxx TMI Covered Bonds Purchase Programme 1 (CBPP1)07 05 2009
Event Windo ws: [0;0] [-1;1] [-1;0] [0;1] [-2,2] [-2;-1] [1;2] AEX 0.0166** 0.0104 0.0139 0.0131 0.0154 0.0027 -0.0039 ATX 0.0367** 0.0351 0.0322 0.0397 0.0536 0.0192 -0.0023 BEL 20 0.0334*** 0.0595*** 0.0502*** 0.0426*** 0.0466* 0.0079 0.0053 CAC 40 0.0004 0.0003 0.0031 -0.0025 -0.0039 0.0008 -0.0051 DAX -0.0067 -0.012 -0.015 -0.0037 -0.0145 -0.0167 0.0089 FTASE -0.0162 -0.0231 -0.0125 -0.0268 0.0383 0.0465* 0.008 FTSEMIB -0.0041 0.0173 0.0029 0.0103 0.0166 0.0042 0.0165 HEX25 0.0087 0.0239 0.023* 0.0096 -0.0125 0.0095 -0.0307** IBEX 35 0.0093 0.0044 0.0052 0.0086 0.0192 0.0045 0.0054 ISEQ Overall -0.0237 -0.0269 -0.0428 -0.0078 -0.0385 -0.0191 0.0043 PSI 20 0.0247** 0.0407** 0.0407** 0.0247 0.039 0.0177 -0.0035
*** 99% significance level, **95% significance level, *90% significance level
32
CBPP1 Technical Details 04 06 2009 Event Windo ws: [0;0] [-1;1] [-1;0] [0;1] [-2,2] [-2;-1] [1;2] AEX -0.0012 0.008 0.002 0.0048 0.0071 0.0038 0.0046 ATX -0.0057 0.0021 -0.0035 0.00 0.0061 0.0021 0.0096 BEL 20 -0.0006 0.0071 0.0072 -0.0007 0.0036 0.0037 0.0004 CAC 40 0.0008 0.0012 -0.0004 0.0025 -0.002 -0.004 0.0013 DAX 0.0021 -0.0014 0.0021 -0.0014 -0.0044 -0.0019 -0.0046 FTASE -0.0319 -0.0242 -0.0328 -0.0234 -0.0269 -0.0035 0.0085 FTSEMIB 0.0011 -0.0036 0.0003 -0.0028 -0.0044 -0.0021 -0.0033 HEX25 -0.002 -0.024 -0.0177 -0.0083 -0.0253 -0.0195 -0.0038 IBEX 35 -0.0011 -0.0037 -0.0043 -0.0005 -0.0021 -0.002 0.001 ISEQ Overall 0.0124 0.0574 0.0437 0.026 0.0498 0.0313 0.0061 PSI 20 -0.0025 -0.0018 0.0029 -0.0072 -0.0165 0.0001 -0.0142*** 99% significance level, **95% significance level, *90% significance level
Market Model (OLS Estimation) - Benchmark: Euro Stoxx TMI FOR 25 06 2009 Event Windo ws: [0;0] [-1;1] [-1;0] [0;1] [-2,2] [-2;-1] [1;2] AEX 0.0029 0.0047 -0.001 0.0087 -0.0004 -0.0047 0.0014 ATX 0.0084 0.035 0.0301 0.0133 0.039 0.0143 0.0164 BEL 20 0.0041 0.0109 0.008 0.007 0.0188 0.0143 0.0004 CAC 40 -0.0029 -0.0161** -0.009 -0.0099 -0.0176* -0.0083 -0.0064 DAX -0.0038 -0.004 -0.0022 -0.0056 0.0033 0.0044 0.0027 FTASE -0.0116 -0.025 -0.0205 -0.0161 -0.0236 0.0033 -0.0153 FTSEMIB -0.001 0.001 0.0029 -0.0029 -0.0077 0.0001 -0.0068 HEX25 -0.0033 0.0199 0.0048 0.0119 0.0159 -0.0033 0.0224 IBEX 35 0.0087 0.0164 0.0112 0.0139 0.0154 0.0035 0.0032 ISEQ Overall -0.0145 -0.0083 -0.0092 -0.0136 -0.02 -0.0025 -0.003 PSI 20 0.0048 -0.0004 -0.0034 0.0078 -0.0055 -0.0102 -0.0002
*** 99% significance level, **95% significance level, *90% significance level
33
~
FOR 24 09 2009 Event Windo ws: [0;0] [-1;1] [-1;0] [0;1] [-2,2] [-2;-1] [1;2] AEX 0.0019 -0.0035 0.0023 -0.0039 -0.006 0.0003 -0.0082 ATX 0.0023 -0.0019 -0.0014 0.0018 0.0029 0.0052 -0.0047 BEL 20 0.0051 0.0088 0.0092 0.0047 -0.0053 -0.0045 -0.006 CAC 40 -0.0005 -0.0053 -0.0031 -0.0027 -0.007 -0.0045 -0.002 DAX -0.0019 -0.0067 -0.0052 -0.0034 0.0021 -0.0007 0.0048 FTASE 0.0117 0.0369 0.0327 0.016 0.0552 0.0371 0.0064 FTSEMIB 0.0042 0.0196 0.0098 0.014 0.0097 0.0018 0.0037 HEX25 -0.0107 -0.0132 -0.0101 -0.0138 -0.0112 0.0043 -0.0049 IBEX 35 0.0007 -0.0012 0.0012 -0.0017 0.0011 0.0029 -0.0026 ISEQ Overall -0.0123 -0.0054 -0.0075 -0.0102 -0.0148 0.0064 -0.0089 PSI 20 0.0079 0.0068 0.0068 0.0079 0.005 0.0034 -0.0062*** 99% significance level, **95% significance level, *90% significance level
Market Model (OLS Estimation) - Benchmark: Euro Stoxx TMI FRFA & LTRO 03 12 2009
Event Windo ws: [0;0] [-1;1] [-1;0] [0;1] [-2,2] [-2;-1] [1;2] AEX 0.0033 0.0034 0.0035 0.0033 0.0074 0.0029 0.0011 ATX -0.0027 0.0036 0.0039 -0.003 -0.0038 0.0049 -0.0059 BEL 20 0.0029 0.0086 0.0111 0.0004 0.0176 0.0167 -0.002 CAC 40 0.0007 0.005 0.0033 0.0024 0.0056 0.0008 0.0041 DAX -0.0022 -0.0071 -0.0042 -0.005 -0.0103 -0.0038 -0.0044 FTASE -0.0383** -0.0342 -0.0353 -0.0372 -0.0116 0.061** -0.0343 FTSEMIB 0.0021 0.0028 0.0002 0.0047 0.0012 -0.0021 0.0012 HEX25 -0.0037 -0.0063 -0.0005 -0.0095 -0.0096 -0.0015 -0.0045 IBEX 35 0.0023 0.0001 -0.0003 0.0027 -0.005 -0.009 0.0017 ISEQ Overall 0.0109 0.0363 0.0215 0.0257 0.0244 0.0033 0.0102 PSI 20 0.0002 -0.01 -0.0046 -0.0052 -0.013 -0.0043 -0.0089
*** 99% significance level, **95% significance level, *90% significance level