Fernanda Salloume Sampaio BONAFÉ(a)
Lucas Arrais de CAMPOS(a) João MARÔCO(b)
Juliana Alvares Duarte Bonini CAMPOS(c)
(a) Universidade Estadual Paulista – Unesp,
School of Dentistry, Araraquara, SP, Brazil.
(b) University Institute of Psychological, Social,
and Life Sciences - ISPA, William James Center for Research, Lisbon, Portugal.
(c) Universidade Estadual Paulista– Unesp,
School of of Pharmaceutical Sciences, Department of Food and Nutrition, Araraquara, SP, Brazil.
Locus of control among individuals with
different pain conditions
Abstract: The objective of this study was to evaluate the psychometric properties of the Multidimensional Health Locus of Control – Form C (MHLC-C) scale applied to a sample of adult Brazilian patients with different pain conditions. The scores were then identified and compared on each of the subscales and profiles regarding locus of control. The sample consisted of 1,149 adult individuals (79% women; mean age: 36.6 years) of which 334 reported not feeling pain in the prior 24 hours, 386 reported pain in the prior three months, 250 reported recurring pain for the prior three months or longer, and 179 reported continuous pain for the prior three months or longer. A confirmatory factor analysis was performed. The invariance of the MHLC-C was tested on independent samples. The weighted global score was calculated for each of the factors and tested using ANOVA (α = 5%). Individuals were classified according to the eight health locus of control (HLC) profiles. The factors fit the data adequately after the model was refined. A higher score for the Health Professionals HLC was found among individuals reporting less than three months of pain. The “believer in control” profile was the most prevalent among the groups, while the least prevalent profile was the “pure chance” profile. The MHLC-C was found to be valid and reliable for assessing locus of control among people with different pain conditions. Only the Health Professionals HLC factor exhibited significantly different results for these individuals. The “believer in control” profile was the most prevalent among the pain conditions considered.
Keywords: Validation Studies; Psychometrics; Epidemiologic Measurements; Internal-External Control; Pain.
Introduction
Locus of control is a concept that describes the beliefs of individuals regarding who has control and responsibility for the situations they experience.1,2 This concept has gained importance, particularly in
health care psychology research, because learning how individuals perceive situations around them can help predict their behavior in said situations.1 When applied to health care, locus of control can provide
important information for health professionals, including dentists, in their interpretation, planning, and recommendation of treatment for patients with diseases and/or other adverse conditions.3 Despite the demonstrated Declaration of Interests: The authors
certify that they have no commercial or associative interest that represents a conflict of interest in connection with the manuscript.
Corresponding Author:
Juliana Alvares Duarte Bonini Campos E-mail: [email protected]
https://doi.org/10.1590/1807-3107bor- 2018.vol32.0127
Submitted: May 07, 2018
Accepted for publication: October 16, 2018 Last revision: November 05, 2018
progress that locus of control evaluations provide in clinical practice,4 this type of evaluation is still rare
in the field of dentistry.
The literature1 informs that locus of control can
be internal or external. An internal health locus of control (internal HLC) is the belief that individuals themselves are responsible for their conditions, while an external HLC is the belief that the responsibility for a given condition can be attributed to factors that do not depend on the individual. Wallston et al.2 originally
developed two forms of the Multidimensional Health Locus of Control (MHLC) scale to identify beliefs regarding locus of control over general health (Forms A and B). Form A was created to be used on presumably healthy individuals, while Form B was developed for individuals with chronic conditions. It is important to note that, during the creation of these tools, the concept of external HLC was developed, and the influences of chance and of other people were considered.
Based on the need to evaluate the HLC in specific health conditions, Wallston et al.5 developed the third
version of the MHLC, referred to as Form C, which allows health professionals to adapt the instrument to the clinical condition of interest. This form of the MHLC derived from the authors’ belief that an individual could potentially experience different mechanisms of locus of control in different situations or conditions.5,6 The original theoretical models
supporting the use of the general scales (MHLC-A and MHLC-B) and the model for specific conditions (MHLC-C) are similar and are all supported by three subscales: Internal Locus, Chance, and Powerful Others.5 Despite the consistent use of these three
subscales or factors in the three different forms of the MHLC scale, the subscales can be applied in the MHLC-C5,7-11 in two different ways: the first is the
same method used in Forms A and B, and the second method splits the Powerful Others subscale into two correlated factors referred to as Health Professionals and Other People who control health outcomes.
Wallston11 suggests using each factor of the
instrument separately. According to the author, the evaluation of each aspect of the instrument individually can be beneficial for researchers and physicians when the objective is to investigate only one of the aspects. After the study of each individual
aspect, different HLC profiles and combinations of profiles may be established.6 The identification of
these profiles can guide decisions regarding more directed and specific clinical interventions for individual patients.6,12,13 In this study, the concept
of health in the HLC refers specifically to pain. Pain is a relevant condition in clinical practice, extended to the field of dentistry. Zucoloto et al.14
found that both chronic pain and acute pain are able to influence individuals’ perceptions of their own health, regardless of the location (orofacial or in another part of the body), and that this perception has direct consequences for patients’ self-care, efforts to seek treatment, and compliance with the treatment provided. Pain and perceptions of pain should therefore be taken into consideration by health professionals during patient evaluations.
Locus of control has been investigated in studies on many specific conditions, including pain conditions.5,10,13,15,16,17,18,19 Araújo et al.15 and
Cano-Garcia et al.18 reviewed the literature and found
that, among individuals suffering from pain, a high external locus of control is correlated with increased functional disability, increased psychological issues, increased use of health care services, negative coping strategies, increased drug abuse, and decreased physical activity. Conversely, a high internal locus of control is correlated with lower pain frequency and intensity, decreased psychological issues, higher social integration, better compliance with treatment and medical advice, better health conditions, and increased quality of life. Most studies investigating the locus of control experienced by individuals suffering from pain are mainly focused on chronic pain; however, knowing and identifying locus of control in other pain conditions is also important. Locus of control affects people’s attitude, behaviors, and response to interventions and treatments,1,3,15,17
regardless of the clinical condition or diagnosis that they may face. In the field of dentistry, no study has evaluated locus of control among individuals with different pain conditions.
Therefore, this study was performed to evaluate the psychometric properties of Multidimensional Health Locus of Control Scale – Form C (MHLC-C) applied to a sample of adult patients with different
pain conditions and then identify and compare their scores on each of the subscales and their belief profiles regarding locus of control.
Methods
Study DESIGN AND SAMPLE SIZE
This was an observational study. The sample was composed of adult individuals who sought care at the São Paulo State University (UNESP), Araraquara School of Dentistry, São Paulo, Brazil, in 2015 and 2016. Subjects included in the study were volunteers 18 years of age and older. Individuals who had sought care at the special patients clinics were excluded. The data were collected during interviews held in the waiting rooms of the clinics (Periodontics, Dentistry, Emergency, Prosthetics, Oral Medicine, and Surgery) at the School of Dentistry before patients received care. The individuals were interviewed face to face by the first author of this study and by a psychologist who had been hired for that purpose, both of whom had been properly trained.
The minimum sample size was estimated using the proposal by Hair et al.,20 which suggests the need for 5
to 10 subjects per model parameter. Considering that the theoretical models to be tested for the MHLC-C could present up to 36 parameters (18 items and 18 errors), the minimum sample size estimated was 180 to 360 individuals. Because our objective was to establish a sample of individuals with four different pain conditions (no pain, pain for less than 3 months, recurrent pain for more than 3 months, and continuous pain for more than 3 months), the total sample size needed to be between 720 and 1,440 individuals. Thus, 1,426 individuals were invited to participate. Of these, 1,214 agreed to participate (adherence rate = 85.1%) and 1,149 answered all the items of the MHLC-C (response rate = 94.6%).
Sample characterization
To characterize the sample, information on sex, age, marital status, and socioeconomic level was collected. Socioeconomic levels were estimated based on Brazilian Economic Classification Criteria.21
Individuals were classified into groups according to their pain characteristics. Therefore, the proposal
from the International Association for the Study of Pain, or IASP,22,23 was considered. The information
collected was on the presence or lack of pain within the prior 24 hours, the time of pain onset, and the temporal pattern of pain (crises/episodes vs. continuous). Individuals who reported no pain in the prior 24 hours were included in the G0 group (no pain) and answered the MHLC-C items based on their last pain experience. Individuals who reported pain in the prior 24 hours of the interview with paint onset of less than 3 months were included in the G1 group (pain <3 months). The G2 group (pain ≥3 months, recurrent) were individuals that reported pain in the prior 24 hours, with onset of 3 months or more and with crises/episodes of pain. Finally, the G3 group (pain ≥3 months, continuous) were individuals who reported continuous pain for more than 3 months. The individuals were also asked about where in their bodies the pain was located.
Multidimensional health locus of control – Form C (MHLC-C) scales
The Multidimensional Health Locus of Control – Form C (MHLC-C) was used.5 The original version of
this instrument is written in English and consists of 18 items with a 6-point Likert response format ranging from strongly disagree (1) to strongly agree (6). The Portuguese version of the instrument used in this study was published by Araújo et al.15 The
condition-specific locus of control used was individuals’ pain experience.
Face validity
The Portuguese MHLC-C15 was compared to the
original version. The idiomatic, semantic, cultural, and conceptual equivalence of the instrument was evaluated by the researchers of this study and independently by a bilingual (Portuguese-English) translator. In addition, the rules of the orthographic treaty of Portuguese-speaking countries established in 2009 was applied. The discrepancies found were discussed among the researchers. After a consensus, a provisional version was obtained in Portuguese that was tested in a pilot study.
Pilot study
This pilot study included 25 adult patients who sought care at School of Dentistry and who were interviewed in person. A total of 81% were women with an average age of 45.73 years (SD = 10.41 years). The average time required to complete the MHLC-C and the participants’ confusion over the terms/words of each item of the instrument were recorded. The average time required to complete the interview was 4.05 minutes (SD = 1.11 minutes), and all items were understood by all individuals. Based on this study, the final version of the MHLC-C was established.
Content validity
The final Portuguese version of the MHLC-C was evaluated by eight pain experts with knowledge on psychometrics who classified each item of the instrument according to its essentiality for evaluating locus of control. The content validity ratio (CVR) of the instrument was obtained according to Lawshe’s proposal.24 For decision making, the proposal by
Wilson et al. 25 was used at a significance level of 5%
(CVR 8; 0.05 = 0.693).
Psychometric properties
The fit of the factors of the MHLC-C to the sample was determined. The models tested were as follows: M1) “Internal locus of control” (items: 1, 6, 8, 12, 13, 17) M2) “Chance locus of control” (items: 2, 4, 9, 11, 15, 16) M3) “Powerful Others locus of control” (items: 3, 5, 7, 10, 14, 18).
M4) “Health Professionals locus of control” (items: 3, 5, 14) and “Other People locus of control” (items: 7, 10, 18). As mentioned previously, the Health Professionals HLC and the Other People HLC subscales were created by separating the items on the Powerful Others subscale (M3) and should, in theory, be evaluated as a correlation of factors (oblique model). After evaluating the fit of each factor to the data, the establishment of the HLC profiles must be formed by three factors: M1, M2, and either M3 or M4. The choice between M3 and M4 should be based on the fit of the models to the data.
Psychometric sensitivity
The psychometric sensitivity of the MHLC-C items was analyzed using measures of central tendency,
variability, and shape of the distribution of the participants’ responses. Absolute values of kurtosis (Ku) less than 7 and skewness (Sk) less than 3 were considered adequate.26,27 The multivariate normality
of the data was estimated using Mardia’s test.28
Construct validity
The factorial and convergent validities were estimated in order to assess the construct validity.
Factorial validity
A confirmatory factor analysis (CFA) was performed, and the maximum likelihood estimation method was applied. The goodness-of-fit chi-square ratio by degrees of freedom (χ2/df), the comparative
fit index (CFI), the goodness-of-fit index (GFI), and the root mean square error of approximation (RMSEA) were used.26,27 The fit of the model was considered
adequate when χ2/df ≤2.00, CFI and GFI ≥0.90, and
RMSEA <0.10. Items that presented factor loadings (λ) <0.50 were excluded. Correlations between the errors of the items were inserted when indicated by the modification indices calculated from the method of Lagrange multipliers (LM >11, p<0.001) and supported by the elaboration theory of each factor.27 The refined
models were identified with the letter R.
Convergent validity
The convergent validity was determined using the proposal by Fornell and Larcker.29 The estimation of the
average variance extracted (AVE) was recommended. AVE ≥0.50 was deemed adequate.20,27
Reliability
Reliability was estimated using Cronbach’s alpha coefficient (α) and composite reliability (CR). Values of CR and α ≥0.70 indicated adequate reliability 20,27.
Factorial invariance
The factorial invariance between independent samples was estimated using multi-group analysis with the chi-square difference test, or Δχ2,27 The
sample was randomized into two groups referred to as the “test sample” and the “validation sample.”
The invariance test was performed by imposing equal restrictions on the parameters of the models
of the two samples. The model presented metric invariance (weak measurement invariance) when the factor weights (λ) did not differ statistically between the two samples (Δχ2λ; p≥0.05). The model presented
scalar invariance (strong measurement invariance) when the factor weights (λ) and the intercepts (i) were invariant (Δχ2λ and Δχ2i; p≥0.05). When the invariance
of the factor weights (λ), intercept (i), and variance/ covariance of residuals (Res) were accepted between the two samples (Δχ2λ, Δχ2i and Δχ2Res; p ≥0.05), strict
metric invariance was obtained. The external validity of the model was considered adequate when at least strong measurement invariance was found.
Proposal for calculating global score
To classify subjects based on their locus of control profiles, their global scores on the MHLC-C were first calculated.2,5 The original instrument proposal suggests
that the global score of these aspects be calculated as the sum of the items corresponding to each one. However, this method is called into question when an item needs to be excluded, since this exclusion directly compromises the maximum value that can be obtained. A common strategy for calculating global score without compromising the total maximum value is the use of the simple arithmetic mean.27 This strategy, however, assumes that each item
makes the same contribution to the calculation, which is not necessarily realistic. Thus, the method used to calculate the global score must better represent the calculation of the concept in the sample using a weighted score. The use of the regression weight matrix obtained in the CFA has been suggested,27,30,31 since it adds the lowest margin
of error to the estimate.
Using this method, a weight was estimated for each item of the instrument (weighted mean) in order to represent each item in the factor composition. However, to maintain the exact metrics of the response scale of the instrument, these weights were adjusted to the minimum-maximum values of the response choices, which range from 1 to 6. Using these values, the weight of each item was multiplied by each individual’s response to that item; finally, all of the values were added to obtain the global weighted score for the locus of control over pain.
The one-factor repeated measures ANOVA (α=5%) was used to compare the global scores on the MHLC-C factors obtained using the simple mean and the weighted mean.
Comparison of global scores between groups
The weighted global scores of each MHLC scale were compared between the four groups with different pain conditions (G0, G1, G2, and G3). The homoscedasticity of the data was verified (Levene’s test). ANOVA was used for comparisons between homoscedastic data, and Welch’s ANOVA was used between heteroscedastic data. For multiple comparisons, either the Tukey (homoscedastic) or Games-Howell (heteroscedastic) post-hoc test was used. The significance level was 5%.
Locus of control profile
In order to classify individuals by their locus of control profile, each of the aspects of locus of control first had to be classified as high or low based on the 50th percentile of the instrument. The aspects of locus
of control with weighted global scores greater than or equal to the 50th percentile of the instrument (≥3)
were classified as high, and those with a weighted global score below the 50th percentile of the instrument
(< 3) were classified as low. After the classification, the profiles were outlined according the study by Wallston and Wallston,6 as shown in Table 1. When
Table 1. Locus of control profiles according to the system suggested by Wallston and Wallston (1982).
Profile
Locus of control* Internal Chance
Health care professional and/or other people
(powerful others) **
Pure Internal High Low Low
Pure powerful
others external Low Low High
Pure chance
external Low High Low
Double external Low High High
Believer in control High Low High
Type IV High High Low
Yea-Sayer High High High
Nay-Sayer Low Low Low
*Low locus of control: weighted global score below the 50th
percentile of the instrument (< 3), high locus of control: weighted global scores greater than or equal to the 50th percentile of the instrument (≥ 3); **Low locus of control: weighted global score below the 50th percentile on one or both factors (Health Professionals and/or Other People). High locus of control: weighted global score greater than or equal to the 50th percentile of the instrument in at least one of the two factors.
the weighted score of the Health Professionals HLC factor and/or the Other People HLC was high, the Powerful Others subscale was considered high. The Powerful Others score was only considered low when both factors were considered low.
The IBM SPSS Statistics (v.22, SPSS, An IBM Company, Chicago, IL) and AMOS 22.0 (SPSS, An IBM Company, Chicago, USA) programs were used to perform the analyses.
Ethical aspects
The participants agreed to be involved in the study and signed the informed consent form. This study was approved by the Human Research Ethics Committee of the UNESP Araraquara School of Dentistry (CAAE registry number 14986014.0000.5416).
Results
Analysis of psychometric properties of the MHLC-C
The MHLC-C used and the CVR are shown in Table 2. Items 11, 15, and 16 (all of the Chance HLC items) were considered non-essential by specialists. One explanation provided by the specialists in this assessment is the presence of redundant content in the items.
The study sample characteristics are presented in Table 3. It should be noted that most of the participants in all groups were women, married or in a common-law marriage, and reported their socioeconomic level as C of the Brazilian economic classification. Orofacial pain was the most prevalent among individuals who reported having pain for less than 3 months prior to the interview (G1). When individuals were asked about location of the pain, dental pain represented 30.5%, 68.9%, 18.4%, and 8.4% of orofacial pain in G0, G1, G2, and G3, respectively. These characteristics are representative of the individuals treated our School of Dentistry.
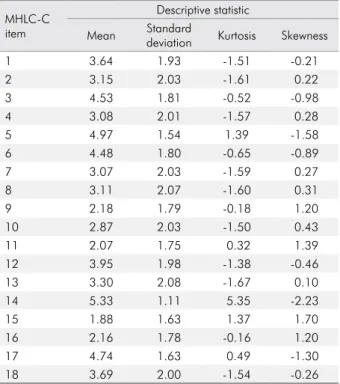
The descriptive statistics of the participants’ responses to the MHLC-C items are found in Table 4. All the items of the MHLC-C exhibited adequate psychometric sensitivity. Therefore, there was no severe violation of normality. Multivariate
normality of the data was observed (Mardia’s test = 1.58).
The values of the indices used to evaluate the psychometric properties of the MHLC-C model are shown in Table 5. The Internal HLC model (M1) was
found to adequately fit the data, despite the fact that the factor weights of items 1 (λ = 0.30) and 17 (λ = 0.44) were below recommended levels. The exclusion of the items (M1R1 and M1R2) caused conceptual loss in the
calculation of the factor score and did not improve the fit of data to the model significantly, though it did improve the factor weights. All of the items in this factor were therefore maintained in order to evaluate the Internal HLC model (M1).
The Chance HLC model (M2) did not present
an adequate fit to the data, and items 2 and 4 were excluded (M2R). A correlation between the error
terms of items 9 and 11 was also added (LM = 68.88). The refined M2R model did fit the data adequately.
The Powerful Others model (M3) did not adequately
fit the data. During the evaluation of the M3, the
modification indices showed evidence of a correlation between the error terms of items 3 to 5, 3 to 14, and 5 to 14 (LM = 36.45–116.84), which were the components of the Health Professionals HLC scale of M4. The
evaluation also revealed correlations between the error terms of items 7 to 10, 7 to 18, and 10 to 18 (LM = 22.10–95.24), which were the components of the Other People HLC scale of M4. Model M4 was
therefore chosen for evaluation; these items were regrouped in two correlated factors. M4 exhibited
adequate fit to the data and was therefore chosen for the identification of the locus of control profiles, along with M1 and M2R.
The models for the factors of the MHLC-C modified to fit the sample used in this study (M1, M2R,and
M4) are shown in Figure. These models exhibited
strict invariance in the measurements among independent samples (M1: Δχ2λ(6) = 3.623; p = 0.727; Δχ2i(6) = 6.364; p = 0.384; Δχ2Res(6) = 7.358; p = 0.289; M2R: Δχ2λ(4) = 1.779; p = 0.776; Δχ2i(4) = 1.846; p = 0.764; Δχ2Res(5) = 4.090; p = 0.537; M 4: Δχ2λ(6) = 3.006; p = 0.808; Δχ2i(6) = 6.699; p = 0.350; Δχ2Res(6) = 6.649; p = 0.355),
a result that indicates adequate external validity of the models for independent samples.
Global scores, locus of control profile, and comparison of the groups
the weights attributed to each of the subscales of the MHLC-C for the calculation of the weighted global score for locus of control over pain—Internal, Chance, Health Professionals, and Other People—are shown in Equations 1 to 4.
Internal = 0.05 It1 + 0.15 It6 + 0.22 It8 + 0.22
It12 + 0.25 It13 + 0.11 It17 (1)
Chance = 0.09 It9 + 0.13 It11 + 0.42 It15 + 0.36 It16 (2) Health Professionals = 0.19 It3 + 0.39 It5 + 0.02 It7 + 0.03 It10 + 0.34 It14 + 0.03 It18 (3) Other People = 0.03 It3 + 0.07 It5 + 0.26 It7 + 0.31 It 10 + 0.06 It 14 + 0.27 It18 (4) Table 2. Original version, Portuguese version, and content validity ratio (CVR) of the Multidimensional Health Locus of Control – Form C (MHLC-C) items.
Item
Face validity Content validity
Original Version* Portuguese Version**
Essentia#
(n) CVR
Multidimensional Health of Locus Control – Form C Escala Multidimensional de Locus de Controle da Saúde - Forma C 1 If my condition worsens, it is my own behavior which determines how soon I will feel better again.
Se a minha dor piora, é o meu próprio comportamento que determina em quanto tempo eu vou me sentir
melhor novamente. 7 0.75
2 As to my condition, what will be will be. Quanto à minha dor, o que tiver que ser, será. 8 1.00
3 If I see my doctor regularly, I am less likely to have problems with my condition. Se eu consultar meu médico regularmente, estarei menos propenso a ter problemas com minha dor. 8 1.00 4 Most things that affect my condition happen to me by chance. A maioria das coisas que afetam a minha dor acontece por acaso. 8 1.00 5 Whenever my condition worsens, I should consult a
medically trained professional.
Sempre que minha dor piora eu deveria consultar um
profissional treinado da área médica. 7 0.75
6 I am directly responsible for my condition getting better or worse. Eu sou diretamente responsável por minha dor ficar melhor ou pior. 8 1.00 7 Other people play a big role in whether my condition improves, stays the same, or gets worse. Outras pessoas tem um grande papel no fato da minha dor melhorar, ficar igual ou piorar. 8 1.00 8 Whatever goes wrong with my condition is my own fault. Tudo que acontece de errado com a minha dor é por minha culpa. 8 1.00 9 Luck plays a big part in determining how my condition improves. A sorte tem uma grande parcela na determinação de como minha dor melhora. 8 1.00 10 In order for my condition to improve, it is up to other
people to see that the right things happen.
Para que minha dor melhore, é necessário que outras
pessoas façam com que as coisas certas aconteçam. 7 0.75
11 Whatever improvement occurs with my condition is largely a matter of good fortune. Qualquer melhora que ocorre na minha dor é amplamente atribuída à boa sorte. 6 0.50a
12 The main thing which affects my condition is what I myself do. A principal coisa que afeta a minha dor é o que eu mesmo faço. 8 1.00 13 I deserve the credit when my condition improves and the blame when it gets worse. Eu mereço os créditos quando minha dor melhora e a culpa quando ela piora. 7 0.75 14 Following doctor’s orders to the letter is the best way to keep my condition from getting any worse. Seguir as orientações médicas corretamente é o melhor caminho para assegurar que minha dor não piore. 8 1.00
15 If my condition worsens, it’s a matter of fate. Se minha dor piora, é uma questão de destino. 6 0.50 a
16 If I am lucky, my condition will get better. Se eu tiver sorte, a minha dor vai melhorar. 6 0.50 a
17 If my condition takes a turn for the worse, it is because I have not been taking proper care of myself. Se minha dor voltar a piorar é porque não tenho me cuidado direito. 8 1.00 18 The type of help I receive from other people determines how soon my condition improves. O tipo de ajuda que recebo de outras pessoas determina o quão logo minha dor melhora. 7 0.75
*Original version of the Wallston et al. (1994); **Portuguese version adapted of the Araújo et al. (2010); #number of experts that deemed the
item as essential; aitems with values below recommendations (CVR
The global scores of the factors of the MHLC-C obtained from a simple mean and a weighted mean are shown in Table 6. The MHLC-C factor scores differed significantly depending on the method used. It is important to note that global scores are frequently overestimated when calculated using the simple mean. Because there is a statistically significant difference between methods, and because the weighted average preserves the application of the instrument to the sample, all remaining analysis employed the weighed score method.
Comparisons of the weighted global scores of the different groups for MHLC-C scales are showed in Table 7. The groups with different pain conditions differed significantly in their mean scores on the Health Professionals HLC. Individuals who reported pain in the prior three months or less presented higher scores.
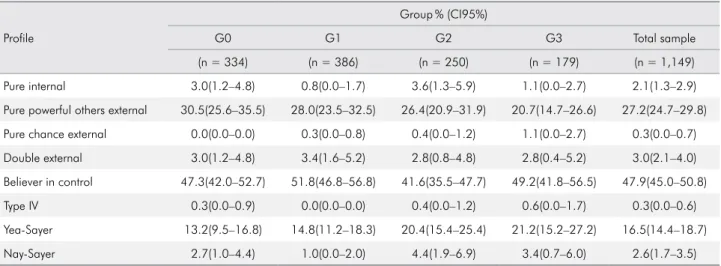
Table 8 shows the prevalence of the locus of control over pain profiles organized by point estimate and by 95% confidence interval and divided into groups with different pain conditions. No difference was found Table 3. Sample characteristics.
Variable Group**
G0 G1 G2 G3 Total
n 334 386 250 179 1,149
Age (mean ± standard deviation) 38.2 ± 10.8 36.6 ± 9.9 37.9 ± 11.1 44.7 ± 10.2 38.6 ± 10.8
n(%) Gender Male 85(25.4) 105(27.2) 32(12.8) 22(12.3) 244 (21.2) Female 249(74.6) 281(72.8) 218(87.2) 157(87.7) 905(78.8) Marital status Single 99(29.6) 142(36.8) 63(25.2) 32(17.9) 336(29.2)
Married / Common-law marriage 197(59.0) 202(52.3) 156(62.4) 111(62.0) 666(58.0)
Widowed 10(3.0) 8(2.1) 9(3.6) 7(3.9) 34(3.0) Divorced 28(8.4) 34(8.8) 22(8.8) 29(16.2) 113(9.8) Economic level* A/B 144(43.1) 132(34.2) 94(37.6) 56(31.3) 426(37.1) C 171(51.2) 216(56.0) 128(51.2) 107(59.8) 622(54.1) D/E 19(5.7) 38(9.8) 28(11.2) 16(8.9) 101(8.8)
Place of the pain
Orofacial 167(50.0) 319(82.6) 120(48.0) 34(19.0) 645(55.7)
Body 167(50.0) 67(17.4) 130(52.0) 145(81.0) 510(44.3)
*Average monthly income: A/B (R$4,427.36–R$20,272.56 = US$1,119.21–US$5,124.77), C (R$1,446.24–R$2,409.01 = US$365.60– US$608.98), D/E (R$639.78 = US$161.73) - Exchange rate provided by the Brazilian Central Bank on February 3, 2016; **G0: no pain; G1: pain < 3months; G2: pain ≥ 3 months, recurrent, G3: pain ≥ 3 months, continuous.
Table 4. Descriptive statistics (mean, standard deviation, kurtosis and skewness) of the participants’ responses to the Multidimensional Health Locus of Control - Form C (MHLC-C) items.
MHLC-C item
Descriptive statistic
Mean deviationStandard Kurtosis Skewness
1 3.64 1.93 -1.51 -0.21 2 3.15 2.03 -1.61 0.22 3 4.53 1.81 -0.52 -0.98 4 3.08 2.01 -1.57 0.28 5 4.97 1.54 1.39 -1.58 6 4.48 1.80 -0.65 -0.89 7 3.07 2.03 -1.59 0.27 8 3.11 2.07 -1.60 0.31 9 2.18 1.79 -0.18 1.20 10 2.87 2.03 -1.50 0.43 11 2.07 1.75 0.32 1.39 12 3.95 1.98 -1.38 -0.46 13 3.30 2.08 -1.67 0.10 14 5.33 1.11 5.35 -2.23 15 1.88 1.63 1.37 1.70 16 2.16 1.78 -0.16 1.20 17 4.74 1.63 0.49 -1.30 18 3.69 2.00 -1.54 -0.26
in the prevalence of the different profiles in groups with different pain conditions. The most frequent
profiles in the sample were “believer in control,” “pure powerful others,” and “yea-sayer.”
Table 5. Confirmatory factorial analysis (CFA), average variance extracted (AVE), and reliability (CR, α) of the models in the Multidimensional Health Locus of Control - Form C (MHLC-C) items fit to the sample.
MHLC-C CFA
*
r r’ Excluded items AVE CR α
λ χ2/df CFI GFI RMSEA
Complete model M1 0.30–0.73 4.931 0.975 0.987 0.059 - - - 0.35 0.75 0.74 M2 0.28–0.80 19.800 0.921 0.948 0.128 - - - 0.41 0.79 0.76 M3 0.43–0.69 42.979 0.658 0.875 0.191 - - - 0.25 0.67 0.66 M4 0.57–0.72 5.337 0.969 0.987 0.061 0.36 - - 0.40–0.40 0.67–0.67 0.66 Refined model M1R1 0.44–0.73 6.477 0.979 0.989 0.069 - - it1 0.40 0.76 0.76 M1R2 0.54–0.74 8.548 0.986 0.993 0.081 - - it1, it17 0.45 0.77 0.76 M2R 0.61–0.84 6.722 0.997 0.997 0.071 - 0.35 it2, it4 0.57 0.84 0.84
*λ: factor weight; χ2/df: ratio between chi-square and degrees of freedom, CFI: comparative fit index, GFI: goodness-of-fit index; RMSEA:
root mean square error of approximation; r: correlation between factors; r´: correlation between error of the items. M1: Model “Internal locus
of control”; M1R1: Refined M1 Model (excluded item 1); M1R2: Refined M1 Model (excluded items 1 and 17); M2: Model “Chance locus of
control”; M2R: Refined M2 Model (excluded items 2 and 4, correlation between errors of the items 9 and 11); M3: Model “Powerful Others
locus of control”; M4: Oblique Model “Health Care Professional locus of control” and “Other People locus of control”.
Figure. The multidimensional health locus of control scale – Form C (MHLC-C) fit to the sample. Internal MHLC1 MHLC6 MHLC8 MHLC12 MHLC13 MHLC17 e12 e13 e17 e8 e6 e1 0.30 0.56 0.70 0.69 0.73 0.44 0.09 0.31 0.49 0.48 0.53 0.20 M1 Chance MHLC9 MHLC11 MHLC15 MHLC16 e15 e16 e11 e9 0.61 0.66 0.84 0.83 0.37 0.44 0.70 0.96 M2R 0.35 Health Professional MHLC3 MHLC5 MHLC14 e14 e5 e3 0.57 0.72 0.60 0.33 0.52 0.36 Other People MHLC7 MHLC10 MHLC18 e18 e10 e7 0.61 0.66 0.63 0.38 0.44 0.39 M4 0.36
Table 6. Comparison of global scores for the factors of the Multidimensional Health Locus of Control - Form C (MHLC-C) obtained with the simple mean and the weighted mean.
Locus of control Method Global score (mean ±
standard deviation) F p-value
Internal Simple mean 3.87 ± 1.27 142.926 < 0.001
Weighted mean 3.75 ± 1.41
Chance Simple mean 2.07 ± 1.43 12.269 < 0.001
Weighted mean 2.03 ± 1.47
Health professionals Simple mean 4.94 ± 1.16 100.020 < 0.001
Weighted mean 4.87 ± 1.08
Other people Simple mean 3.21 ± 1.57 1.170.992 < 0.001
Weighted mean 3.49 ± 1.37
Table 7. Comparison of the weighted global score (mean ± standard deviation) of the Health Locus of Control - Form C scales (HLC-C) among groups with different pain conditions.
Group Mean ± standard deviation
Internal HLC Chance HLC Health professionals HLC Other people HLC
G0 3.68 ± 1.41 1.91 ± 1.25 4.83 ± 1.06ª 3.35 ± 1.36 G1 3.81 ± 1.39 1.98 ± 1.45 5.06 ± 0.95b 3.62 ± 1.39 G2 3.62 ± 1.38 2.09 ± 1.54 4.74 ± 1.15a 3.42 ± 1.41 G3 3.95 ± 1.49 2.29 ± 1.75 4.71 ± 1.19a 3.55 ± 1.29 Total 3.75 ± 1.41 2.03 ± 1.47 4.87 ± 1.08 3.49 ± 1.37 Statistic F 2.386* 2.534** 7.406** 2.559* p-value 0.068 0.056 < 0.001 0.054
G0: no pain; G1: pain < 3months; G2: pain ≥ 3 months, recurrent; G3: pain ≥ 3 months, continuous. *ANOVA, **Welch’s ANOVA; a,bdifferent
letters indicate significant statistical difference. Games-Howell post hoc test (α = 5%).
Table 8. Prevalence (point estimate and 95% confidence interval, or CI95%) of the locus of control over pain profiles among groups with different pain conditions.
Profile
Group% (CI95%)
G0 G1 G2 G3 Total sample
(n = 334) (n = 386) (n = 250) (n = 179) (n = 1,149)
Pure internal 3.0(1.2–4.8) 0.8(0.0–1.7) 3.6(1.3–5.9) 1.1(0.0–2.7) 2.1(1.3–2.9)
Pure powerful others external 30.5(25.6–35.5) 28.0(23.5–32.5) 26.4(20.9–31.9) 20.7(14.7–26.6) 27.2(24.7–29.8)
Pure chance external 0.0(0.0–0.0) 0.3(0.0–0.8) 0.4(0.0–1.2) 1.1(0.0–2.7) 0.3(0.0–0.7)
Double external 3.0(1.2–4.8) 3.4(1.6–5.2) 2.8(0.8–4.8) 2.8(0.4–5.2) 3.0(2.1–4.0)
Believer in control 47.3(42.0–52.7) 51.8(46.8–56.8) 41.6(35.5–47.7) 49.2(41.8–56.5) 47.9(45.0–50.8)
Type IV 0.3(0.0–0.9) 0.0(0.0–0.0) 0.4(0.0–1.2) 0.6(0.0–1.7) 0.3(0.0–0.6)
Yea-Sayer 13.2(9.5–16.8) 14.8(11.2–18.3) 20.4(15.4–25.4) 21.2(15.2–27.2) 16.5(14.4–18.7)
Nay-Sayer 2.7(1.0–4.4) 1.0(0.0–2.0) 4.4(1.9–6.9) 3.4(0.7–6.0) 2.6(1.7–3.5)
Discussion
This study demonstrated the validity and reliability of the MHLC-C in a sample of adult individuals with different pain conditions. This seems to be the first study to calculate the global score for factors inherent to locus of control and to compare the scores across groups with different pain conditions. The prevalence of different locus of control profiles in groups with different pain conditions was also considered. This study was performed using a larger sample size than necessary to preserve the representativeness of the study population.
Some modifications were required for the factors of the MHLC-C to properly fit the sample. In the Chance HLC subscale, 2 and 4 were inserted, and the correlation between items 9 and 11 was inserted. Pereira et al.32 previously suggested the exclusion
of the two items in a study with elderly individuals with chronic pain. Previous theoretical assessment by specialists in the field has suggested that the contents of items 9 and 11 are redundant. Thus, the correlation between the items was inserted. As mentioned previously, the model chosen herein was composed of the Health Professionals HLC and the Other People HLC rather than the model considering only the Powerful Others HLC, a decision that was consistent with other studies in the literature.5,7,8,9,10,11
Wallston et al.5 reported that individuals distinguish
between the influence of health professionals and that of other people when facing a specific health condition or disease (MHLC-C) but do not make this distinction when considering their health in general (MHLC-A and -B), which the authors found intriguing, relevant, and significant for health related behavior.
After the models were adjusted and the concept of locus of control over pain was identified in the sample, a new method was created to calculate the global score for each factor. This method is superior to the use of summation or simple means to calculate the global score of a factor because, in the traditional methods, the same weights are attributed to the construction of each factor, which is unrealistic. As a result, this new method is a positive contribution that increases the quality of
information collected for each sample or context,27,30,31
and its use in clinical practice is encouraged. The calculation of the weighted score might be considered difficult by health or dentistry professionals; however, given advances in technology and easier access to computer programs, this calculation can be more seamlessly incorporated into clinical routine and provide significant information for the creation of more accurate intervention protocols.
In terms of the global score for the MHLC-C subscales, the only discriminant factor determined herein was the Health Professionals HLC, since the group of individuals who reported feeling pain in the prior three months or less presented a higher value. It is possible that, when faced with recent pain, individuals will seek professional help to obtain a diagnosis and treatment. As a result, these individuals attribute a greater share of responsibility over pain control to their health professional. An important aspect of the study was that the data were collected as part of a dental treatment, which certainly contributed to higher external locus of control statistics: many of the participants, particularly in G1, were undergoing treatment. This association may not seem relevant; however, when patients transfer control to a health professional, there are more opportunities for a clinical approach that involves guidance and instruction, and therefore more likely to result in an effective treatment. These patients are more likely to accept medical advice and the treatments proposed.4,33 This could
also be a positive aspect in terms of treatment of the condition, since increased trust in health professionals could potentially lead to increased compliance with treatment and follow-up visits.17 Thus, an external
locus of control may be a beneficial factor for dental surgeons, as reported by Galgut et al.4
Individuals with a high or low locus of control score on a specific subscale do not necessary present a high or low locus of control score on another scale.5,6
As described previously, the individual evaluation of the MHLC-C scales and relationships between them are important for classifying individuals based on their different HLC profiles.6 The identification
of these profiles may be useful in dental practice as a way to predict patient behavior in response to their health condition or clinical treatment and may
therefore provide important information to achieve a more customized treatment plan.
The prevalence of the different locus of control profiles did not differ significantly among individuals with different pain conditions. This finding could be related to the trait-like stability of the locus of control, as suggested by Wallston et al.5 Certain situations
may change locus of control scores; however, in the case of pain, these changes were not sufficient to change individuals’ profiles.
Another relevant aspect of these profiles is the high prevalence of individuals classified as a “believer in control,” which is composed of a high Internal HLC, high Health Professional and/or Other People HLC, and a low Chance HLC. Previous studies have shown that Chance HLC is usually associated with worse indicators of health or disease, while an internal locus of control is associated with positive indicators of health and disease.3,7,12,13,15,17,18,34,35,36
Thus, dental patients with these profiles are more likely to accept medical or dental approaches and advice,6 and this correlation may be used strategically
by health professionals. Though the results are promising, those involving the “pure internal,” “pure powerful others,” and “yea-sayer” profiles require a closer scrutiny. One finding that may be considered unfavorable is the low prevalence of individuals who placed the responsibility for their conditions solely on themselves, high prevalence of individuals who place this responsibility on health professionals or other people to control their pain, and a reasonable prevalence of individuals who agree to treatment without question (all of the aspects of locus of control). Buckelew et al.17 argue that individuals’ clinical
presentations can result in different responses to a specific treatment, and that individuals with “pure internal” profiles are more likely to be more actively involved in and motivated to adhere to treatment. These are critical aspects for self-care. Cano-Garcia et al.18 report that the “pure internal” profile presents
the best clinical measurements (in terms of pain) and the best psychological measurements (in terms of coping strategies and self-efficacy), and found that the “yea-sayer” profile presents the worst results for these measurements. A consequent challenge for dentists and other health professionals may be to recognize
these patients’ inherent difficulty in instituting self-care measures, in improving clinical and psychological indicators, and in removing random choice when attributing responsibilities based on convenience.
Despite the value that identifying a patient’s locus of control can provide in planning dental treatments, it is important to recognize the inherent difficulty that dentists face with this identification: this psychological concept is relatively new in the health care field. Health professionals are therefore encouraged to learn the theoretical framework of the locus of control concept so that it can be considered in pain management. Future research on this topic by interdisciplinary teams may aid in the interpretation of loci of control, as well as of other aspects of behavior, emotions, and psychology that might be useful when establishing more customized, comprehensive, and solution-based approaches to care.
The limitations of this study included the lack other clinical and psychological variables that could affect the comparison of the different locus of control profiles in pain conditions. The cross-sectional nature of the study does not allow the follow-up of individuals and consider changes in their condition and/or the influence of clinical treatment on the beliefs regarding their loci of control over pain. Future studies are therefore encouraged to examine the possibilities of treating patients based on their locus of control profiles as they intersect with their pain conditions. Patients with pain will also benefit from research that considers the contribution of social and cultural aspects to their locus of control profiles, particularly if these are international studies or studies developed using different contexts and samples. Despite limitations, these results provide important information for health professionals and researchers regarding evidence of the validity and reliability of locus of control measurements among individuals with different pain conditions and not only those with chronic pain. These results pave the way for a discussion regarding how to include locus of control assessments in the treatment of patients with pain and show that locus of control represents a behavioral indicator that can aid in the prediction of individual responses to treatment and self-care.
Conclusions
The factors of the Multidimensional Health Locus of Control Scale – Form C were found to be valid and reliable for evaluating locus of control in people with different pain conditions. Only the Health Professionals HLC scores differed significantly among groups: scores were higher among those who reported feeling pain for more than 3 months prior to the study, which may indicate that they were receiving or had received treatment more recently than those in the other groups. The study revealed a high prevalence of individuals classified as “believer in control” profile in all of the pain conditions evaluated. This profile was found to be the most conducive to patients’ adaptation to medical advice and treatment.
Future studies are encouraged to broaden discussions and establish more evidence on the use of locus of control as a tool in managing patients with pain.
Acknowledgments
The authors are grateful for the financial support of grants 2014/00874-3, 2014/17624-0, 2014/23611-8, and 2015/23126-5 from the São Paulo Research Foundation (FAPESP) and the Association for the Improvement of Higher Education Personnel (CAPES), as well the Brazilian National Council for Scientific and Technological Development under grant 301611/2015-7. The authors would also like to thank psychologist Fernanda Cristina Maurício for her collaboration in collecting the data.
1. Rotter JB. Generalized expectancies for internal versus external control of reinforcement. Psychol Monogr. 1966;80(1):1-28. https://doi.org/10.1037/h0092976 2. Wallston KA, Wallston BS, DeVellis R. Development of
the Multidimensional Health Locus of Control (MHLC) Scales. Health Educ Monogr. 1978;6(2):160-70. https://doi.org/10.1177/109019817800600107 3. Luszczynska A, Schwarzer R. Multidimensional health
locus of control: comments on the construct and its measurement. J Health Psychol. 2005 Sep;10(5):633-42. https://doi.org/10.1177/1359105305055307
4. Galgut PN, Waite IM, Todd-Pokropek A, Barnby GJ. The relationship between the multidimensional health locus of control and the performance of subjects on a preventive periodontal programme. J Clin Periodontol. 1987 Mar;14(3):171-5.
https://doi.org/10.1111/j.1600-051X.1987.tb00962.x 5. Wallston KA, Stein MJ, Smith CA. Form C of the
MHLC scales: a condition-specific measure of locus of control. J Pers Assess. 1994 Dec;63(3):534-53. https://doi.org/10.1207/s15327752jpa6303_10
6. Wallston KA, Wallston BS. Who is responsible for your health? The construct of helath locus of control. In: Sanders LS, Suls J, editors. Social psychology of health and illness. New Jersey: Lawrence Erlbaum Associates; 1982. p. 65-95.
7. Castarlenas E, Solé E, Racine M, Sánchez-Rodríguez E, Jensen MP, Miró J. Locus of control and pain: Validity of the Form C of the Multidimensional Health Locus of Control scales when used with adolescents. J Health Psychol. 2016 Sep;28(1):1359105316669860. https://doi.org/10.1177/1359105316669860
8. De Las Cuevas C, Peñate W, Betancort M, Cabrera C. What do psychiatric patients believe regarding where control over their illness lies? Validation of the multidimensional health locus of control scale in psychiatric outpatient care. J Nerv Ment Dis. 2015 Feb;203(2):81-6. https://doi.org/10.1097/NMD.0000000000000244 9. Jomeen J, Martin CR. A psychometric evaluation
of form C of the Multi-dimensional Health Locus of Control (MHLC-C) Scale during early pregnancy. Psychol Health Med. 2005;10(2):202-14. https://doi.org/10.1080/13548500512331315434 10. Ubbiali A, Donati D, Chiorri C, Bregani V, Cattaneo E,
Maffei C et al. The usefulness of the Multidimensional Health Locus of Control Form C (MHLC-C) for HIV+ subjects: an Italian study. AIDS Care. 2008 Apr;20(4):495-502. https://doi.org/10.1080/09540120701867115
11. Wallston KA. The validity of the multidimensional health locus of control scales. J Health Psychol. 2005 Sep;10(5):623-31. https://doi.org/10.1177/1359105305055304
12. Keedy NH, Keffala VJ, Altmaier EM, Chen JJ. Health locus of control and self-efficacy predict back pain rehabilitation outcomes. Iowa Orthop J. 2014;34:158-65.
13. Wong HJ, Anitescu M. The role of health locus of control in evaluating depression and other comorbidities in patients with chronic pain conditions: a cross-sectional study. Pain Pract. 2017 Jan;17(1):52-61. https://doi.org/10.1111/papr.12410 14. Zucoloto ML, Maroco J, Campos JA. Psychosocial
and behavioral aspects of pain and perception of oral health. J Oral Facial Pain Headache. 2017;31(3):210-6. https://doi.org/10.11607/ofph.1742
15. Araújo LG, Lima DM, Sampaio RF, Pereira LS. Escala de Locus de controle da dor: adaptação e confiabilidade para idosos. Braz J Phys Ther. 2010 Sep-Oct;14(5):438-45. https://doi.org/10.1590/S1413-35552010000500014 16. Arraras JI, Wright SJ, Jusue G, Tejedor M, Calvo JI.
Coping style, locus of control, psychological distress and pain-related behaviours in cancer and other diseases. Psychol Health Med. 2002;7(2):181-7. https://doi.org/10.1080/13548500120116139
17. Buckelew SP, Shutty MS Jr, Hewett J, Landon T, Morrow K, Frank RG. Health locus of control, gender differences and adjustment to persistent pain. Pain. 1990 Sep;42(3):287-94. https://doi.org/10.1016/0304-3959(90)91141-5
18. Cano-García FJ, Rodríguez-Franco L, López-Jiménez AM. Locus of control patterns in headaches and chronic pain. Pain Res Manag. 2013 Jul-Aug;18(4):e48-54. https://doi.org/10.1155/2013/424839
19. Re TS, Bragazzi NL, Siri A, Cisneros Puebla C, Friese S, Simões M et al. Effects of acculturation, coping strategies, locus of control, and self-efficacy on chronic pain: study of Chinese immigrant women in Italy - insights from a thematic field analysis. J Pain Res. 2017 Jun;10:1383-90. https://doi.org/10.2147/JPR.S115449
20. Hair JF, Black WC, Babin B, Anderson RE, Tatham RL. Multivariate data analysis. 6th ed. New Jersey: Prentice Hall; 2005.
21. Associação Brasileira de Empresas de Pesquisa – ABEP. Critério de Classificação Econômica Brasil 2015. São Paulo: Associação Brasileira de Empresas de Pesquisa; 2015. 22. Pain terms: a list with definitions and notes on usage.
Recommended by the IASP Subcommittee on Taxonomy. Pain. 1979 Jun;6(3):249.
23. International Association for the Study of Pain – IASP. Classification of chronic pain: description of chronic pain syndromes and definitions of pain terms. Seattle: IASP Press; 1994.
24. Lawshe CH. Quantitative approach to content validity. Person Psychol. 1975;28(4):563-75. https://doi.org/10.1111/j.1744-6570.1975.tb01393.x 25. Wilson FR, Pan W, Schumsky DA. Recalculation of
the critical values for Lawshe’s content validity ratio. Meas Eval Couns Dev. 2012 Jul;45(3):197-210. https://doi.org/10.1177/0748175612440286
26. Kline RB. Principles and practice of structural equation modeling. New York: The Guilford Press; 1998. 27. Maroco J. Análise de equações estruturais: fundamentos
teóricos, software & aplicações. 2nd ed. Portugal: ReportNumber; 2014.
28. Mardia KV. Applications of some measures of multivariate skewness and kurtosis in testing normaity and robustness studies. Sankhya. 1974;36:115-28.
29. Fornell C, Larcker DF. Evaluating structural equation models with unobservable variables and measurement error. J Mark Res. 1981;18(1):39-50. https://doi.org/10.2307/3151312 30. Campos JA, Zucoloto ML, Bonafé FS, Maroco J. General
Oral Health Assessment Index: a new evaluation proposal. Gerodontology. 2017 Sep;34(3):334-42. https://doi.org/10.1111/ger.12270
31. da Silva WR, Marôco J, Ochner CN, Campos JA. Male body dissatisfaction scale (MBDS): proposal for a reduced model. Eat Weight Disord. 2017 Sep;22(3):515-25. https://doi.org/10.1007/s40519-017-0420-y 32. Pereira LS, Araújo LG, Sampaio RF, Haddad JP. Factorial analysis of the Multidimensional Health Locus of Control Scale: form C for elderly. Rev Bras Fisioter. 2011 Sep-Oct;15(5):363-70. https://doi.org/10.1590/S1413-35552011005000013 33. Potdar S, Lakshminarayan N, Goud Reddy S. Relationship of
locus of control with plaque and gingival status before and after oral health education in a group of college students: an experimental study. Int J Dent Hyg. 2015 Feb;13(1):42-8. https://doi.org/10.1111/idh.12093
34. Azizi M, Bisadi Z. A study of the relationships between“the role of coping strategies and coping efficiency”and “the locus of control” in experiencing mammography pain. Adv Environ Biol. 2012;6(4):1481-8.
35. Berglund E, Lytsy P, Westerling R. The influence of locus of control on self-rated health in context of chronic disease: a structural equation modeling approach in a cross sectional study. BMC Public Health. 2014 May;14(1):492. https://doi.org/10.1186/1471-2458-14-492
36. Konkolÿ Thege B, Rafael B, Rohánszky M. Psychometric properties of the multidimensional health locus of control scale form C in a non-Western culture. PLoS One. 2014 Sep;9(9):e107108. https://doi.org/10.1371/journal.pone.0107108