Ana Isabel Araújo Manuel Machado de Sousa
Licenciatura em Ciências da Engenharia Biomédica
Chitosan-based drug delivery systems
–
optimization
and modelling
Dissertação para obtenção do Grau de Mestre em
Engenharia Biomédica
Orientador: Prof. Doutor João Paulo Borges, Professor Auxiliar, DCM
–
FCT/UNL
Co-orientador: Mestre Paula Soares, DCM-FCT/UNL
Júri:
Ana Isabel Araújo Manuel Machado de Sousa
Licenciatura em Ciências da Engenharia Biomédica
Chitosan-based drug delivery systems
–
optimization
and modelling
Dissertação para a obtenção do Grau de Mestre
em Engenharia Biomédica
Orientador: Prof. Doutor João Paulo Borges, Professor Auxiliar, DCM-FCT/UNL
Co-orientador: Mestre Paula Soares, DCM-FCT/UNL
Faculdade de Ciências e Tecnologia da Universidade Nova de Lisboa
Departamento de Física
Julho, 2015
Composição do júri:
Presidente:
Prof. Doutora Carla Maria Quintão Pereira
Arguente: Doutora
Teresa Maria Alves Casimiro Ribeiro
Chitosan-based drug delivery systems – optimization and modelling
Copyright © Ana Isabel Araújo Manuel Machado de Sousa, Faculdade de Ciências e Tecnolo-gia, Universidade Nova de Lisboa.
Agradecimentos
Agradeço desde já a Deus, que mesmo nos momentos mais críticos e em que me senti com pouca fé, me mostrou a sua presença na minha vida das mais variadas formas.
Este trabalho não poderia ter sido desenvolvido sem a ajuda e o apoio de várias pessoas que me acompanharam neste processo e fizeram parte do meu percurso nestes últimos anos. Não posso deixar de agradecer a todos eles, que de uma maneira ou de outra me fizeram ca-minhar na direção certa.
Ao professor João Paulo Borges, por ter aceite orientar a minha tese, por todas as ideias e sugestões que me foi dando ao longo do trabalho, que me ajudaram a melhor estruturar esta investigação, e ainda pela disponibilidade demonstrada para resolver algumas situações buro-cráticas que foram surgindo.
À Paula Soares, por tudo! Pela enorme disponibilidade, por tudo o que me ensinaste, por sempre me apoiares e me impedires de desistir, mesmo quando tudo parecia correr mal. Agra-deço-te ainda a companhia, a boa disposição e o optimismo que sempre me transmitiste. Obri-gada, do fundo do meu coração! Foste, sem dúvida, a melhor co-orientadora que poderia ter!
Agradeço ainda ao professor Jorge Silva, por ter disponibilizado o seu laboratório de cé-lulas para poder desenvolver os ensaios de citotoxicidade, necessários para que este trabalho fosse concluído, e pela paciência connosco, principalmente em detectar as fontes das contami-nações.
À minha colega, parceira e, acima de tudo, amiga Diana, um muito obrigado! Foste es-sencial ao longo desta tese, com o teu companheirismo e boa disposição. A minha companhia nas maratonas no laboratório, nas sessões do espectrofotómetro, quando tínhamos infinita loi-ça para lavar, no desespero da escrita ou nos nossos telefonemas intermináveis com dúvidas e risos. Foi muito bom partilhar esta fase contigo; foste uma boa descoberta na minha vida!
Às minhas amigas do laboratório, Diana, Inês, Mariana e Tânia, que proporcionaram o melhor ambiente que poderia ter para trabalhar, com as partilhas de músicas e vídeos malucos, pelas risadas, pelos almoços, pela companhia e pelo apoio, obrigada!
Agradeço ao restante pessoal do laboratório de Polímeros, em particular à Augusta, pe-las suas conversas, à Susete, por tudo o que me ensinou, e à Coro, pela sua animação e boa disposição, animando sempre qualquer sala (ah e pelas boleias também..)!
Aos centípedes – Luísa, Inês, Andreia, Joana, Alex, João, Rui, Bruno, Edgar e Manel –
obrigada por estes anos de curso. A vossa companhia e amizade foi essencial nesta caminha-da! Agradeço em particular à Joana, ao Rui e ao João, que, cada um à sua maneira, estiveram bem presentes nesta etapa da tese e me deram todo o apoio que podia precisar.
Ao Ricardo, o meu padrinho académico, que sempre esteve presente e até a viver em Inglaterra me ajuda nos meus deveres académicos. Nunca falhas padrinho!
À Su e à Grega, por serem desde há muitos anos um apoio muito grande na minha vida e por acreditarem sempre nas minhas capacidades.
Aos amigos Pisanos, particularmente Carolina, Nuno e João, pelo vosso apoio e anima-ção constantes.
Ao pessoal dos Olivais que me ajudaram a caminhar sempre na melhor direção e sem-pre me apoiaram em todos os momentos da minha vida. Um especial agradecimento à Maria Campos, ao Davide Raposo, à Sofia Cavaco e ao Ricardo Gomes. Vocês são especiais e re-almente importantes; obrigada por me aturarem!
À Rita, que me conhece desde a infância e mesmo distante esteve sempre comigo em todos os momentos, e me ajudou a desanuviar da tese com os nossos cafés e saídas para dançar!
Abstract
The increase of cancer incidence on the last decades and the non-existence of totally ef-ficient therapies, leads to an urgent need to develop new cures or enhance the therapies al-ready in use. Chemotherapy has been one of the most used therapies for cancer disease, and although it is very efficient in destroying malignant cells, it also comes with many disadvantages for the patients, especially due to its lack of specificity to tumour cells. In this work, all studies were made using doxorubicin (DOX), a drug commonly used in chemotherapy that apart from destroying cancer cells, also lead to future cardiotoxicity problems to the patients. A targeted drug delivery system was studied in this work, using two biopolymers, chitosan and one of its derivatives, o-HTCC, taking advantage of their pH-sensitivity.
Doxorubicin was encapsulated in both chitosan and o-HTCC nanoparticles and also in
superparamagnetic iron oxide nanoparticles (SPION’s) coated with both chitosan and o-HTCC.
DOX release experiments were performed for different pH mediums, representing different in-vivo situations: bloodstream (7.4), tumour cells environment (6.5) and endosomal/lysosomal
compartments (4.5). It was verified that an initial burst effect occurs, especially in more acidic medium, and a controlled release was then achieved. A higher drug release was observed in pH 4.5 in all nanocarriers in study. Mathematical models were applied to the data, finding that Weibull and Korsmeyer-Peppas models are the best fit in describing DOX release mechanism. It was concluded that DOX release happened through a complex and anomalous mechanism for almost all the samples, probably due to the swelling behaviour of the polymers.
A study of the influence of polymer molecular weight was also performed and it was con-cluded that this parameter only has influence in nanoparticles’ size.
This work indicates that these nanocarriers can be further developed for targeted drug delivery systems, especially with doxorubicin.
Keywords: chitosan nanoparticles; coated superparamagnetic iron oxide nanoparticles;
doxorubicin; drug release; mathematical modelling; o-HTCC nanoparticles;targeted drug
Resumo
Com o aumento da incidência de cancro nas últimas décadas e com a falta de terapias totalmente eficientes para este tipo de doença, é urgente desenvolver novas curas ou melhorar as terapias já utilizadas. A quimioterapia é uma das terapias mais usadas para o tratamento de cancro e, apesar de ser muito eficiente na destruição das células malignas, tem enormes des-vantagens para os pacientes, especialmente devido à sua pouca especificidade para as células tumorais. Neste trabalho, todos os estudos foram efectuados utilizando a doxorrubicina (DOX), um fármaco frequentemente usado nos tratamentos de quimioterapia que, apesar de matar as células cancerígenas, leva ainda a problemas cardíacos para o paciente, no futuro. Nesta dis-sertação, foi estudado um sistema de libertação localizada de fármaco, utilizando dois biopolí-meros, o quitosano e um dos seus derivados, o-HTCC, tirando partido da sua sensibilidade ao
pH.
A doxorrubicina foi encapsulada em nanopartículas tanto de quitosano como de o-HTCC
e ainda em nanopartículas superparamagnéticas de magnetite (SPION’s) revestidas com am-bos os polímeros. Os ensaios de libertação do fármaco foram realizados em meios com dife-rentes pH, representando várias situações in-vivo: corrente sanguínea (7,4), meio envolvente
das células tumorais (pH 6,5) e os compartimentos endossomais/lisossomais (4,5). Verificou-se uma libertação inicial muito acentuada, principalmente no caso do pH mais ácido, e depois foi atingida uma libertação mais controlada. Foi ainda verificado que a maior percentagem de liber-tação ocorre para o pH de 4,5 para todos os nano-transportadores em estudo. Os modelos ma-temáticos foram aplicados a estes dados e os que melhor descrevem este tipo de mecanismo de libertação são os de Korsmeyer-Peppas e de Weibull. Concluiu-se que a libertação ocorre por mecanismo complexo e anómalo para a maioria das amostras, provavelmente devido ao inchamento dos polímeros. Foi ainda efectuado um estudo da influência do peso molecular dos polímeros e concluiu-se que influencia apenas o tamanho das nanopartículas.
Este trabalho demonstra então que estes nano-transportadores podem ser desenvolvi-dos para sistemas de entrega localizada de fármaco, particularmente para a doxorrubicina.
Palavras-chave: doxorrubicina; libertação localizada de fármaco; modelação
matemáti-ca; nanopartículas de o-HTCC; nanopartículas de quitosano; nanopartículas
Table of Contents
Agradecimentos ... vii
Abstract ... ix
Resumo ... xi
Table of Contents ... xiii
List of Tables ... xv
List of Figures ... xvii
Abbreviations and acronyms ... xix
1 Introduction ... 1
1.1 Aim and Objectives ... 3
2 Chitosan Nanoparticles ... 5
2.1 Structure and properties of chitosan ... 5
2.2 Preparation of chitosan nanoparticles ... 5
2.3 Applications of chitosan and chitosan nanoparticles ... 6
2.4 Chitosan swelling behaviour ... 7
2.5 Drug release from chitosan nanoparticles ... 8
2.5.1 DOX release profile from chitosan nanoparticles –state of the art... 8
2.6 Chitosan derivative: o-HTCC ... 10
3 Superparamagnetic iron oxide nanoparticles (SPION’s) ... 11
3.1 Structure and properties of SPION’s ... 11
3.2 Production of SPION’s ... 11
3.3 SPION’s coating and surfactants ... 12
4 Mathematical modelling for drug delivery systems ... 13
4.1 Mechanistic realistic theories ... 13
4.2 Empirical/semi-empirical theories ... 14
5 Materials and Methods ... 17
5.1 Chitosan depolymerisation ... 17
5.1.1 Materials ... 17
5.1.2 Procedure ... 17
5.2 Synthesis of o-HTCC ... 17
5.2.1 Materials ... 17
5.3 SPION’s synthesis by thermal decomposition ... 18
5.3.1 Materials ... 18
5.3.2 Procedure ... 18
5.4 Preparation of chitosan, o-HTCC nanoparticles and coated SPION’s ... 19
5.4.1 Materials ... 19
5.4.2 Procedure ... 20
5.5 Characterization of chitosan and o-HTCC nanoparticles and coated SPION’s ... 20
5.5.1 TGA ... 20
5.5.2 DLS and Zeta potential ... 20
5.5.3 FTIR ... 20
5.6 Evaluation of DOX encapsulation ... 21
5.6.1 Materials ... 21
5.6.2 Procedure ... 21
5.7 DOX release studies ... 22
5.7.1 Materials ... 22
5.7.2 Procedure ... 22
5.8 Mathematical modelling of release profiles ... 24
5.9 Cytotoxicity and cell viability assays ... 24
6 Results and discussion ... 27
6.1 Characterization of Cs and o-HTCC nanoparticles and coated SPION’s ... 27
6.1.1 Size and Zeta potential ... 27
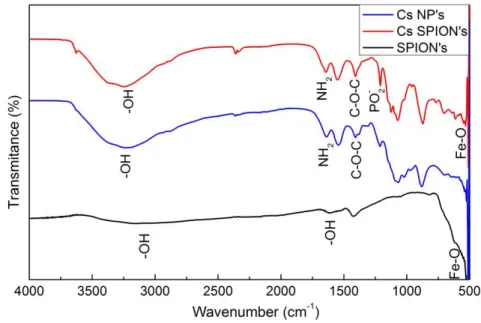
6.1.2 FTIR analysis ... 29
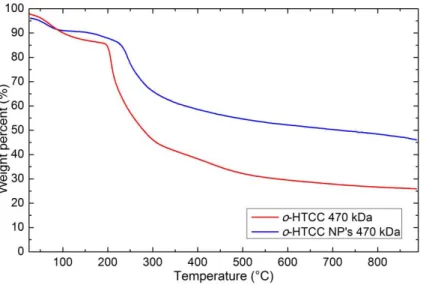
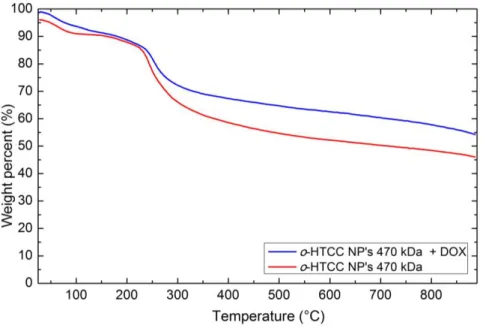
6.1.3 TGA analysis ... 31
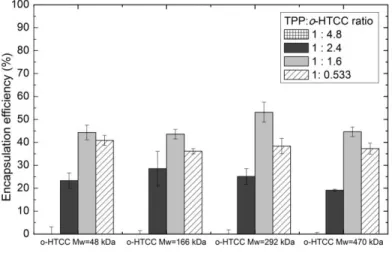
6.2 DOX encapsulation efficiency ... 34
6.3 DOX release studies ... 37
6.4 Mathematical modelling of DOX release profiles ... 46
6.5 Cytotoxicity Assays ... 54
7 Conclusions and future work ... 59
8 Literature References ... 61
Appendix ... 67
A – Additional graphs of DOX release ... 67
List of Tables
TABLE 4.1 - EMPIRICAL/SEMI-EMPIRICAL MODELS FOR DRUG RELEASE PROFILES; Q0 - INITIAL
QUANTITITY OF DRUG IN SOLUTION; QT - CUMULATIVE QUANTITITY OF DRUG RELEASED AT TIME T.
... 16
TABLE 5.1 - SUMMARY OF ALL DOX RELEASE PROFILES EXPERIMENTS. ... 24
TABLE 6.1 - CHITOSAN MOLECULAR WEIGHTS AFTER DEPOLYMERISATION. ... 27
TABLE 6.2 - O-HTCC MOLECULAR WEIGHTS. ... 27
TABLE 6.3 - ZETA-AVERAGE SIZE, POLYDISPERSITY INDEX AND ZETA POTENTIAL OF CHITOSAN NANOPARTICLES FOR DIFFERENT MOLECULAR WEIGHTS. ... 28
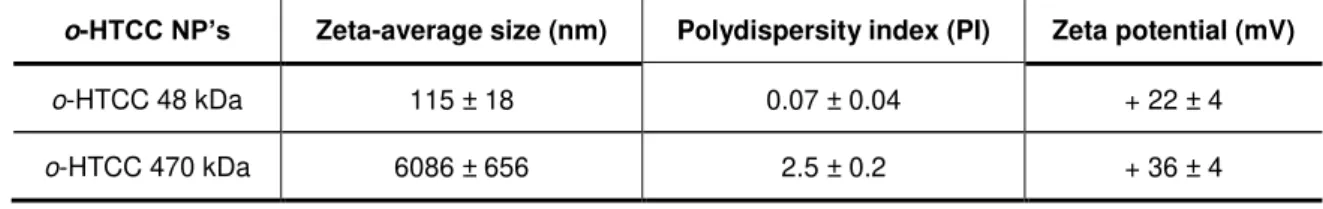
TABLE 6.4 - ZETA-AVERAGE SIZE, POLYDISPERSITY INDEX AND ZETA POTENTIAL OF O-HTCC NANOPARTICLES FOR DIFFERENT MOLECULAR WEIGHTS. ... 28
TABLE 6.5 - DOX ENCAPSULATION EFFICIENCY IN COATED SUPERPARAMAGNETIC IRON OXIDE NANOPARTICLES. ... 37
TABLE 6.6 – DOX RELEASE FROM CHITOSAN NANOPARTICLES MODELLING WITH KORSMEYER-PEPPAS, WEIBULL AND PEPPAS-SAHLIN MODELS. ... 49
List of Figures
FIGURE 1.1 - CHEMICAL STRUCTURE OF DOXORUBICIN. ... 1
FIGURE 1.2 - SCHEMATIC REPRESENTATION OF (A) DOX (RED) LOADED CHITOSAN/O-HTCC NANOPARTICLES AND (B) DOX LOADED CHITOSAN/O-HTCC COATED SPION'S. ... 3
FIGURE 2.1 - CHITOSAN CHEMICAL STRUCTURE... 5
FIGURE 2.2 – SCHEME OF CHITOSAN AND TPP MOLECULES INTERACTION. ... 6
FIGURE 2.3 - CHEMICAL STRUCTURE OF O-HTCC, A CHITOSAN DERIVATIVE. ... 10
FIGURE 5.1 - EXPERIMENTAL SET-UP FOR THERMAL DECOMPOSITION PROCEDURE; (B) 1-GAS INLET; 2-WATER INLET. ... 19
FIGURE 5.2 - DIALYSIS MEMBRANE CONTAINING DOX LOADED CHITOSAN NANOPARTICLES SOLUTION BEFORE STARTING RELEASE EXPERIMENTS. ... 23
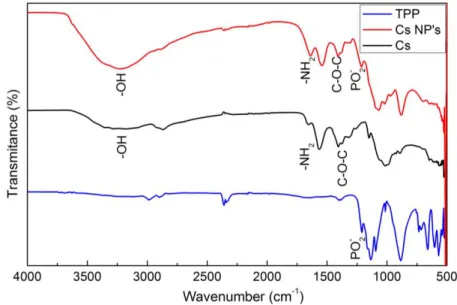
FIGURE 6.1 - FTIR SPECTRUM OF TPP, CS 39 KDA AND CS NP'S WITH 39 KDA. ... 29
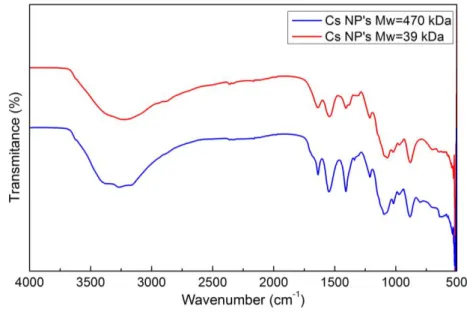
FIGURE 6.2 - FTIR SPECTRUMS COMPARING CS NP'S WITH 39 KDA AND WITH 470 KDA. ... 30
FIGURE 6.3 - FTIR SPECTRUMS OF TPP, O-HTCC 470 KDA AND O-HTCC NP'S WITH 470 KDA. ... 30
FIGURE 6.4 – FTIR SPECTRUMS OF SPION’S, CHITOSAN NANOPARTICLES AND CS COATED SPION’S. ... 31
FIGURE 6.5 - TGA OF CHITOSAN AND CHITOSAN NANOPARTICLES WITH MW=470 KDA. ... 32
FIGURE 6.6 - TGA FOR O-HTCC AND O-HTCC NANOPARTICLES WITH MW=470 KDA. ... 33
FIGURE 6.7 - COMPARISON OF TGA ANALYSIS OF CS NP'S WITH AND WITHOUT DOX. ... 33
FIGURE 6.8 - COMPARISON OF TGA ANALYSIS OF O-HTCC NP'S WITH AND WITHOUT DOX. ... 34
FIGURE 6.9 - DOX ENCAPSULATION EFFICIENCY FOR CHITOSAN NANOPARTICLES FOR DIFFERENT TPP:CS RATIOS. ... 35
FIGURE 6.10 - DOX ENCAPSULATION EFFICIENCY IN CS NP'S FOR DIFFERENT INITIAL CONCENTRATIONS OF DRUG. ... 35
FIGURE 6.11 - DOX ENCAPSULATION EFFICIENCY IN O-HTCC NANOPARTICLES FOR DIFFERENT TPP:O-HTCC RATIOS. ... 36
FIGURE 6.12 - RELEASE OF FREE DOX FOR DIFFERENT PH OF THE MEDIUM (CONTROLS). ... 37
FIGURE 6.13 - DOX RELEASE FROM NON-FREEZE-DRIED CHITOSAN NANOPARTICLES WITH CS 39 KDA FOR DIFFERENT PH. ... 38
FIGURE 6.14 - COMPARISON OF DOX RELEASE BETWEEN FREEZE-DRIED AND NON-FREEZE-DRIED CS NP'S WITH CS 470 KDA FOR PH 7.4. ... 39
FIGURE 6.15 - COMPARISON OF DOX RELEASE BETWEEN FREEZE-DRIED AND NON-FREEZE-DRIED CS NP'S WITH CS 470 KDA FOR (A) PH 6.5 AND (B) PH 4.5. ... 39
FIGURE 6.17 - DOX RELEASE PROFILES FROM CHITOSAN NANOPARTICLES FOR DIFFERENT CS
MOLECULAR WEIGHTS FOR PH 4.5. ... 41
FIGURE 6.18 - DOX RELEASE PROFILE FROM CHITOSAN NANOPARTICLES WITH CS 39 KDA FOR DIFFERENT PH... 41
FIGURE 6.19 - DOX RELEASE PROFILE FROM O-HTCC NANOPARTICLES (A) WITH O-HTCC 48 KDA FOR DIFFERENT PH AND FOR DIFFERENT MOLECULAR WEIGHTS FOR (B) PH 7.4, (C) PH 6.5 AND (D) PH 4.5. ... 42
FIGURE 6.20 - COMPARISON OF DOX RELEASE FROM CS NP'S AND O-HTCC NP'S FOR MW 470 KDA AT (A) PH 7.4, (B) PH 6.5 AND (C) PH 4.5. ... 43
FIGURE 6.21 - DOX RELEASE PROFILES FROM CS SPION'S WITH TWO MOLECULAR WEIGHTS AND FOR DIFFERENT PH... 44
FIGURE 6.22 - COMPARISON OF DOX RELEASE PROFILES BETWEEN CS NP'S AND CS SPION'S WITH CS 39 KDA FOR (A) PH 6.5 AND (B) PH 4.5. ... 45
FIGURE 6.23 - DOX RELEASE PROFILES FROM O-HTCC SPION'S WITH TWO MOLECULAR WEIGHTS AND FOR DIFFERENT PH. ... 45
FIGURE 6.24 - EXAMPLE OF KORSMEYER-PEPPAS MODEL FITTING DOX RELEASE DATA FROM FREEZE-DRIED CS 470 NP'S AT PH 4.5. ... 46
FIGURE 6.25 - CELL VIABILITY FOR CHITOSAN NANOPARTICLES IN VERO CELLS (24H TRIAL)... 55
FIGURE 6.26 - CELL VIABILITY FOR CHITOSAN NANOPARTICLES IN SAOS CELLS (24H TRIAL). ... 55
FIGURE 6.27 - CELL VIABILITY OF O-HTCC NANOPARTICLES IN VERO CELLS (24H TRIAL). ... 56
FIGURE 6.28 - CELL VIABILITY OF O-HTCC NANOPARTICLES IN SAOS CELLS (24H TRIAL). ... 56
FIGURE 6.29 - CELL VIABILITY OF SPION'S IN (A) VERO CELLS AND (B) SAOS CELLS (24H TRIAL). ... 57
FIGURE 6.30 - CELL VIABILITY OF COATED SPION'S IN VERO CELLS (24H TRIAL). ... 57
FIGURE 6.31 - CELL VIABILITY OF COATED SPION'S IN SAOS CELLS (24H TRIAL). ... 58
FIGURE 0.1 - DOX RELEASE PROFILE FROM CS NP'S AT PH 6.5 FOR DIFFERENT MOLECULAR WEIGHTS. ... 67
FIGURE 0.2 - COMPARISON OF DOX RELEASE FROM CS NP'S AND CS SPION'S WITH 39 KDA AT PH 7.4. ... 67
FIGURE 0.3 - DDSOLVER MENU WHERE IS CHOSEN THE MODEL TO APPLY TO DATA... 68
FIGURE 0.4 - DDSOLVER MENU WHERE DATA IS SELECTED. ... 68
Abbreviations and acronyms
Cs – Chitosan
Cs NP’s – chitosan nanoparticles
Cs SPION’s – Chitosan coated superparamagnetic iron oxide nanoparticles
DA – Deacetylation degree DOX - Doxorubicin
EE– Encapsulation efficiency
EPR effect – Enhanced permeability and retention effect HCl - hydrochloric acid
Mw – Molecular weight
o-HTCC - o-(2-hydroxyl) propyl-3-trimethyl ammonium chitosan chloride o-HTCC NP’s –o-HTCC nanoparticles
o-HTCC SPION’s - o-(2-hydroxyl) propyl-3-trimethyl ammonium chitosan chloride coated
superparamagnetic iron oxide nanoparticles PBS – Phosphate buffer saline
SPION’s – Superparamagnetic iron oxide nanoparticles TPP – Sodium Tripolyphosphate
1 Introduction
According to the World Health Organization (WHO) cancer incidence has been increas-ing in the last years and it is expected to more than duplicate until 2030 [1]. Current therapies are not completely efficient, having different outcomes and causing side effects to patients. It is not yet available any standard and ideal treatment. For example chemotherapy successfully destroys cancer cells, but also tend to affect other body parts, the healthy ones, increasing the toxicity of this therapy [1]. In this way, it’s very important to find other methods that will reduce chemotherapy toxicity and increase the specificity of this treatment to tumour cells.
Through all drugs that are being used in chemotherapy today, this study was based on Doxorubicin (DOX) (Figure 1.1), one of the most used anticancer drugs in chemotherapy. This drug is used in a range of tumour such as acute leukaemia, osteogenic sarcomas, lymphomas and solid tumours, such as breast and lung cancer, and it belongs to the anthracycline family [2].
Figure 1.1 - Chemical structure of doxorubicin.
DOX affects the DNA double helix, interfering with the synthesis of nucleic acid. There-fore, DOX is more effective when the cells are on S phase, also interfering through enzyme in-hibition. Even with all its effectiveness and benefits, DOX develops multidrug resistance and
cardiotoxicity for the patient when it’s administered in the traditional way [2]. It is not fully under-stood the mechanism that leads to this cardiac toxicity but the truth is that 5-23% of patients develop anthracycline-induced secondary cardiotoxicity [3]. This drug also has a slow terminal clearance, being metabolised by the liver and only about 40% of doxorubicin are excreted. Con-sequently only a reduced quantity of DOX really reaches the tumour area [2].
tumours, because its increased size does not enable the circulation in the bloodstream. There-fore, smaller systems have been investigated on the last years to overcome those problems and become reachable to the tumour area [4].
Different pH are detectable in our body and it is possible to take great advantage of this fact to design smart passive targeted systems. Blood has a neutral pH (nearly 7.4) whereas tu-mour microenvironment presents an acidic pH (approximately 6.5) due to the lactic acid as a result of anaerobic glucose metabolism of cancer cells. Additionally, some organelles, such as endosomes or lysosomes, can achieve lower pH values, between 3.5 and 5.5 [5, 6]. Thus, a drug delivery system that exploits these differences and that has pH-sensitivity is of interest as a drug carrier for oncology treatments.
Nanotechnology and nanomedicine are helping the development of successful targeted transporting systems, which deliver the chemical drug directly to the region of the tumour. Using nanoparticles as a drug delivery system is very advantageous as they can circulate in the bloodstream for longer time, are able to accumulate in the tumour area and allow a controlled release of the drug. These advantages and properties result essentially from their nano-size, which allow these nanoparticles to leave the bloodstream and to pass through tumour micro-vasculature [7].
Although there is no clear line dividing these categories, targeted drug delivery can be grouped into active and passive targeting. Active targeting requires the use of some targeting molecule specific for cancer cells, such as ligands or antibodies. On the other hand, passive targeting takes advantage of tumour’s microenvironment, involving the use of carriers that take benefit of physiological and natural properties of cancer tissues [7, 8]. This passive targeting usually exploit the enhanced permeability and retention (EPR) effect as a mechanism for locali-zation and accumulation of the nanocarrier at the tumour area, due to an inefficient lymphatic drainage [7, 9]. It is the nanoparticles size that allows this passive behaviour, as they can pass through tumour vasculature. In order to accumulate in the tumour area, nanoparticles must have their size between 100 and 200 nm [7, 8].
Several nanoparticles are being studied and used as targeted drug delivery systems [10], such as liposomes [11], nanospheres [12, 13], magnetic nanoparticles [9, 14, 15], polymer-ic mpolymer-icelles [16] or aquasomes [17, 18]. Nanopartpolymer-icles can either be composed of natural mate-rials, as lipids, biopolymers or proteins, or synthetic, such as gold, silver or magnetite. Each of these nanoparticles differs in their properties, stability, drug release rates and targeted delivery ability. It is important that the chosen system suits the drug and its therapeutic proposes [2].
tar-geting system because drug release is conditioned by the different physiological properties of chitosan, such as pH or temperature.
1.1 Aim and Objectives
The main purpose of this thesis is to study DOX controlled release profile from chitosan nanoparticles in different pH at physiological temperature (37ºC) and modelling this release through the application of mathematical models used to describe these types of mechanisms. Finding the models that best describe the experimental data allow the understanding of what happens on the DOX-nanoparticles system that allows DOX release. Another objective is to do the same study but using a chitosan derivative, o-(2-hydroxyl) propyl-3-trimethyl ammonium
chitosan chloride (o-HTCC), which has different solubility characteristics, allowing a comparison
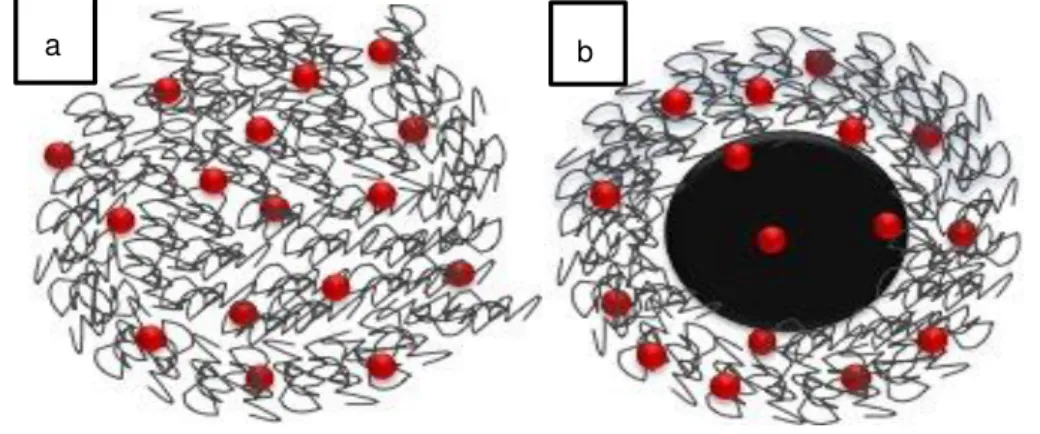
between these two nanocarriers. An additional purpose is to study and model DOX release from coated superparamagnetic iron oxide nanoparticles, with either chitosan or o-HTCC. Figure 1.2
has a representative scheme of the systems in study in this work: (a) polymeric nanoparticles with doxorubicin and (b) polymer coating superparamagnetic iron oxide nanoparticles with doxo-rubicin.
Apart from these main goals, this thesis also has some partial objectives:
- Study the influence of polymer molecular weight, chitosan or o-HTCC, in these
nanocarriers systems, in terms of nanoparticle dimension and DOX encapsulation and release.
- Analysis of chitosan, o-HTCC and coated superparamagnetic nanoparticles
cyto-toxicity.
It is important to refer that this thesis is a continuation of some other thesis still in devel-opment, and some materials used here were prepared in that work. For example, chitosan with different molecular weights and chitosan derivative, o-HTCC, were produced in this other work.
Figure 1.2 - Schematic representation of (a) DOX (red) loaded chitosan/o-HTCC nanoparticles and (b) DOX loaded chitosan/o-HTCC coated SPION's.
This manuscript is structured in eight different chapters. Chapter 1 is the introduction, where a contextualization of this work is given. Chapters 2, 3 and 4 are theoretical ones, giving some notions of the main subjects of this thesis, taking literature references into account. In this way, in chapter 2, chitosan nanoparticles are presented, given some focus to its structure and properties as a biomaterial, preparation methods, applications and state of the art as a nanocar-rier for doxorubicin. It is also in this chapter that is presented the chitosan derivative, o-HTCC,
2 Chitosan Nanoparticles
2.1 Structure and properties of chitosan
Chitosan (Figure 2.1) is a cationic polysaccharide, being the second most abundant polymer present in nature [20]. It results from the deacetylation of chitin present in crustaceans shells [21]. The main difference between chitosan and chitin is the deacetylation degree: chi-tosan occurs when the deacetylation degree (DA) is more than 50% [22]. This polymer is used for a diversity of biomedical applications due to its biocompatibility, low toxicity, good biodegra-dability [19], high hydrophilicity, high mechanical strength [23], cost-effectiveness [24] and poly-electrolyte property [25]. Chitosan is also able to reside for prolonged time in the gastrointestinal tract and increases cellular permeability, amplifying absorption, gaining potential as a composi-tion of oral drug forms [21]. Chitosan can have different molecular weights depending on the conditions of its harvesting [2].
Figure 2.1 - Chitosan chemical structure.
This biopolymer presents strong intra- and intermolecular hydrogen bonds, showing low solubility and reactivity in aqueous medium. Chitosan is insoluble at neutral and alkaline pH [21] and shows almost neutral charge [19], but it assumes a positive charge and becomes soluble at acidic pH [21]. This pH-sensitivity happens due to a large quantity of amino groups on chitosan chains. As a consequence of these solubility issues and its pH sensitive behaviour, chitosan nanoparticles present a swelling behaviour [5].
2.2 Preparation of chitosan nanoparticles
To prepare chitosan nanoparticles there are some used techniques such as ionic gela-tion, reverse micelle formagela-tion, precipitation self-assembly and spray drying [7].
ammonium groups (NH3+) of chitosan when dissolved in acetic acid, which allows the crosslink-ing of the absorbed chitosan molecules to each other, formcrosslink-ing spherical particles [25, 27]. A scheme of this interaction is shown in Figure 2.2. Chitosan nanoparticles formation through this method is dependent of the ratio between TPP and chitosan. Rampino et al. [28] verified that
increasing the quantity of TPP also increase the amount of chitosan nanoparticles and that for high quantity of available TPP, nanoparticles suspension becomes more turbid, with the disad-vantage of forming larger nanoparticles and aggregates.
Figure 2.2 – Scheme of chitosan and TPP molecules interaction.
This is a simple method, which allows the production of chitosan nanoparticles without using high temperatures or organic solvents [28]. Other advantage is that this method does not need auxiliary molecules, such as catalysts, which is a benefit for biomedical and pharmaceuti-cal applications. Moreover, chitosan nanoparticles prepared by ionic crosslinking usually show pH-sensitive swelling, a main reason for their usage in drug delivery applications [29].
2.3 Applications of chitosan and chitosan nanoparticles
One of chitosan applications in biomedicine is in medical imaging. To be used as an image contrast agent it should incorporate some inorganic material, such as metals, becoming a composite with better characteristics for this purpose. For example, magnetite (Fe3O4) coated with chitosan is being studied to be used in Magnetic Resonance Imaging (MRI) and was prov-en to work as a contrast imaging agprov-ent in this technique [21].
Chitosan has also been studied as an organic coating to magnetic nanoparticles as it decreases aggregation and offers more stability to the nanoparticles, increases targeting and biocompatibility and decreases chemotherapy side effects [24, 30, 31].
As a drug delivery system, chitosan has been studied for gene delivery, implants and nasal, oral, parenteral and transdermal administration [22]. For example, Quan Gan et al. [26]
studied chitosan nanoparticles as carriers for BSA protein, analysing all preparation conditions of chitosan nanoparticles such as chitosan molecular weight or concentration of each compo-nent of the system. They verified that the best encapsulation efficiency occurred for higher mo-lecular weight of chitosan and protein concentration and lower chitosan/TPP ratio and chitosan concentration. Also Aydin and his research group [5] studied chitosan nanoparticles as a local-ized delivery system to tumour cells for 5-fluorouracil. In this case was taken advantage of chi-tosan pH sensitivity, concluding that for acidic pH there was higher release ratio. It also showed a controlled release profile for this drug.
2.4 Chitosan swelling behaviour
Drug release from chitosan nanoparticles is dependent on the swelling behaviour of chi-tosan and drug-carrier interactions, which are influenced by pH of the medium [32]. One of the characteristics of the tumour region is its acidic medium (pH around 6.5), due to a high anaero-bic glucose metabolism in tumour cells. Also inside cells, in intracellular organelles, as lipo-somes or endolipo-somes, pH is even lower, between 3.0-5.5, regions where drug release will con-tinue to happen. Doxorubicin release behaviour has shown to be better on acidic pH due to its higher solubility and to chitosan degradation in this type of medium [31]. Chitosan structure suf-fers changes with variation of pH because of the reversible bonds of ionically crosslinked chi-tosan, which makes it able to be modified by external conditions after administration. Swelling behaviour of chitosan is influenced by its crosslinking density, which is defined at its formation. Thus, increasing the crosslinking density also increases the charge density of the crosslinker, leading to a decrease in swelling and pH-sensitivity, improving the stability of the structure of chitosan [29].
2.5 Drug release from chitosan nanoparticles
There are three different mechanisms of drug release from nanoparticles: release from the surface of nanoparticles, diffusion from the swollen nanoparticle and release due to polymer erosion. Most of the times, drug release involves more than one of these mechanisms, and they usually occur sequentially [26, 27].
Releasing the drug from the surface of the particles happens when the drug immediate-ly dissolves when in contact with the release medium. This kind of mechanism leads to burst effect in the early stages of dissolution.
Drug diffusion from the swollen nanoparticle is divided in three steps. The first step is the swelling of the polymer matrix due to water penetration into the system. Secondly chitosan changes from a glassy polymer into a rubbery matrix. And finally the drug diffuses from the swollen rubbery matrix of chitosan. Through this mechanism the release is slow at the begin-ning and later increases its velocity. Usually happens more in chitosan hydrogels [27]. Conse-quently there are two moving boundaries in swelling controlled release systems; one is the swollen rubbery portion, which is more mobile, and the second one is the glassy one that hap-pens to be less mobile. The moving region where this process occurs and that separate these last two portions of the polymer is called swelling front. The polymer structure can have
dis-solved and non-disdis-solved drug at the same time. The separation of the region of the swollen matrix that has only dissolved drug and the region with the two of them is called diffusion front;
this front is also moving during the process [27, 33].
2.5.1 DOX release profile from chitosan nanoparticles – state of the art
Studies of doxorubicin release profile from chitosan nanoparticles and some of its de-rivatives have already been made. In all of them release profile is studied by putting the drug delivery system in a dialysis bag and measuring the drug release into a medium that represents a biological environment, and varying its pH. In this sub chapter some of the most recent stud-ies involving DOX release from a nanocarrier composed of chitosan are presented.
Kevin Janes et al. [4] have studied the release profile of doxorubicin from chitosan-TPP
degradation of chitosan or by the release of DOX bonded to chitosan surface. In vitro studies
have showed that chitosan nanoparticles enter the cells through endocytosis and are degraded intracellularly, causing DOX release.
Yuan et al. [32] have studied chitosan clay and chitosan-aluminosilicate clay
nanocom-posite as drug carriers. DOX release was studied at 37 ºC for pH 1.2, 5.3 and 7.4. In this study, pH 1.2 represents the gastric fluid; although the nanocarrier do not need to stay long time in this really acidic pH in an in vivo system, as DOX has a low transition time. Control experiments
were made by submitting free DOX (drug solution only) to the same temperature and pH condi-tions. Testing free DOX release in acidic medium is important because in this pH this drug can behave similarly to chitosan. In these controls DOX was completely released in 1h, 5h or 12h from pH 1.2, 5.3 and 7.4, respectively. When loaded to the nanocarrier, DOX release was slow-er, never releasing 100% of its quantity. These results confirm that DOX release is more con-trolled when it is associated to a nanocarrier.
There are also some studies of DOX release profile from chitosan coated
superpara-magnetic iron oxide nanoparticles (Cs SPION’s) that present similar behaviours compared to release from chitosan nanoparticles. In this way, Javid et al. [24] studied DOX release profiles
from Cs SPION’s for a period of 48h. Different mediums with pH between 1.5 and 7.0 were tested and it was observed that highest pH lead to a lower quantity of drug released. This was a desired situation, as there is no interest on releasing the drug before the nanocarrier arrives to the tumour area. Maximization of DOX release was verified for pH between 4.5 and 6.5, corre-sponding to internalization and endocytosis of drug loaded SPIONs in tumour cells. In a more recent research, Unsoy et al. [31] studied DOX release from Cs SPION’s with different sizes.
Release profiles were studied in buffers with different pH (4.2 and 5.0) at 37 ºC for a maximum period of 30h, to simulate endosomal environment. A burst release in the first 30 min was ob-served followed by a slower release rate after 7h of the beginning of the experiment. The differ-ence in release profiles from different sizes of the nanoparticles was only 10%, where the smaller ones released more quantity of drug. Higher DOX release was observed in the most acidic medium (4.2). On chitosan coated SPION’s (CS SPION’s) loaded with DOX there are more crosslinking sites on chitosan structure than on CS SPION’s without DOX, which leads to
a lower swelling on the first ones [31].
When analysing DOX release profiles it is also important to study its encapsulation effi-ciency in the nanoparticles, in order to truly understand the meaning of the quantity of drug re-leased measured. Usually, encapsulation efficiency is indirectly determined through the meas-urement of drug concentration in the supernatant after centrifugation of DOX loaded Cs nano-particles [4, 5, 34]. For Cs-TPP nanonano-particles, Kevin Janes et al. [4] obtained a DOX
nanoparti-cles. For chitosan coated magnetic nanoparticles Unsoy et al. [31] achieved 99% of DOX
load-ing efficiency to 150 g/ml and 81% to 600 g/ml, difference justified by DOX saturation.
2.6 Chitosan derivative: o-HTCC
As chitosan is insoluble in biological pH (greater than 6.5), some researchers have syn-thesized chitosan derivatives that are soluble in a larger pH range [35]. Without the solubility problem, chitosan may have an increased efficiency as an absorption enhancer and become more suitable for a targeted drug deliver to some regions as intestine and other organs. Some attempts were made to introduce hydrophilic portions by covalent linkage in C2 position in chi-tosan polymeric chain, such as carboxymethylation, akylation or quaternarization of chichi-tosan. O
-(2-hydroxyl) propyl-3-trimethyl ammonium chitosan chloride (o-HTCC), with its structure
repre-sented in Figure 2.3, results from coupling of glycidyl trimethylammonium chloride (GTMAC) to chitosan [36]. Due to the additional quaternary ammonium group this derivative presents greater water solubility than chitosan, being soluble in a major pH range [37].
Figure 2.3 - Chemical structure of o-HTCC, a chitosan derivative.
Wan et. al [36] prepared o-HTCC and chitosan nanoparticles through ionic gelation,
us-ing TPP as a crosslinkus-ing. Comparus-ing both of them they concluded that o-HTCC presents high
water solubility in a wide pH range. They also verified that o-HTCC nanoparticles size was
around 537 nm and chitosan nanoparticles was 372 nm. Cs NP’s size was higher when loaded with BSA than Cs by itself but BSA loaded o-HTCC nanoparticles presented a smaller size than
only o-HTCC nanoparticles. This is due to the compact structure of BSA loaded o-HTCC
3 Superparamagnetic iron oxide nanoparticles
(SPION’s)
3.1 Structure and properties of SPION’s
Magnetic nanoparticles are being used as drug delivery carriers in targeted tumour treatments, especially superparamagnetic iron oxide nanoparticles (SPION’s), due to its nano-size and superparamagnetic properties. Usually made of magnetite (Fe3O4) or maghemite ( -Fe2O3), SPION’s have proven to be biocompatible and biodegradable [38]. Magnetite has iron cations in two valence states, Fe2+ and Fe3+, and its magnetization happens due to the electron-ic movements of these two ions. Magnetite nanopartelectron-icles with less than 20 nm of size are su-perparamagnetic which means that they behave as a single magnetic dipole, having a high magnetic momentum [39]. This high magnetization allows the control of their movement in the bloodstream with an external magnetic field and then confining them to the targeted tissue. Due to their superparamagnetic phenomena and quantum tunnelling of magnetization [40], they only become intensely magnetized when in presence of a magnetic field; on its absence they do not possess any magnetization [25]. So each particle can be considered as a single magnetic do-main [40]. Apart from the superparamagnetic property, other advantages of iron oxide nanopar-ticles are its biodegradability, low toxicity and allowance to surface modifications. That is why these nanoparticles are promising for magnetic resonance imaging or cancer therapy using ex-ternal magnetic fields [40]. SPION’s show an elevated surface area to volume ratio that allows a high drug loading and the attachment of some other surface compounds [6].
High magnetic susceptibility, superparamagnetic behaviour, tailored surface chemistry and the size of the nanoparticles are all factors that influence the effectiveness of these kinds of particles [40].
3.2 Production of SPION’s
SPION’s synthesis is very challenging in order to optimize size and shape, so that the
above-mentioned properties can be achieved. For that there are the physical and chemical methods. The first ones, such as electron beam lithography, are very elaborate procedures and do not allow nanoparticles size control. Chemical procedures are more tractable, simple and easier to control size, shape and composition of the nanoparticles [40].
Co-Precipitation [40]
Co-precipitation of Fe2+ and Fe3+ aqueous salt solutions by adding a base is a chemical procedure to produce magnetite and some others iron oxides. Through this method nanoparti-cles characteristics are controlled by the pH, ionic strength of the media, Fe2+ and Fe3+ ratio and the type of salt used.
Usually the base is added to an aqueous mixture of Fe2+ and Fe3+ salts with 1:2 molar ratio under a non-oxidizing oxygen free environment and it is expected that a complete precipi-tation of Fe3O4 occur at pH between 9 and 14. To maintain this ideal environment the produc-tion of magnetite nanoparticles must be performed by passing N2 gas through the reacproduc-tion area, which allows controlling reaction kinetics and particle size as it also prevents critical oxidation of magnetite.
Thermal decomposition [39, 41, 42]
This method is based on the decomposition of ionic precursors, such as Fe(acac)3 or Fe(Co)5, in a solvent, e.g. triethylene glycol (TREG), at high temperatures. These ionic precur-sors are used in high quantities but as they are very toxic, the generated nanoparticles through the process need purification. Changing the procedure parameters, such as concentration of iron salts, duration of the reaction or the surfactant, allows controlling size and shape of
SPI-ON’s produced. Using TREG as a solvent has three important roles: is a reducing agent, it works as a high-boiling solvent and is also a stabilizer to the nanoparticles produced, working itself as a surfactant. This method results in stable and uniform magnetite nanoparticles.
3.3 SPION’s coating and surfactants
Due to hydrophobic interactions between the magnetic nanoparticles they tend to ag-gregate and form large clusters, increasing the size of the particle. These clusters have strong magnetic dipole-dipole attractions between them, which lead to further magnetization of each cluster, because they start to belong to their neighbours’ magnetic field due to their size. This result in increased aggregation of the NPs [40]. To solve or improve this aggregation problem, coating the superparamagnetic nanoparticles with surfactant has proven to be a good solution, as it increases their stability [25, 40]. Several surfactants can be used and, its origin leads to changes in SPION’s functionality, such as increasing the cell uptake, decrease the risk of im-munogenicity or changing the surface charge [25]. However, some studies showed that these
surfactants do not lead to severe changes in SPION’s magnetic and physiochemical properties,
except for the case of oleic acid [45].
4 Mathematical modelling for drug delivery systems
To understand drug release from nanoparticles, there are some mathematical models that try to explain and predict the system performance. The use of a mathematical model allows improving the delivery system in terms of efficiency and easiness of application. It also has the advantages of reducing time and costs, because it allows reducing the number of experiments made and optimizing the procedures. Since Takeru Higuchi, in 1961, [46] that was the beginner of mathematical modelling for drug release systems, there have been numerous models, for different kinds of systems. These models can be split into empirical/semi-empirical or mechanis-tic realismechanis-tic. On empirical/semi-empirical models the predictable power is usually low due to the fact that the mathematical treatment is only descriptive and does not take into account the real biological phenomena. Thus it is important to be careful using these kinds of mathematical models when making quantitative predictions or mechanistic conclusions. They are useful when comparing different drug release profiles. On the other hand, the mechanistic mathematical models are different, as they take into account the real phenomena happening on the drug de-livery system, such as diffusion, swelling, erosion or degradation. Hence, allows the prediction of different processes that are involved in the studied system. Therefore these models allow the understanding on how the system works and the theoretical prediction of the required and de-sired characteristics of production of the drug delivery system [33]. However, there is some di-vergence between theories and experimental data, especially because there are several driving forces in a single transport process [47].
It is important to take into account the swelling behaviour of chitosan when applying some mathematical model, because some of the models may not be appropriate for this kind of polymer. There have been made several efforts to modulate drug release from swelling materi-als but its viscoelastic properties make this a very hard task [48].
4.1 Mechanistic realistic theories
The mechanistic realistic theories explain the biological phenomena through equations, which often are partial differential equations. In these cases, the initial and boundary conditions should be known, such as the drug distribution before the system contacts with the release me-dium. The solutions of these equations may be analytical or numerical, according to the com-plexity of the set of mathematical equations that represents the system. Usually some approxi-mations and simplifications are needed to achieve a relatively simple mathematical system [33].
consid-ered the transition from the glassy to the rubbery state of the macromolecules. Through models already developed, drug release is quantified from polymer films showing swelling behaviour, using a complex set of partial differential equations [33]. In this way, they are not of easy appli-cation to experimental data and they are not going to be used in this work.
4.2 Empirical/semi-empirical theories
These are very useful models for experimental studies of drug release profiles, by giv-ing indication of the underlygiv-ing release mechanism and allowgiv-ing the comparison between dif-ferent drug release profiles [33].
The most used empirical/semi-empirical models are all represented in Table 4.1. Zero-order kinetics model implies that drug release from the nanocarrier is slow, that no equilibrium conditions are reached and there’s no dosage form disaggregation. It describes re-lease from low soluble drugs incorporated in matrix tablets. First-order kinetics modulates disso-lutions profiles where the quantity of drug released is proportional to the amount that is still in the dosage form and it decreases by unit of time [49, 50]. It is usually used for porous dosage forms containing water-soluble drugs [51]. On the other hand, Higuchi model describes the
re-lease as Fickian diffusion, dependent of the square root of time. It’s usually used for matrix
tab-lets with soluble drugs or transdermal systems [49, 50]. Higuchi model is more precise in sys-tems of unidimensional matrixes with low solubility, in which drug diffuses in only one direction and without swelling behaviour [52]. Another model is Hixson-Crowell that describes systems
where there’s a changing in diameter and surface area of tablets or particles while drug releas-ing, which means that the geometry of the systems is maintained constant [51, 53]. Some other model was developed by Hopfenberg to describe drug release from surface eroding polymers, where polymer surface area stays constant [50]. Another model was described by Peppas and Sahlin with an equation with two parcels; the first one represents Fickian diffusional contribution and the second one is related to dissolution and relaxation of polymeric chains contribution to release. This model equation ha also an exponent, m, that is truly related with n exponent of
Korsmeyer-Peppas model, as its values should be the same [54].
Finally, there is the simplest model to describe drug release from polymers that is called Korsmeyer-Peppas model and is based on a power law equation [55]. This mathematical model is also applicable to swelling polymeric systems and its constants assume different values de-pending on the release mechanism, with different boundary values according to the geometry of the device. As we are working with chitosan nanoparticles, there is only interest in the release from spheres [56]. This model is applicable to experimental data by doing the approximation to the first 60% of release, which means that 𝑀𝑡
(equilibrium state of release) [13, 49, 56, 57]. Depending on the value of the diffusional expo-nent n different types of release profile can be identified, as it is mentioned in Table 4.1 when
referring this model. If n≤ 0.43 means that we are in the presence of Case I or Fickian diffusion
where diffusion rate is less than relaxation rate. When n = 0.85, it is Case II transport or also
called relaxation-controlled transport where relaxation rate is slower than diffusion rate. When n
is in between these values it is called anomalous or non-Fickian diffusion, where there is a simi-larity between diffusion and relaxation rate [57]. There is a last category of release profile, when
n > 0.85, called Super Case II transport [49, 58]. The other constant present in the equation of
this model is k, which is related to the shape and structure of the polymer [33]. These two
con-stants allow the comparison of experimental data of systems with different characteristics and the understanding of release mechanism.
There is also a mathematical function that usually fits most of the drug release profiles, named Weibull equation, used to describe the initial 60% of release, which is shown in Table 4.1. While not properly a model, as it was not designed to describe specifically a drug release system, it does seem to fit most of release profiles, even though there is no kinetic basis to its use and its parameters are not well physically described [59]. This equation has two constants a
and b. The first one, constant a, is a time scale factor and b is a shape factor: b = 1 means it is
exponential, b > 1 it is sigmoid and b < 1 means it is parabolic, with a higher slope in the
begin-ning, when compared to exponential one [60]. In 2006, Vasiliki Papadopoulou et al. [59] have
presented a correlation between this b parameter of Weibull model with n exponent of
Korsmeyer-Peppas model. In this way, b can be used as an indicator for the mechanism of drug
release. This study indicates that for b≤ 0.75 it is a Fickian diffusion, for 0.75 < b < 1 is a mixed
Table 4.1 - Empirical/semi-empirical models for drug release profiles; Q0 - initial quantitity of drug in solution; Qt - cumulative quantitity of drug released at time t.
Model Equation Application Ref.
Zero-order
𝑄𝑡= 𝑄0+ 𝐾0𝑡
𝑘0 - zero-order release constant
Systems where release rate is independent of the concentration
of dissolved substance
[5, 61, 62]
First order log 𝑄𝑡= log 𝑄0+ 𝐾1𝑡 𝐾1 - first-order release constant
Systems where release rate is
dependent on the concentration [5, 62, 63]
Higuchi 𝑄𝑡= 𝑄0+ 𝐾𝐻𝑡 1/2
𝐾𝐻 - Higuchi constant
Fickian diffusion [5, 46]
Hixson-Crowell
√𝑄𝑡
3 − √𝑄
0
3 = 𝐾
𝐻𝐶𝑡 𝐾𝐻𝐶 - Hixson-Crowell constant
Release by dissolution where the surface area and diameter
parti-cles change; related to erosion release mechanism
[5, 64]
Hopfenberg
𝑄𝑡= 1 − (1 −𝑘𝑐0𝑡 0𝑎)
𝑛
𝑐0 - uniform initial drug concentration in
the system
𝑎 - radius of a sphere
𝑘0 - rate constant 𝑛 - shape factor
Surface eroding polymer matrices [5, 65]
Korsmeyer-Peppas
𝑄𝑡= 𝑘𝑡𝑛
n - empirical release exponent k – related to polymer structure and
geometry
Fickian: n≤0.43, Case II transport: n =0.85, non-Fickian or anoma-lous: 0.43< n <0.85, super Case
II: n >0.85
[5, 56, 66]
Weibull 𝑄𝑡= 100 × [1 − 𝑒−𝑡
𝛽
𝑎]
Fickian diffusion: b≤0.75, com-bined mechanism of Fickian and
Case II: 0.75<b<1, complex mechanism: b>1
[59, 67]
Peppas-Sahlin 𝑄𝑡= 𝑘1. 𝑡𝑚+ 𝑘2. 𝑡2𝑚
k1– Fickian contribution; k2– re-laxation contribution; m -
corre-spondent to n exponent of Korsmeyer-Peppas model
5 Materials and Methods
As a way to study the influence of the molecular weight in the drug delivery system, chi-tosan and o-HTCC with four different molecular weights were used in some of the experiments
of this work.
5.1 Chitosan depolymerisation
5.1.1 Materials
Chitosan (Cognis, DA 75.5%), sodium nitrite (NaNO2) (Sigma-aldrich), acetic acid ( Pan-reac), NaOH (Eka)
5.1.2 Procedure
As it has been referred before, this thesis is a continuation of other thesis still in devel-opment. In this way, chitosan depolymerisation was performed in that work and here was used the resultant chitosan with different molecular weights, so the procedure is going to be shortly presented.
Commercial chitosan with molecular weight Mw = 470 kDa was depolymerized to obtain three different molecular weights based on the method used by Huang et al. [69] in 2004 and by
Loh et al. [70] in 2010. Chitosan (1% w/v) was first diluted in acetic acid (1% v/v) overnight
un-der magnetic stirring. Then sodium nitrite (NaNO2) was added using three different NaNO2:Cs ratios: 1:25, 1:100 and 1:200, in order to obtain the three different molecular weights. This solu-tion stayed under mechanical stirring at 300 rpm for 1h. Each one of these three samples of depolymerized chitosan was precipitated with NaOH 4M, until the pH reached approximately 9. After this, the solution was centrifuged (Heraeus Multifuge X1R centrifuge –Thermo Scientific)
at 10000 rpm for 10 min at 20ºC. The resultant pellet was washed several times with ultrapure water until neutral pH and the final product was freeze-dried (VaCO2 ZIRBUS technology; -45 ºC and 0.07 mbar).
The molecular weight of depolymerized chitosan was measured by dilute solution vis-cometry (Schott Geräte Typ 53201/0a; solvent system: 0.2 M acetic acid/0.1 M sodium acetate, 30ºC) using the Mark-Houwink equation (K= 2.26x10⁻⁵ dl/g, α=0.95) [71]
5.2 Synthesis of o-HTCC
5.2.1 Materials
5.2.2 Procedure
o-HTCC was also synthetized in a simultaneous work in the laboratory through an
adapted method of Wang et al. [37] from the four molecular weights of chitosan.
First, 5 g of chitosan was dissolved in 250 ml of acetic acid (2% v/v) and 125 ml of meth-anol. Then 32 ml of benzaldehyde was added to the solution and the reaction occurred with mechanical agitation for 24h, until forming a white gel. To adjust the pH of the polymer, sodium hydroxide NaOH 1M was added until the pH reached 7.0. After this, the solution was filtered and washed in turns with methanol and acetone, and the product was freeze-dried. The ob-tained product was mixed with 50 ml of isopropyl alcohol and 5 g of glycidyl-trimethyl-ammonium chloride (GTMAC). This solution was placed under stirring for 16 hours at 70ºC and the resultant precipitate was washed with methanol and acetone alternately. After freeze-dried, this product was added to 100 ml of ethanolic HCl 0.25M and was under reaction for 24 hours at ambient temperature. Then, 25 ml of ultrapure water was added followed by excess of acetone was added in order to precipitate the final product. This product was filtered and washed with acetone and methanol for several times. To purify o-HTCC, this last product was dissolved in water and precipitated with excess acetone. After filtered and washed, the resultant o-HTCC
was freeze-dried and stored in a dry place.
5.3 SPION’s synthesis by thermal decomposition
5.3.1 Materials
Triethylene glycol (TREG) (Alfa Aeser, 99%), iron (III) acetylacetonate (Fe(acac)3)
(Sigma Aldrich, 97%), ethyl acetate (Sigma Aldrich, 99.5%), hydrochloride acid 37% (Panreac),
1,10-phenanthroline (Applichem), hydroxylamine (Alfa Aeser), ammonium acetate (Sigma Al-drich), distilled water.
5.3.2 Procedure
Superparamagnetic iron oxide nanoparticles were prepared by thermal decomposition of Fe(acac)3 through an adapted method of Maitry et al. [42]. In a round flask, 0.7 g of Fe(acac)3
they were centrifuged again under the same conditions. The supernatants were all removed and nanoparticles were dispersed in distilled water and stored all together in a flask.
Figure 5.1 - Experimental set-up for thermal decomposition procedure; (b) 1-gas inlet; 2-water inlet.
After the production of SPION’s it is necessary to know its iron concentration for further experiments. To do this it was followed a procedure of indirect measure through ultraviolet visi-ble spectrophotometer (UV-Vis, T90+ PG Instruments) and 1,10-phenanthroline colorimetric method [73]. Using hydrochloric acid (HCl) (0.01 N), were prepared solutions of hydroxylamine hydrochloride at 100 mg/ml and phenanthroline 3 mg/ml. In an eppendorf were added 40 l of
diluted SPION’s solution and 20 l of HCl and waited for 1h. Then, it was added 100 l of hy-droxylamine hydrochloride (100 mg/ml) solution and 500 l of phenanthroline solution (3 mg/ml). Finally 1140 l of ammonium acetate (500mM) was added to the eppendorf and the absorbance of the solution was measured in UV-Vis spectrophotometer, at 510 nm. A calibra-tion curve (Equacalibra-tion 1) to determine the concentracalibra-tion of iron in the solucalibra-tion was obtained using Mohr salt (Ammonium iron (II) sulphate, Sigma).
𝒚 = 𝟒. 𝟓𝟎𝟕𝟗𝒙 + 𝟎. 𝟎𝟕𝟓𝟑 Equation 1
After the iron concentration was calculated, the SPION’s solutions were freeze-dried in order to obtain the total NP’s mass by weighting the final dry sample. From both experiments, the following relation was obtained:
[Fe] = 0.7 x [SPION’s], that correlates the iron concentration with the total SPION’s mass.
5.4 Preparation of chitosan, o-HTCC nanoparticles and coated SPION’s
5.4.1 Materials
Chitosan (Cognis, DA 75.5%), sodium tripolyphosphate (Sigma Aldrich, 85%), acetic acid
(Panreac).
5.4.2 Procedure
Chitosan nanoparticles were prepared based in the method developed by Calvo et al.
[74] in 1997 where the nanoparticles were formed by the addition of sodium tripolyphosphate (TPP) to chitosan in acidic solution. Therefore, TPP (0.25% (w/v) in water) was slowly added to chitosan at 1.2% (w/v) in acetic acid 1% (v/v) in a disperser (IKA T10 basic ultra-turrax) for 5 min. To isolate the chitosan nanoparticles, the solution was centrifuged for 5 min at 10000 rpm and the pellet was resuspended in water.
To prepare o-HTCC nanoparticles the same method as for chitosan was used.
Chitosan or o-HTCC coated SPION’s were prepared through this last procedure, with the
difference of the addition of SPION’s at 1 mg/ml in the proportion of 1:12 of SPION’s to Cs or o
-HTCC, before adding tripolyphosphate (TPP).
5.5 Characterization of chitosan and o-HTCC nanoparticles and coated SPION’s
Different analyses were performed to characterize chitosan and o-HTCC nanoparticles
and coated SPION’s by its size, charge or spectrum.
5.5.1 TGA
Thermal gravimetric analysis (TGA) (Thermal Analyzer NETZSCH STA 449 F3 Jupiter®) was performed in either chitosan or o-HTCC nanoparticles to analyse the changes in their
phys-icochemical characteristics as a function of temperature.
5.5.2 DLS and Zeta potential
Dynamic Light Scattering (DLS) (SZ-100 nanopartica series, Horiba, Lda) was made to analyse particle size distribution of chitosan and o-HTCC nanoparticles, for each molecular
weight. Zeta potential was determined using in a way to evaluate the stability of chitosan and o
-HTCC nanoparticles dispersion. Each trial was made in triplets.
5.5.3 FTIR
Fourier transform infrared spectroscopy (FTIR) of freeze-dried samples of both chitosan and o-HTCC, by itself and as nanoparticles, and of SPION’s and coated SPION’s was
5.6 Evaluation of DOX encapsulation
5.6.1 Materials
Chitosan and o-HTCC with four different molecular weights, SPION’s produced by
thermal decomposition, doxorubicin hydrochloride (European Pharmacopoeia reference stand-ard), acetic acid (Panreac), sodium tripolyphosphate (Sigma Aldrich, 85%), distilled water.
5.6.2 Procedure
In all experiments using DOX, its concentration in solutions was determined through cali-brations curves with absorbance measured by ultraviolet visible spectrophotometer (UV-Vis, T90+ PG Instruments) in a range of concentrations between 5 and 50 μg/ml of DOX. The
ab-sorbance was measured in wavelength of 480 nm, DOX maximum abab-sorbance peak [31, 38]. These DOX calibration curves were performed for all the solvents used in the experiments: wa-ter, phosphate buffer saline (PBS) with pH 7.4, PBS with pH 6.5 and Hac/NaAc (pH 4.5). These measures to obtain the calibration curves were made in quadruplicates.
Doxorubicin was incorporated during chitosan nanoparticles production (sub chapter 5.3). Before adding the crosslinker (TPP), DOX with different concentrations was added to chitosan acidic solution (1.2% w/v in acetic acid at 1% v/v) and was in magnetic stirring for 10 min. After adding TPP (0.25% (w/v)) to 0.5 ml of DOX+Cs solution, the solution was centrifuged (Sigma 1-13 centrifuge) for 5 min at 10000 rpm. Supernatant was removed and 1 ml of distilled water was added to the pellet and was centrifuged again under the same conditions. This resultant super-natant was also removed. The absorbance of the two supersuper-natant DOX concentrations was measured by UV-VIS spectroscopy at wavelength of 480 nm and encapsulation efficiency (EE) was calculated (Equation 2).
𝑬𝑬 (%) =(𝒊𝒏𝒊𝒕𝒊𝒂𝒍 𝒎𝒂𝒔𝒔 𝒐𝒇 𝑫𝑶𝑿)−(𝒎𝒂𝒔𝒔 𝒐𝒇 𝑫𝑶𝑿 𝒊𝒏 𝒔𝒖𝒑𝒆𝒓𝒏𝒂𝒕𝒂𝒏𝒕𝒔) 𝒊𝒏𝒊𝒕𝒊𝒂𝒍 𝒎𝒂𝒔𝒔 𝒐𝒇 𝑫𝑶𝑿 × 𝟏𝟎𝟎 Equation 2
In a way to study its influence and to reduce the quantity of reagents used, to a solution with 1:3 (w/w) DOX to Cs, with a concentration of 1.33 mg/ml of DOX, the encapsulation effi-ciency was tested for different ratios of crosslinking agent (TPP) to chitosan: 1:4.8 (w/w), 1: 2.4 (w/w) and 1:1.6 (w/w). Encapsulation efficiency to a ratio of 1:0.533 of TPP:Cs was investigated as well, in this case using a concentration of 1 mg/ml of DOX, as it were the conditions used in the study of DOX release profile.
Encapsulation efficiency was also determined for DOX loaded o-HTCC nanoparticles and
for DOX loaded chitosan coated SPION’s and o-HTCC coated SPION’s, through the same
method as for Cs nanoparticles. In the case of o-HTCC nanoparticles, was studied the influence
of the proportion of TPP:o-HTCC in the encapsulation efficiency, by testing it to different TPP:o
-HTCC ratios: 1:4.8 (w/w), 1:2.4 (w/w), 1:1.6 (w/w) and 1:0.533 (w/w), for the four o-HTCC
mo-lecular weights in study and using 1 mg/ml concentration of DOX.
As for Cs or o-HTCC coated SPION’s, it was only determined the encapsulation
efficien-cy on the conditions used later in the study of DOX release profiles, which were 1:0.533 TPP:Cs or TPP:o-HTCC ratio, depending on the case, and 1:6 DOX:Cs or DOX:o-HTCC, respectively,
which means an initial concentration of DOX of 1 mg/ml. In these coated SPION’s were only
used polymers (chitosan or o-HTCC) with the highest and the lowest molecular weight.
All experiments using DOX were performed in the absence of light in order to avoid its photodegradation. Each type of experiment was performed in triplets.
5.7 DOX release studies
5.7.1 Materials
Chitosan and o-HTCC with four different molecular weights, SPION’s produced by
thermal decomposition, doxorubicin hydrochloride (European Pharmacopoeia reference stand-ard), acetic acid (Panreac), sodium tripolyphosphate (Sigma Aldrich, 85%), distilled water.
5.7.2 Procedure
Doxorubicin release profiles were determined in buffers with pH 7.4, 6.5 and 4.5, which represent some physiological conditions found in the body and in tumour cells. All release stud-ies started with 1 mg of DOX. It was used DOX + Cs solution in a proportion of 1:6 (m/m), with TPP in 1:0.533 (m/m) TPP to Cs.
First, 1ml of Cs+DOX was added to 4.5 ml of TPP (0.25% w/v), stirred in ULTRA-TURRAX for 5 min. This solution was then centrifuged (Heraeus Multifuge X1R centrifuge –
Thermo Scientific) for 10 min at 12000 rpm. The resultant supernatant was stored and 3 ml of
in subchapter 5.6, DOX concentration values were determined, allowing the calculation of the percentage of drug released at each period of time.
Controls were also made in the same way by dialyzing 1 ml of free DOX and varying the pH of the release medium (4.5, 6.5 and 7.4).
Figure 5.2 - Dialysis membrane containing DOX loaded chitosan nanoparticles solution before starting release experiments.
Freeze-dry is a way to prevent polymer degradation and drug leakage and desorption and nanoparticles appear to be easily redispersible when dried [28]. After doing some experi-ments through this procedure, it was decided to try to work with freeze-dried nanoparticles, as this is one of the most used ways to preserve and store polymeric nanoparticles. In this way, the last procedure was slightly changed in the initials steps, cutting of the centrifugations. So 1ml of Cs+DOX was added to 4.5 ml of TPP (0.25% w/v), stirred in ULTRA-TURRAX for 5 min, and then freeze-dried for 24h (VaCO2 ZIRBUS technology; -45 ºC and 0.07 mbar). The resultant powder of DOX loaded Cs nanoparticles was then resuspended in 1 ml of PBS with pH 7.4 and dialyzed. The rest of the steps were exactly the same. Using freeze-dried nanoparticles it was possible to make sure that the initial mass of DOX was always the same (1 mg) in each experi-ment, what did not happened in the first trials, due to the two centrifugations. It also allowed the same swollen state of chitosan in each trial, as it was all dried in the beginning. Thus, this was the chosen method for all the drug release studies done.
DOX release profile from chitosan nanoparticles was performed for each one of the four molecular weights in study.
Besides chitosan nanoparticles, it was also studied DOX release profile from o-HTCC
nanoparticles for its four molecular weights, from Cs coated SPION’s and from o-HTCC coated
SPION’s, always through this last referred procedure. In this last case, SPION’s coating was
made with only the highest and the lowest molecular weight of chitosan or o-HTCC,
respective-ly.
All these drug release experiments using freeze-dried nanoparticles were made in tri-plets; the first ones without freeze-drying were only performed in triplets for pH 7.4, in the others pH were a one time trial. A summary of all DOX release trials made is presented in Table 5.1