A proposal for improvements of the Data Vault
Ensemble process approach to retrieve Big Data
Tahira Jéssica da Silva Ruivo Vissaram
Data Vault limitations and optimization
Dissertation presented as partial requirement for obtaining
the Master’s degree in Information Management
NOVA Information Management School
Instituto Superior de Estatística e Gestão de Informação
Universidade Nova de LisboaA PROPOSAL FOR IMPROVEMENTS OF DATA VAULT ENSEMBLE
PROCESS APPROACH TO RETRIEVE BIG DATA
by
Tahira Jéssica da Silva Ruivo Vissaram
Dissertation presented as partial requirement for obtaining the master’s degree in Information Management, with a specialization in Information Systems and Technologies Management
Advisor / Co Advisor: Dr. Vítor Santos
ACKNOWLEDGMENT
I would like to express my sincere gratitude to my supervisor, Ph.D. Professor Vítor Santos, for the support, motivation, guidance, and persistence that drove me to complete this dissertation, as well as the knowledge it transmits.
I am also extremely grateful to the Nova IMS institution, all the teachers and staff for these years of learning and motivation as a student, who have enabled the conditions for this final work to be executed and helped me in my professional career.
A special thanks to my mother and my brother, for their unconditional support, for their encouragement, love, and dedication.
Finally, I thank all my friends who directly or indirectly contributed to this work, with words of encouragement and motivation.
ABSTRACT
Data becomes the most powerful asset in an organization due to the insights and patterns that can be discovered and because it can be transformed into real-time information through BI tools to support decision making.
So, it is crucial to have a DW architecture that stores all the business data of an organization in a central repository to be accessible for all end-users, allowing them to query the data for reporting. When we want to design a DW, the most common approach used is the Star Schema, created by Kimball; however, the costs of maintenance and the re-design of the model, when the business requirements and business processes change, or even when the model needs to be incremented are very high and have a significant impact on the whole structure.
For that reason, a Data Vault approach invented by Dan Linstedt emerged, which brings a
methodology more oriented to auditability, traceability, and agility of the data, which rapidly adapts to the changes of the business rules and requirements, while handling large amounts of data. Therefore, this hybrid modus operandi combines the best of 3NF and Star schema, being flexible, scalable, consistent, whereupon the costs of implementation and maintenance become reduced, without the need to modify all the model structure, allowing increment building of new business processes and requirements.
However, as it is still recent, the Data Vault approach has limitations compared to Star Schema, requiring many associations to access and execute ad-hoc queries, which makes end-user access to the model difficult. Consequently, the model has low performance, and more storage is required due to denormalization.
Although both are competitors, when we refer to building an EDW capable of providing a central view of all business, the Star Schema and Data Vault 2.0 approaches complement each other according to Data Vault Architecture. On the top of the Data Vault, in the information delivery layer, as the Data Vault cannot be accessed for end-users, Data Marts are created using Star Schemas or OLAP cubes to apply BI tools to perform reports for organizational decision-making.
So, briefly, the purpose of this Dissertation is, through a case study, to compare the Star Schema model with the Data Vault 2.0 Ensemble model. Also, to demonstrate the limitations of Data Vault 2.0 studied and present an optimized way of designing a Data Vault 2.0 model, reducing the joins required to query the data, minimizing the complexity of the model, and allowing users to access directly to the data, instead of creating Data Marts.
KEYWORDS
INDEX
1.
Introduction ... 1
1.1.
Problem justification ... 1
1.2.
Problem (Research Question) / General objective (Main goal) ... 2
1.2.1.
Specific objectives ... 2
1.3.
Methodology ... 3
1.4.
Case Study Research ... 3
1.5.
Case study strategy ... 4
1.6.
Methodology and Tools... 4
2.
Literature review ... 5
2.1.
Data Warehouse and Big Data Concepts ... 5
2.1.1.
Big Data Concept ... 5
2.1.2.
Data Warehouse definition ... 7
2.2.
Data Modelling and Big Data challenges ... 8
2.3.
Data Integration problems ... 9
2.4.
Problems with Traditional Data Warehousing and Business Intelligence ... 13
2.5.
Data Vault Ensemble Modeling ... 17
2.5.1.
Data Vault Fundamentals ... 18
2.5.2.
Data Vault Architecture ... 24
2.5.3.
Benefits, disadvantages and limitations of Data Vault Approach ... 26
2.5.4.
Comparison with other dimensional models ... 28
4.
Case study ... 31
4.1.
Data Sources and Data Collection ... 32
4.1.1.
Business Entities ... 33
4.1.2.
Data dictionary of ER model ... 35
4.2.
Differences between a Relational model and a Dimensional model ... 38
4.2.1.
Traditional DW model - Star schema ... 39
4.2.2.
Traditional Data Vault 2.0 Ensemble Modeling ... 51
4.2.3.
The proposal for the optimized Data Vault 2.0 model... 64
5.
Results and Discussion... 76
6.
Conclusions ... 82
7.
Limitations ... 83
8.
Recommendations for future works ... 84
Annexes ... 89
Load Dimension tables – ETL process ... 89
LIST OF FIGURES
Figure 1 - The three V's of Big Data, (Whishworks, 2017) ... 6
Figure 2 - Big Data drivers and risks, (EY, 2014) ... 7
Figure 3 - ETL Pipeline, (Hultgren, 2012) ... 10
Figure 4 - Implementation problems in Business Intelligence projects, (BI-Survey.com, n.d.)16
Figure 5 - Data Vault EDW, (Hultgren, 2012 ... 18
Figure 6 - Data Vault EDW, (Hultgren, 2012) ... 19
Figure 7 - Data Vault EDW, (Hultgren, 2012) ... 20
Figure 8 - Hub table, adapted by (Hultgren, 2018) ... 21
Figure 9 - Link table, adapted by (Hultgren, 2018) ... 22
Figure 10 - Satellite table, adapted by (Hultgren, 2018) ... 23
Figure 11 - Data Vault Architecture, (Linstedt & Olschimke, 2015) ... 25
Figure 12 - Parallel load in Data Vault 2.0 approach, (Hultgren, 2012) ... 27
Figure 13 - SWOT analysis ... 32
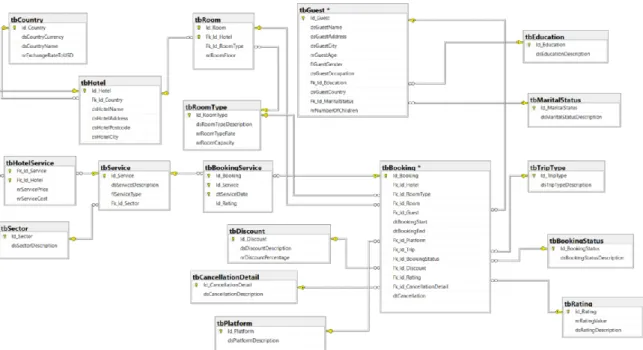
Figure 14 - ER model data source from Hotel Chain ... 33
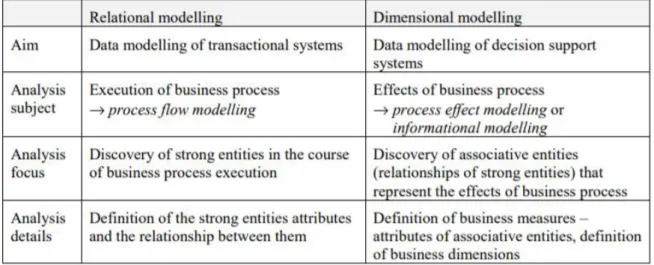
Figure 15 - Main differences between relational and dimension modeling,(Varge, 2001) ... 38
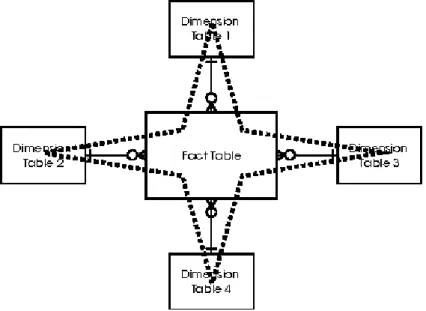
Figure 16 - Star Schema model, (Moody & Kortink, 2000) ... 39
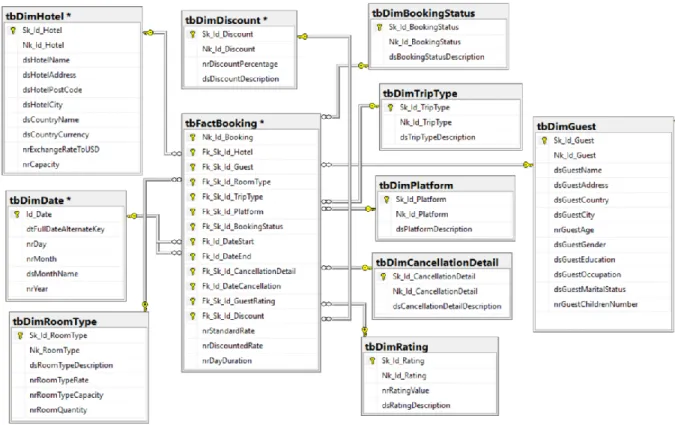
Figure 17 - Star schema model for Bookings Management ... 40
Figure 18 - Star schema model for Services Management ... 40
Figure 19 - Load Dimension and Fact tables dtsx ... 47
Figure 20 - Load Fact Tables package in SSIS ... 48
Figure 21 - Fact Booking measures, through derived column component... 48
Figure 22 - ETL process to Load Fact Booking ... 49
Figure 23 - OLE DB Source, using a SQL command to extract services data from source ... 49
Figure 24 - ETL process to Load Fact Service... 50
Figure 25 - Load Dimension Tables package in SSIS ... 51
Figure 26 - Traditional Data Vault 2.0 Model ... 56
Figure 27 - Load Hubs, Links and Satellites tables dtsx ... 58
Figure 28 - Load Hubs entities package in SSIS ... 58
Figure 29 - Example of load a Hub table in SSIS ... 59
Figure 30 - Adding metadata attributes in the Hub entity... 59
Figure 31 - Load Link tables package in SSIS ... 60
Figure 32 - Adding metadata to the Link table ... 60
Figure 33 - Example of load a Link table in SSIS ... 61
Figure 35 - Adding metadata to the Satellite tables ... 62
Figure 36 - Update new records in SSIS ... 63
Figure 37 - Example of load a Satellite table in SSIS ... 63
Figure 38 - Case 1 - query result in Data Vault 2.0 model... 65
Figure 39 - Case 2 - Query result in Data Vault 2.0 model ... 66
Figure 40 - Proposal for an optimized Data Vault 2.0 model ... 67
Figure 41 - Bridge Booking Sales table ... 69
Figure 42 - SQL Stored Procedure to load the Bridge Booking Sales table ... 70
Figure 43 - Query result using the Bridge Booking Sales table in Data Vault optimized model
... 70
Figure 44 - Bridge Booking Guest table ... 72
Figure 45 - SQL Stored Procedure to load the Bridge Booking Guest table ... 72
Figure 46 - Query result using the Bridge Booking Guest table in Data Vault optimized model
... 73
Figure 47 - Creation of views using Bridge tables ... 74
Figure 48 - SQL query to create the Booking Sales view by using the Bridge Booking Sales table
... 74
Figure 49 - SQL query to create the Booking information view by using Bridge Booking Sales
table ... 74
Figure 50 - - SQL query to create the Guest Information view by using Bridge Booking Guest
... 75
Figure 51 - Load Hotel Dimension table ... 89
Figure 52 - Load Discount Dimension table ... 89
Figure 53 - Load Booking Status Dimension table ... 90
Figure 54 - Load Cancellation Detail Dimension table ... 90
Figure 55 - Load Services Dimension table ... 91
Figure 56 - Load Trip Type Dimension table ... 91
Figure 57 - Load Room Type Dimension table ... 92
Figure 58 - Load Rating Dimension table ... 92
Figure 59 - Load Platform Dimension table ... 93
Figure 60 - Load Guest Dimension table ... 94
LIST OF TABLES
Table 1 - Differences between ETL and ELT, adapted by (Smallcombe, 2019) ... 13
Table 2 - Main differences between traditional and modern DW, adapted by (McCue, 2007;
Santoso & Yulia, 2017) ... 14
Table 3 - Principal features of BI, adapted by (Chugh & Grandhi, 2013) ... 16
Table 4 – Different concepts in different Data Models (Bojičić et al., 2016) ... 28
Table 5 - Compare Inmon, Data Vault and Kimball approaches, (adapted by Orlov, 2014) .... 30
Table 6 - Business entities of the ER model ... 35
Table 7 - Case study attributes, data dictionary of ER model ... 37
Table 8 – Fact Tables Booking and Service measures ... 41
Table 9 - Hotel dimension attributes ... 42
Table 10 - Cancellation dimension attributes ... 43
Table 11 - Discount Dimension attributes... 43
Table 12 - Booking Status dimension attributes ... 43
Table 13 -Trip type dimension attributes ... 44
Table 14 - Date dimension attributes ... 44
Table 15 - Room type dimension attributes ... 45
Table 16 - Customer dimension attributes ... 46
Table 17 - Platform dimension attributes ... 46
Table 18 - Rating dimension attributes ... 46
Table 19 - Service dimension attributes... 47
Table 20 - Identification of Hubs and business keys ... 52
Table 21 - Booking Satellites ... 53
Table 22 - Service Satellites ... 53
Table 23 - Hotel Satellites... 54
Table 24 - Guest Satellites ... 54
Table 25 - Room Satellite ... 55
Table 26 - Link entities ... 55
Table 27 - Bridge Booking Sales table ... 68
Table 28 - Bridge Booking Guests table ... 71
Table 29 - Results of case study ... 80
LIST OF ABBREVIATIONS AND ACRONYMS
BI Business Intelligence
CWM Common Warehouse Metamodel
DW Data Warehouse
DWBI Data Warehouse and Business Intelligence
EDW Enterprise Data Warehousing
EWBK Enterprise Wide Business Keys ELT Extract, Load, and Transform
ETL Extract, Transform and Load
IS Information System
KPI Key Performance Indicators
MPP Massively Parallel Processing
NF Natural Form
OLAP Online Analytical Processing
1
1. INTRODUCTION
Nowadays with the expansion of the Internet and consequently with the increase of information systems (Sarker, Bin Deraman, Hasan, & Abbas, 2019) ) and diffusion of the social networking, mobile computing, and online advertising, companies are faced with large amounts of data – Big Data (Hashem & Ranc, 2015), that are crucial to their core business. The information transforms into a powerful and strategic resource that can support decision-making grounded with real facts that allow companies to achieve medium and long-terms goals (EY, 2014).
However, most of the data that are collected can be challenging to provide feasible answers due to the multiple sources of information. These data are subject to various transformations, are unrelated to the various departments of the organization, have no standards or structure, and can sometimes be obsolete (Oumkaltoum, Mohamed Mahmoud, & Omar, 2019).
The solution for companies to lead with Big Data is to implement an approach capable of transforming these large volumes of data - Data Warehouse, into useful information, and
consequently reliable knowledge to the decision-making process. Besides, this multi-dimensional approach is a robust architecture to apply techniques of data analysis and reporting using heterogeneous data sources that can be accessed and understood (Ballard et al., 1998).
These heterogeneous data sources contain structured, unstructured, and semi-structured data in different formats in real-time, which leads to Big Data. Traditional databases cannot handle these large volumes of datasets, so data modeling becomes relevant research for designing an architecture capable of defining and categorizing them, establishing standard definitions and descriptors, allowing the consumption of the data (Rao, Mitra, Bhatt, & Goswami, 2018).
The Inmon and Kimball approaches are the most famous methodologies used when designing a DW. However, a new approach created by Dan Linstedt, the Data Vault approach, has revealed
importance in recent years, in the way of building a DW through raw data (unprocessed) from heterogeneous sources (Yessad & Labiod, 2017). The emergence of this approach has enabled the traceability of the data and improved the scalability, flexibility, and the productivity of the DW compared with other data models (Bojičić et al., 2016) and the total cost of ownership is low (Yessad & Labiod, 2017).
Data Vault aims to represent the real core business of the company (Inmon & Linstedt, 2015), consisting of an incremental approach (flexibility), without requiring the total redesign of the dimensional structure (Naamane & Jovanovic, 2016), which provides added value to large amounts of data, Big Data, that are constantly changing and that fit in budgetary expectations (Hultgren, 2012).
1.1. P
ROBLEM JUSTIFICATIONOrganizations handle large amounts of data daily, which makes it challenging to adapt to the constant changes in the business rules and requirements. Big Data still needs to confront challenges to achieve a successful architecture model (Storey & Song, 2017), which is why data modeling
2 capable of integrating, aligning, and reconciling unpredictable formats of mainly unstructured and multi-structured data is crucial (Hultgren, 2012).
Data Vault represents a viable and effective approach to modeling data that needs to be traceable, respond to the business changes over time, integrate multiple types of sources, capable of
incrementing new subject areas, highly agile, and the most important, with lower maintenance costs (Hultgren, 2012).
Although this methodology is very useful for managing, architecting, and abstracting the main business requirements, it is a model that still presents limitations when storing and accessing the data. Data Vault cannot be used by end-users, due to the exhaustive joins that need to be performed, for querying the data, which will have a significant impact on the model performance (Naamane & Jovanovic, 2016).
So the challenge will be modeling Big Data into a DW architecture, through the Data Vault 2.0 Ensemble approach, to understand the main challenges that companies face when designing a conceptual model, and on the other hand, demonstrate the main limitations of this approach,
comparing them to the Star Schema model and present an optimized model capable of responding to the limitations found.
1.2. P
ROBLEM(R
ESEARCHQ
UESTION)
/
G
ENERAL OBJECTIVE(M
AIN GOAL)
The main purpose of this Dissertation is to propose improvements in the Data Vault 2.0 approach by retrieving Big Data in order to optimize the exhaustive joins needed to connect the main entity elements in the Data Vault approach: Hubs, Links, and Satellites. Furthermore, another goal of this Dissertation is to compare the Data Vault 2.0 model with the traditional DW model - Star Schema model and demonstrate the limitations that DW projects still face by using the Data Vault 2.0 approach.
A new Data Vault 2.0 model will be proposed with the aim of minimizing the Data Vault limitations and allowing end-users to be capable of accessing and querying the data using this approach, which is possible by applying BI tools directly.
1.2.1. Specific objectives
The following research questions will be researched and studied to achieve the goal under study: ▪ What are the benefits and the disadvantages of Data Vault 2.0, compared with the Kimball
approach?
▪ Why is Data Vault not an end-user approach?
▪ Can end-users apply BI tools in Data Vault 2.0 architecture directly? ▪ What are the limitations of the Data Vault 2.0 Ensemble approach?
▪ Why are so many joins used to relate the entities in the Data Vault 2.0 Ensemble? ▪ Is there a way to optimize the Data Vault 2.0 model?
3
1.3. M
ETHODOLOGYExploratory research will be conducted In the scope of this master dissertation. The main goal is to provide a better understanding of the research questions identified and find improvements and limitations in the framework under study.
The purpose will be to reveal new standards and insights around the concepts in the study to provide an optimized model to deliver a better response to the challenges faced by organizations.
The choice of this type of research design is based on flexibility and adaptability to the change that it yields since the goal is to observe and comprehend the data and discover new ideas by tentative means.
The research method used is based on a qualitative research method, a case study, as described below, to increase the knowledge and find new aspects relevant to this phenomenon.
1.4. C
ASES
TUDYR
ESEARCHA case study method allows exploring, investigating, and gaining a better understanding of data coming from a given scenario (Bolder-Boos, 2015).
Case study research is used to investigate the phenomenon under study more deeply and profoundly, to get more contextual insights and understandings (Yin, 2008). Besides, case study methods allow researchers to respond to “How” and “Why” questions of the study problem and do not require any control over it (Yin, 2008).
A case study is a “general term for the exploration of an individual, group or phenomenon” (Sturman, 1997), corresponding to an extensive description of the case and its analysis (Starman, 2013).
According to (Simons, 2009) a case study is an in-depth exploration from multiple perspectives of the complexity and uniqueness of a particular project, policy, institution, program, or system in real life”. Case study research can present some advantages regarding its capacity to reach high conceptual validity, which consists of determining and quantifying the indicators related to the theoretical concepts under study. Case studies also integrate methods capable of inducing new hypotheses or even identifying new variables pertinent to particular cases. Besides, it allows researchers to examine causal mechanisms in detail on an individual case context and have a strong capability to adjust in complex causal relations (Starman, 2013).
Briefly, this case study will allow investigating, exploring, demonstrating, and gathering results of this specific scenario in a more practical component, with the objective of justifying and supporting the analysis under study.
4
1.5. C
ASE STUDY STRATEGYAn emblematic case study from a typical BI project was chosen to achieve the research objectives. The strategy is to apply the Data Vault process approach with some improvements and see if these improvements bring benefits beyond the respectable traditional Data Vault.
If these improvements are to be observed, as this is a typical BI project, it can be inferred that the proposed improvement measures will also benefit future projects.
In summary, with this case study, it will be possible to understand, analyze, compare, and study, on a technical level, what the types of differences in the implementation of these approaches are, which is the model that can most quickly meet the expectations and business needs and using the data, to demonstrate limitations and forms of optimization that still exist in the emerging Data Vault
approach in recent years.
1.6. M
ETHODOLOGY ANDT
OOLSThis case study implemented Kanban, an agile methodology, owing to the interactivity and incremental building that provides. Moreover, this methodology allows changes, adjusting to the business requirements, and is focused on the business value and end-users, leading to the quality improvement of each delivery.
Besides, the Data Vault Ensemble approach is focused on this methodology, which is capable of adapting to business changes and improving the model quality.
Regarding the tools, for the creation of the models, a Star schema and Data Vault models will be based on Microsoft tools, such as SQL Server Management Studio 2017 and SQL Server Data Tools 2015, due to the licenses provided by Nova Information Management School.
5
2. LITERATURE REVIEW
In this chapter, a theoretical background will be presented in order to introduce the main studies and research already done, associated with the topic of this Master’s Dissertation.
In order to sustain the theoretical research and to perform and support the Dissertation presented, some subjects related with data structures and the conceptual data model, data integration issues, traditional DW problems, main challenges with Big Data and finally the Data Vault modeling and comparison with Inmon and Kimball approaches are included in the study.
This literature review aims to understand the main problems and challenges when implementing a DW using Big Data, that organizations are faced with nowadays, and the strategies that they use. As a foundation to define and collect studies and research about the Data Vault approach and compare the Linstedt’ DW methodology with the Inmon and Kimball approaches, in order to comprehend the benefits, disadvantages, and limitations when developing a DW project with large amounts of data. To start and for a better understanding of the two main concepts most discussed in this Dissertation, Big Data and Data Warehouse, a definition of these two notions are presented.
2.1. D
ATAW
AREHOUSE ANDB
IGD
ATAC
ONCEPTSBefore presenting the theoretical background collected related to the topic of this Dissertation, it is crucial to define the two main concepts that will be addressed during this research: Big Data and Data Warehouse.
2.1.1. Big Data Concept
Big Data concept is related to a large amount of data that is dynamic because it is continuously changing, which people, tools, and machines create (EY, 2014).
Gartner defines Big data as “high-volume, high-velocity, and/or high-variety information assets that demand cost-effective, innovative forms of information processing that enable enhanced insight, decision making, and process automation” (Gartner, 2012). Increasingly unstructured data are faced with exponential growth due in large part to the explosion of machine-generated data and the human engagement within the social networks (Eberendu, 2016).
In the beginning, the term Big Data was characterized, according to Doug, by three key concepts: volume, velocity, and variety. The volume corresponds to the total amount of data that is generated and increased by the e-commerce channels. The velocity responds to how often data is generated by these e-commerce channels, which needs to be stored and finally the variety concept, which
determines the heterogeneity of the data sources, induced incompatible data formats, non-aligned data structures, and inconsistent data semantics, making the adoption of an effective data
management critical (Laney, 2001).
Later, by incorporating structured, semi-structured, and unstructured data, Big Data was again characterized, adopting one more V: Veracity, related to the truthfulness of the data, and their integration. The amount of data that is created is enormous compared to traditional databases,
6 encompassing a diversity of sources, which are generated continuously and to rapid processing. Since the data coming from various data sources, it is necessary to test its veracity (EY, 2014).
Figure 1 - The three V's of Big Data, (Whishworks, 2017)
Currently, the Big data concept has 7 V’s associated: Volume, Velocity, Variety, Veracity, Variability, Visualization, and Value (Mcnulty, 2014). Incorporating new V’s: Variability which is associated to the constantly changing data, Visualization that corresponds to the representation of the large volume of data to be understandable for those who use it, and finally, Value, related to the significance of the data for the business goals (Mcnulty, 2014). For these massive amounts of data, it is necessary to have scalable technology capable of collecting, storing and analytically processing all the information (EY, 2014), in order to extract and gain insights to transform into knowledge, increasing their
competitive advantage, become more innovative and increase their level of productivity (Eberendu, 2016).
7
2.1.2. Data Warehouse definition
Gartner defines a DW as an architecture that stores data from different data sources (transactional systems, operational data, and external sources), which aggregate all these data and business requirements into a single one enterprise-wide view suitable for reporting and data analysis for the decision-making process (Gartner, 2019).
A DW is characterized as being subject-oriented, giving information of a specific business subject, integrated, which collects heterogeneous sources into a single one, nonvolatile because the data is not updated or changed, once inserted into the DW, and in the last time-variant, due to the data being related to a certain period of time (Inmon, 2002).
The advantages of creating a DW are related to the following characteristics (Almeida, 2017): ▪ Integrating data from multiple sources;
▪ Performing new types of analytical analysis; ▪ Reducing costs to access historical data;
▪ Standardizing data across the organization, having a single vision of the data; ▪ Improving turnaround time for analysis and reporting;
▪ Sharing data and allowing others to access data easily; ▪ Supporting ad-hoc reporting and inquiry;
▪ Reducing the development burden on IS/IT;
▪ Removing informational processing load from transaction-oriented databases. However, the adoption of this architecture can lead to some challenges (Almeida, 2017):
▪
Time-consuming preparation and implementation;▪ Difficulty in integration compatibility considering the using of different technologies; ▪ High maintenance costs;
▪ Limited use due to confidential information; ▪ Data ownership and data security;
▪ Underestimation of ETL processing time; ▪ Inability to capture the required data; ▪ Increased demands of the users.
The costs of building and maintenance of a DW can be very high and significantly different from the cost of a standard system, due to the large volume of data that the DW stores, the cost of the keeping the interface between the DW and the operational sources (depending of the use of the ETL tools or not) and the implementation of the DW is never done, due to the ongoing need of adding new data or new areas to the DW (Inmon, 2002).
Data Warehousing is a collection of decision support technologies that allows experts (management, analysts) to make better and quicker responses in decision-making (Chaudhuri & Dayal, 1998).
8 The importance of Data Warehousing increases with the need to structure and store data for the decision-making process of the companies. This factor is considered as a powerful and tangible asset, which can bring competitive advantages in the business world. The purpose of creating a DW has been growing due to the vast quantities of data that are generated by organizations, which they need to access and use for the quotidian of the business (Ballard et al., 1998).
2.2. D
ATAM
ODELLING ANDB
IGD
ATA CHALLENGESCompanies are faced with large amounts of data due to the development of new technologies, which have been growing exponentially. This information boom is characterized by the difficulty of the process to interpolate and aggregate all the data to support the organization's data structure, especially for data management and decision-making (Oumkaltoum et al., 2019).
Conceptual data modeling becomes increasingly, more crucial in the sense of documenting and understanding the whole organization's existing data elements and attributes, the flow of the information, and particularly how they can be associated - relationships between the data (Teorey, Jagadish, Modeling, & Edition, 2011).
Data modeling consists of a representation/visualization of the business world, incorporating abstraction and a reflection of the business area, before any implementation, which is why it is so important. This concept is characterized as a well-organized abstraction of business data (Ballard et al., 1998).
Furthermore, the conceptual data model is essential because it defines the business objects (data abstraction) and their properties (attributes). Permits communication with all members involved, who do not need any expertise to understand the business model, identifies the scope of the business data and defines the cardinalities (associations) of the relations between the data objects (Teorey et al., 2011).
Designing a conceptual data model is an iterative process, which becomes more detailed as the entities and relationships are added to transform logical designs into physical designs (Hultgren, 2012).
Nevertheless, it is also essential that the definition of the requirements is clear to be possible to model a conceptual data model. Otherwise, the IS project fails due to reasons such as unclear and incomplete requirements and specifications, user input, or lack of it and constant change of the requirements by the stakeholders. Although the design of the IT structures is essential for success, this continuously presents some challenges (Gemino & Wand, 2003).
Besides, it is challenging to design a DW architecture due to the business dynamism and complexity of the data. It is not realistic that the information continues static, and the requirements are not always provided at the beginning of a DW project (Jovanovic, Romero, Simitsis, Abelló, & Mayorova, 2014). Nowadays, the DW must be adaptable to the constant data and source changes.
With the arising of the Big Data era, the design process becomes more difficult to organize and represent. The challenges faced becoming bigger because of the volume of the data, the uncertain
9 veracity of the data, the variety of the sources, and finally, due to the fast velocity that data comes and changes (Gil & Song, 2016).
Besides, the variety of data in different formats, different platforms, and structures make it difficult to represent a big picture perspective (Ballard et al., 1998).
However, modeling is an essential key to communicate with the stakeholders, to codify the business needs and requirements, and more importantly, to provide technical aspects and details for the developers build the DW (Hultgren, 2012).
Before any implementation, the ideal is to analyze and design the data structure, to have a solid conceptual data model capable of representing the business and the data flow, of providing a better selection of the DW approach to be used. This step will ensure an effective DW and the reduction of costs in implementation (Ballard et al., 1998).
Many data modeling approaches exist to design DW architectures, and they are designed with the same characteristics, tables, and relationships. So, the main difference between them is the essence of the rules established and their purpose in the way of model these tables and relationships (Hultgren, 2012).
When we talk about significant amounts of data, the Data Vault modeling approach is considered one of the most effective, because the primary purpose of this methodology is oriented
requirements, integration of multiple heterogeneous sources, especially unstructured data (semi-structured, multi-structured) and the provision of agility, absorbing the business changes rapidly (Linstedt & Olschimke, 2015).
The principal difference between the traditional modeling approaches is that the design is not expected to receive business changes, because their source systems are constant, and the project scope is restricted to specific requirements. The auditability and an Enterprise view of data are required or planned (Hultgren, 2012).
2.3. D
ATAI
NTEGRATION PROBLEMSData integration is critical in the process of building a DW (Calvanese, De Giacomo, Lenzerini, Nardi, & Rosati, 2002).
However, with the Big Data era, data integration requires special attention in the way of extracting data from massive data sources. The variety, volume, and overlap of the data provide some
efficiency and effectiveness problems when we talk about the integration of the data. The massive volume of data can be very costly and bring some issues when accessing all the data sources, which makes it challenging to achieve scalability and efficiency (Linstedt & Olschimke, 2015).
Moreover, data integration can deal with other kinds of challenges, such as the semantics and meaning of the business objects, the grain, and precision, accuracy, and quality of data defining the keys and the identifiers, the formats, defaults, exceptions rules, null interpretations, temporal and timeline issues, the consistency of loads and changes and reengineering of the data and
10 In the process of integrating data from the source to the DW structure, the data can suffer
redundancies and inconsistencies (Calvanese et al., 2002) that must be solved through the ETL tools. It is vital to consider some data quality criteria in order to have a reconciled and integrated view of business data. Consistency, validity, conformity, accuracy, and integrity are keywords when it comes to data processing (Shivtare & Shelar, 2015). These ensure that the data that we are going to load at the destination is non-conflicting and consistent data, reasonable over a given period, accurate and useful to the real world, and if they can relate to each other.
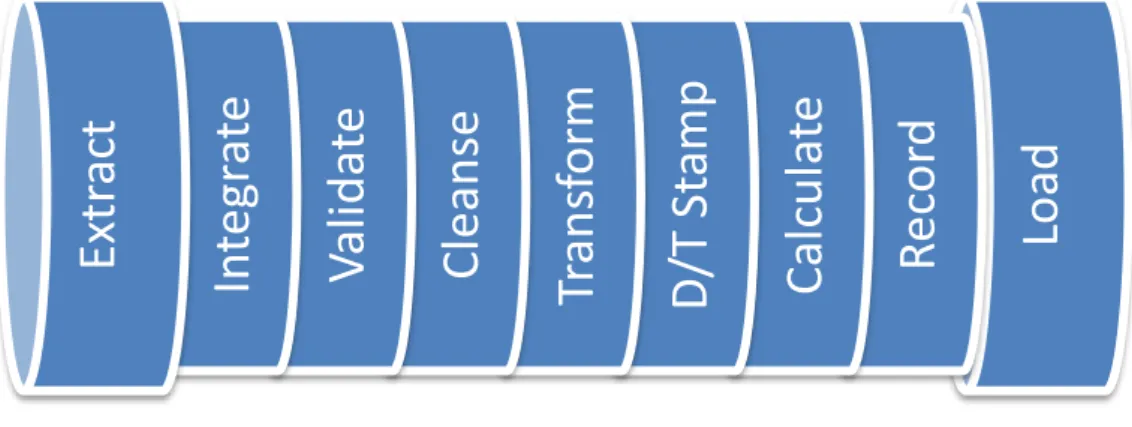
Figure 3 represents the different forms of transformations possible in the Extract and Load processes of ETL.
Figure 3 - ETL Pipeline, (Hultgren, 2012)
However, it is not always possible to ensure efficient data integration for multiple reasons. Bad data, unexpected changes, different formats, and missing data in source systems, the non-compliant data in the sources with standards, the complex DW, the different encoding formats and lack of business ownership, policy and planning of the entire enterprise data contribute to data quality problems (Shivtare & Shelar, 2015) and are some of the most prevalent issues with which the integration process deals.
Currently, in the Big Data era, data integration becomes critical due to the variety of the data, which is provided from autonomous and heterogeneous data sources, being more vulnerable to the overlapping of the data. Besides, the characteristics of Big Data brings challenges, especially in efficiency and effectiveness aspects (Lin, Wang, Li, & Gao, 2019).
The massive data sources that are needed to be handled in order to integrate Big Data makes the process costly and sometimes impossible to access the data, requiring high computational complexity and efficient algorithms capable of dealing with this phenomenon (Lin et al., 2019). Data quality also becomes a concern in the data integration strategy because bad data quality can bring poor insights and improper decision-making (Brown, 2019).
Loa
d
R
ec
or
d
C
al
cul
at
e
D
/T
St
am
p
Tr
an
sf
orm
C
le
an
se
V
al
ida
te
In
te
gr
at
e
Ex
tr
ac
t
11 With the Big Data paradigm, data integration also suffers some changes in the methods of
transforming and loading data from diverse sources to one location. The typical ETL process, which is well-known and used in data integration, has now been replaced by the ELT technique.
In ETL, after the extraction of data, the transformation of data was performed before being loaded to the final architecture. However, now, with Big Data, this process becomes more complex due to data that are generated in large quantities (Smallcombe, 2019). So, data is loaded first, and the necessary transformations are made afterward. However, this new technology is very recent, so the ELT pipeline presents challenges, and it is necessary for experts to implement this.
The following table 1 presents the differences between these two concepts (ETL and ELT), for a clearer understanding.
Characteristics ETL ELT
Adoption of the technology and
availability of tools and experts
Very well known to expertise over the last 20 years.
New technology, so it can be difficult to locate experts
Availability of data in the system
It only transforms and loads the necessary data for the DW. The data is transformed before the load.
Loads all data immediately, and users can determine which data to transform and analyze later.
Compatible with data lakes
Not a solution for data lakes because it only integrates data in a relational data warehouse system.
It offers a pipeline for data lakes to absorb unstructured data.
Compliance Removes sensitive information
before loading it into the DW.
Requires the upload of the data before removing sensitive information. Sensitive
information will be more vulnerable.
Data size vs. complexity of transformations
More appropriate to handle smaller data sets that require complex transformations.
Handles massive amounts of structured and unstructured data – Big Data.
Data warehousing support
Works with cloud-based solutions and DW. It requires a relational or structured data format.
Works with cloud-based DW solutions to support
structured, unstructured, semi-structured, and raw data types.
Hardware requirements Cloud-based ETL platforms do not
require specialized hardware.
ELT processes are cloud-based and do not require specialized hardware.
12
How are aggregations different
If datasets increase in size, aggregation becomes more complicated.
With a cloud-based target data system, it is possible to process massive amounts of data quickly.
Maintenance requirement
Automated, cloud-based ETL solutions, requires little
maintenance. However, an onsite ETL solution that uses a physical server will require frequent maintenance.
Cloud-based and generally incorporates automated solutions, so very little maintenance is required.
Order of the extract, transform, load process
Data transformations happen immediately after extraction within a staging area. After
transformation, the data is loaded into the data warehouse.
Data is extracted, then loaded into the target data system first. Only later is some of the data transformed on an “as-needed” basis for analytical purposes.
Transformation process
Transformations happen within a staging area outside the data warehouse.
Transformations happen inside the data system itself, and no staging area is required.
Unstructured data support
ETL can be used to structure unstructured data, but it cannot be used to pass unstructured data into the target system.
ELT is a solution for uploading unstructured data into a data lake and make unstructured data available to business intelligence systems.
Waiting time to load information
ETL load times are longer than ELT because it is a multi-stage process: (1) data loads into the staging area, (2) transformations take place, (3) data loads into the DW. Once the data is loaded, the analysis of the information is faster than ELT.
Data loading happens faster because there is no waiting for transformations, and the data only loads one time into the target data system. However, the analysis of the information is slower than ETL.
Waiting time to perform transformations
Data transformations take longer initially because every piece of data requires transformation before loading. Also, as the size of the data system increases, transformations take more time. However, once transformed and in the system, analysis happens quickly and efficiently.
Since transformations happen after loading, on an as-needed basis—and one only
transforms the data required for analysis at the time— transformations happen much faster. However, the need to continually transform data
13 slows down the total time it takes for querying/analysis. Table 1 - Differences between ETL and ELT, adapted by (Smallcombe, 2019)
2.4. P
ROBLEMS WITHT
RADITIONALD
ATAW
AREHOUSING ANDB
USINESSI
NTELLIGENCEThe constant increase of data and the need to obtain knowledge instantly increased the capacity for accuracy and efficacy about the organization of information. Databases came to play a critical role in their management (Wannalai & Mekruksavanich, 2019).
The EDW has emerged to represent all the organization’s business data and specific rules, according to the multiple subject business areas – “Single version of truth,” instead of a traditional DW that only represents one single business area (now called Data Marts). The EDW concept is capable of providing all organizational information, aggregated by contexts – “single version of facts,” which can provide all all-time organizational data, by the individual organization users (Linstedt & Olschimke, 2015).
Conventional systems lack efficiency when dealing with large volumes of data and information (Wannalai & Mekruksavanich, 2019), which is reflected in the DW development with the absence of a standardized DW data model (Bojičić et al., 2016).
So, a DW is a critical corporate asset nowadays, given its importance in strategic business decisions, which, besides providing operational system support, can also bestow personalized offers and present upsell promotions (Linstedt & Olschimke, 2015). This aspect can be crucial when organizations deal with their competitors.
With the expansion of the information, companies must have real-time data to facilitate decision-making and to have the capacity to respond more quickly to their customers. So, traditional DWs are neither prepared to handle these volumes of data nor deliver information in real-time (Bouaziz, Nablil, & Gargouri, 2017).
Traditional DWs can give us information from the past, answering questions like “What has
happened?” which is supplied by historical data. However, although these questions remain relevant, Big Data can yield the organization answers for their future. Using advanced analytics, they are capable of discovering powerful insights and trends on the variety of data and transform them into information and knowledge useful for the strategies of the company (McCue, 2007).
Modern DW, using Big Data, can respond to questions such as “What is happening now?” or even “What could happen?” (McCue, 2007), which traditional DWs cannot. Besides, with the new era of Big Data, it is possible to make predictive analyses based on the data, which adds value to the core business of organizations.
Traditional DWs are more oriented only for strategic decisions, containing historical data that is being integrated daily, weekly or monthly, which causes difficulty in performing reporting (this is more restrictive to the existing processes and patterns) and measuring the data (Bouaziz et al., 2017).
14 Besides, much of the data comes from unstructured or semi-structured sources, and a traditional DW cannot categorize and store this type of data. The data is being generated very quickly, subsequently needing a flexible and agile structure that can quickly process it.
Table 2 displays the main differences between traditional and modern DWs:
Characteristics Traditional DW DW nowadays
Purpose The principal purpose is to support the
decision-making process. This is implemented for a specific business area, and the data collected is non-volatile, time-variant, and
integrated.
The primary purpose is to integrate multiple heterogeneous sources (structured, semi-structured,
and unstructured data) to store, manage, and analyze it.
Data Source Transactional and Operational Databases. Different formats, sources, and
standards.
Data size Terabytes Petabytes
Scope Support BI (Business Intelligence) and OLAP
(Online Analytical Processing).
Discover insights from Big Data using data mining techniques.
Architecture Star schema is the most used approach.
Oriented to ETL tools.
No architecture defined, depending on the complexity
of the DW project.
Schema Static Unstructured data,
non-transactional, dynamic schemas
Repositories Often fragmented multiple warehouses Single repository using the
concept of a data lake which is constantly gathering and
adding data
Technology There are several free and licensed applications
and tools in the market.
The technology must support, process, and store Big Data.
Processing scalability
Scales vertically MPP (Massively Parallel Processing) capacity
Storage Relational data stores Distributed file system
End-User Top management and business analysts Data scientists
Table 2 - Main differences between traditional and modern DW, adapted by (McCue, 2007; Santoso & Yulia, 2017)
15 The evolution of Big Data has affirmed the importance of adopting an effective BI to improve
companies’ tactical, strategic management processes, decision-making processes, and increase productivity and efficiency. This set of computing technologies, which is capable of identifying, collecting, storing, and analyzing data with the aim of converting them into actionable and pertinent information, can proffer successful strategic plans to companies. The adoption of an efficacious BI will primarily provide insights leading to the discovery and comprehension of consumer buying trends, which can increase profits through more oriented marketing campaigns (Chugh & Grandhi, 2013).
The constant increase of data brings challenges to traditional decision support systems, which are not sufficient to handle it. So BI tools capable of processing this kind of data captured from multiple sources to be able to analyze them are needed. BI tools can create intelligence for the core business of the organization, converting data into meaningful and useful information (Chugh & Grandhi, 2013).
Table 3 presents the main features that BI is capable of handling:
Categories Key functionalities of BI tools
Data consolidation ▪ Integration of data from both in-house and external sources. ▪ Simplified extraction of data, transformation, and loading through
graphical interfaces.
▪ Elimination of unwanted and unrelated data.
Data quality ▪ Sanitize and prepare data to improve the overall accuracy of decisions.
Reporting ▪ User-defined, as well as standard reports, can be generated to serve employees at different levels.
▪ Personalized reports to cater to different individuals and functional units.
Forecasting and modeling
▪ Support in creating forecasts and making comparisons between historical data and real-time data.
Tracking of real-time data
▪ Monitor current progress with defined objectives through KPIs or expected outcomes.
▪ Prioritize scarce resources.
Data visualization ▪ Interactive reports with visualization to understand relationships easily.
▪ Scorecards to improve communication. Data Analysis ▪ What-if analysis.
▪ Sensitivity analysis. ▪ Goal seeking analysis. ▪ Market basket analysis.
16 Mobility ▪ Portable applications can be installed on mobile devices such as
mobile phones and tablet computers to support executives and sales staff while traveling.
Rapid insights ▪ Drill down features allow users to dig deeper into data.
▪ Through dashboards, it is possible to identify and correct negative trends, monitor the impact of newly made decisions, measure, and improve overall business performance.
Report delivery & shareability
▪ Deliver reports to view in most commonly used office applications such as Microsoft Office (Word, Excel, and so forth).
▪ Email reports in different formats Ready-to-use
applications
▪ Pre-built metadata with defined mappings considering performance & security needs.
▪ Pre-built reports and alerts to support management in real-time. Language support ▪ Multiple language support.
Table 3 - Principal features of BI, adapted by (Chugh & Grandhi, 2013)
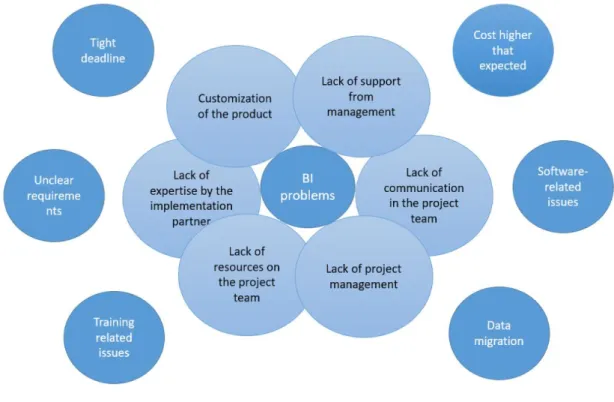
However, BI projects still face some issues when implementing a DW architecture, with some existing factors that can lead to these problems, as presented below:
17 Notwithstanding BI project issues, these programs, processes, and tools allow organizations to have more informed information to make decisions. These determinations are focused on an integrated enterprise data view for the whole company because they do not work with only one unit, so it is essential to maintain the whole perspective (Hultgren, 2012). However, without an appropriate DBWI initiative, the integration of data to extract pertinent insights cannot be possible.
The DWBI framework is confronted with the dynamic changing of the requirements, so the challenge is to be more real-time oriented.
2.5. D
ATAV
AULTE
NSEMBLEM
ODELINGA DW is a fundamental concept in an Enterprise due to the possibility of evaluating its performance over time, facilitating decision-making support (IBM, 2011).
In order to store large amounts of multiple heterogeneous data sources and ensure the historical data, a data model that represents the physical structure of a DW, able to consume the data, reconcile the different sources, and be resilient to changes which may occur is mandatory (Bojičić et al., 2016).
The CWM defines approaches that propose that the data should be organized according to 3NF or in multi-dimensional models; however, they have limitations with respect to the maintenance of the DW. A new approach - Data Vault, has recently emerged to overcome these limitations (Yessad & Labiod, 2017).
When building a DW, one of the things needed is to measure the agility to adapt to changes because an EDW is continually changing, due to new sources and attributes, new requirements and business rules, deliveries, and expansion of subject areas. Thus, it is crucial to think that the database model must be agile for possible future changes and ensure that maintenance costs are not unsustainable (Linstedt & Olschimke, 2015).
The DW needs to be based on central business data, which can easily adapt for future
changes/modifications, integrating multiples sources into one structure and track information history, providing truthful and auditable information.
The Data Vault approach created in the early 2000s by Dan Linstedt (Linstedt & Olschimke, 2015) came to compete with the Inmon and Kimball approaches. Linstedt defines the Data Vault as "a detail-oriented, historical tracking and uniquely linked set of normalized tables that support one or more functional areas of business" (Linstedt & Olschimke, 2015).
A Data Vault is an empirical model, and its modeling approach consists of a form of ensemble modeling, with the fundamental that the things must be broken into parts (Hultgren, 2012). When we refer to the term Ensemble Modeling, we associate it with Unified Decomposition.
The implementation of a DW should be oriented to a subject, and that is on what the Ensemble Modeling concept is based. The goal is either to divide into multiple components because of
18 flexibility, adaptability, agility, and to facilitate the way things are interpreted, differently, or by those that change independently of each other (Hultgren, 2012).
However, although we intend to encapsulate the information, to be grouped by subject, on the other hand, we also intend to integrate all the data into a single view (Hultgren, 2012).
Figure 5 - Data Vault EDW, (Hultgren, 2012
A Data Vault represents the business processes with their ties, through the business keys, which are crucial to the model due to an indication of how the business can access, connect and integrate the systems (Inmon & Linstedt, 2015).
The methodology being studied presents some characteristics, in the way of adapting to changes in the business and organizational processes. One of them is to separate the descriptive attributes to be more flexible and respond to new changes - incremental build (Hultgren, 2012), which allows the possibility of parallel load data, the data is traceable from the data source. It provides the exploitation of data (Yessad, 2016).
The Data Vault approach is ideal for organizations that need to react to constant changes in the business requirements and integrate multiple sources when the business environment is very complex. So, a centralized DW, which takes advantage of the market, is flexible, increments the business, and can extract information for decision-making is needed (Inmon & Linstedt, 2015).
2.5.1. Data Vault Fundamentals
The Data Vault 2.0 approach is based on three components: Hubs, Links, and Satellites, each one with a specific function. Hubs consist of the natural business keys. Links are the natural business relationships, and finally, Satellites cover all the business contexts, descriptive data, and history (Linstedt & Olschimke, 2015).
19 Figure 6 - Data Vault EDW, (Hultgren, 2012)
The identification of three levels is required for the development of the modeling process of a Data Vault. First, the business keys and business concepts, second, the identification and modeling of the existing natural business relationships, and finally, the design of the correct attribute context for the creation of the satellites (Hultgren, 2012).
The principal tasks needed when building a DW with the Data Vault approach are as follows (Hultgren, 2013):
1. Identify Business concepts; 1.1. Establish EWBK for Hubs; 1.2. Model Hubs;
2. Identify Natural Business Relationships; 2.1. Analyze Relationships Units of Work; 2.2. Model Links;
3. Gather context attributes to define keys; 3.1. Establish Criteria and design satellites; 3.2. Model Satellites.
20 Figure 7 - Data Vault EDW, (Hultgren, 2012)
2.5.1.1. Hubs
In operational systems, users access data through business keys, which refer to the business objects. So, the business keys have central importance in identifying the business objects, and it is why the Data Vault model separates them from the rest of the model (Linstedt & Olschimke, 2015).
The business keys are defined to identify, track, and locate information, which must be unique and with very low propensity (Linstedt & Olschimke, 2015).
Hubs are the central pillar of the Data Vault model (Linstedt & Olschimke, 2015), which represents the core business concept or the business objects (Lans, Business, & Analyst, 2015). Hub entities do not contain any descriptive information or even foreign keys, and their cardinality must be 1:1 (Hultgren, 2013). The Hub table is an essential entity in tracking the arrival of a new business key in the DW (Linstedt & Olschimke, 2015) and incorporate business key(s) to refer the business object, which can be a composite key (Cox, 2014).
21 ▪ Surrogate Key: based on the business key, which corresponds to the primary key of the Hub,
to improve the lookup performance within the DW. It is also used as a foreign key, to reference in Link and Satellite entities;
▪ Business key: this attribute is a central element in the Hub and should be a unique index and can be a composed key used by the business object;
▪ Load Date: is generated in the ETL process to load the DW and indicates that the business key initially arrived in the DW. Allows to trace errors and find technical load problems, which can affect data when loaded;
▪ Record Source: describes the master data source or the origin of the source of the business key, allowing traceability of the information.
Figure 8 - Hub table, adapted by (Hultgren, 2018)
Hubs use a “unique list of business keys and provide a soft-integration point of raw data that is not altered from the source system but is supposed to have the same semantic meaning. The business keys in the same hub should have the same semantic granularity” (Linstedt & Olschimke, 2015). However, in some cases, when multiple sources populate the Hub, the business key cannot be unique in the Hub context, so other identification attributes, called metadata, are used (Inmon & Linstedt, 2015). This metadata consists of two attributes, the record source and the load date. The first identifies and tracks the source system, while the second gives the arrival date and time of the business key in the DW (Cox, 2014).
The hash key is another attribute that is used to reference (foreign key) the business object in the Links and Satellites of Data Vault elements, to enhance the performance of DW load and the joins between the business keys in the model (Linstedt & Olschimke, 2015).
The hash key is useful to increase the join speed process and the lookup performance in the Data Vault DW, and it is based on the business key, becoming the primary key of the Hub (Linstedt & Olschimke, 2015).
2.5.1.2. Links
Another element of the Data Vault methodology is the Link entity, which represents the natural business relationships between Hubs (Lans et al., 2015) or sometimes with other Links (Hultgren, 2013).
These entities are responsible for modeling transactions, associations, hierarchies, and redefinitions of business terms (Linstedt & Olschimke, 2015), which connect two or more hubs, through the
22 operational business processes that use business objects in the execution of their tasks (Inmon & Linstedt, 2015).
As Hub entities, Links also have hash keys, in order to substitute the joins needed to reference the Hubs, corresponding a combination of all business keys. Besides, this helps the ETL jobs, when loaded the data from the staging area, to confirm if it is no duplication in the Links entries to represent the same relationship, instead of comparing all the Hub’s business keys with the Links business keys (Linstedt & Olschimke, 2015).
The number of Hubs that connect provides the granularity of the Links; therefore, a new grain is added whenever a new Hub is added to a Link entity. The more Hubs a Link connects, the thinner the granularity (Hultgren, 2012).
They are instrumental to store relationships records from the past, present, and future of the data and is composed by the Hask Key, which corresponds to the primary key of the Link, in order to be identifiable in the DW, ensuring the scalability of the Data Vault model (Linstedt & Olschimke, 2015). The cardinality of the relationship is many-to-many. This characteristic transforms into an associative entity, that allows many being on both sides of the relationship (Linstedt & Olschimke, 2015), with the respective foreign keys of the Hubs (hash keys) and metadata variables (Load Date and Record Source). It does not contain any descriptive information (Hultgren, 2013).
The Link structure, Figure 9, is composed of the following attributes (Linstedt & Olschimke, 2015):
• Link Surrogate key: combines all the business keys of the link to make the identification of
this entity and the performance of the join more accessible;
▪ Load Date: metadata attribute used for technical and informative reasons; ▪ Record Source: metadata attribute to refer the origination of the source; ▪ Hub Surrogate key: Foreign key(s) referenced by the Hub entity.
Figure 9 - Link table, adapted by (Hultgren, 2018)
The use of the many-to-many cardinality provides some advantages, especially given by the flexibility of the Links in the Data Vault model. If the business rules change, it is easy for the developers to respond to these new requirements, by adding new Hubs to existing Hubs, to be connected through the Links entities, without the need of re-engineering all the model (Linstedt & Olschimke, 2015). Links entities are a crucial element in the physical model because they help mitigate business requirements and business rules changes without any impact on the existing data sets (historical) or even on the existing processes (Hultgren, 2012).
23
2.5.1.3. Satellites
The last Data Vault model element missing is the Satellites, which contains attributes of the Hubs (Lans et al., 2015). This entity provides all the context and descriptive information of the business object. It is possible to have many satellites to describe a single business key, but only one Satellite can describe one key, a Hub or Link (Hultgren, 2013).
The Satellites can store a business object, relationship or transaction, (Inmon & Linstedt, 2015) by giving a particular context for Hubs and Links over a period of time (Linstedt & Olschimke, 2015). A Satellite can only depend on one Hub or Satellite entity because a Satellite cannot depend on more than one hub or link (Hultgren, 2012). It is recommended to have at least one Satellite entry for every Hub or Link key; otherwise, an outer join is required, and this should be avoided due to performance and complexity problems (Linstedt & Olschimke, 2015).
One of the functions of the DW is to provide historical data, and, in the Data Vault 2.0 model, the Satellites allow to store every change to the raw data, giving a historical view of the data (Hultgren, 2012).
The Satellite structure, Figure 10, is composed of the following attributes (Linstedt & Olschimke, 2015):
▪ Parent surrogate key: corresponds to the Hubs hash keys and it is part of the primary key together with the load date attribute, providing the context and the date and time of the change;
▪ Load date: indicates the date and the time that a change in the entries of the Satellite occurs, and it also corresponds to the primary key. The date and time described are related to the time of the record that is inserted on the DW. The load date is a metadata attribute.
▪ Record source: hard-coded and applied to maintain traceability of the arriving data set, it should indicate the master data source. This metadata attribute is the key for maintaining auditability of the DW;
▪ Load end date: this attribute indicates the date and time when the satellite entry becomes invalid. Corresponds to the only attribute updatable in a satellite, every time that a new entry load occurs from the source system.
Figure 10 - Satellite table, adapted by (Hultgren, 2018)
A good practice when creating Satellite entities is to split the data among multiple Satellites, so all the descriptive information is not stored into a single Satellite. It is therefore recommended to split
24 the descriptive attributes by source system, which means that each incoming data set is kept in individual Satellites, that are dependent on their parent (Hub or Link), (Linstedt & Olschimke, 2015). The raw data from a denormalized source data set would be distributed in different Satellites to be kept dependent on the appropriate business object, relationship, or transaction. This aspect provides some benefits:
▪ Allows developers to add new sources without changing existing satellites entities; ▪ Removes the need to alter the incoming data to fit in existing structures;
▪ Enables Data Vault model to keep the history of the source system and consequently keep the system auditable;
▪ Maximizes load parallelism (MPP) because there is no competition for the satellite. The data can be inserted into the satellite immediately without taking the arrival of data from other systems into account;
▪ It allows for the integration of real-time data without the need to integrate it with raw data loaded from batches. There are no dependencies across multiple systems that could force the system to have both types of data ready at the same time.
Another good practice is to split the data by rate of change, storing the attributes that are frequently changing in one Satellite and the attributes that change less frequently into another. This procedure is useful to separate these kinds of attributes in order not to consume unnecessary storage in new records (Linstedt & Olschimke, 2015).
2.5.2. Data Vault Architecture
The primary purpose of an EDW is to collect and make available useful information for the business core of the organization, in which the data is aggregated, summarized, and consolidated according to the context of the business (Linstedt & Olschimke, 2015).
Data Vault modeling corresponds to a hybrid approach, where its architecture is composed of three layers (Linstedt & Olschimke, 2015):
▪ Staging Area, which stores all the raw data provided by the source systems; ▪ EDW, which is modeled by the Data Vault 2.0 Ensemble approach;
▪ Information delivery layer that corresponds to the information mart.
The EDW layer incorporates three Vaults. The Metrics Vault that contains the runtime information, the Business Vault that applies business rules according to the business in the raw data, to transform them into relevant information (information mart) and finally, the Operational Vault, which stores data fed from operational systems into the DW, (Hultgren, 2012).
The Raw Data Vault incorporates all unfiltered data from the operational data sources that are afterward loaded into Hubs, Links, and Satellites entities, through the business keys (Hultgren, 2012).
25 The Business Vault corresponds to an extension of a Raw Vault, applying business rules,
denormalizations, calculations, and other query assistance functions to facilitate user access and reporting (Hultgren, 2012).
Figure 11 presents the Data Vault 2.0 architecture, which contains the three layers mentioned previously. So the flow is to integrate the source data provided by the operational systems into the staging area layer. Through the ETL tools, the EDW layer is loaded, and the business requirements and rules of the business organization are applied in the Business Vault. The consolidated data in the Business Vault serves as a source for information mart layers, allowing end-users to explore and perform reporting based on data (Hultgren, 2012).
The Data Vault 2.0 architecture cannot be directly accessed by end-users (Kambayashi, Winiwarter, & Arikana, 2002), so the information mart layer is provided.
The information mart provides subject-oriented information, which can be represented in a star schema form or multidimensional OLAP cubes, to make reporting easy, (Linstedt & Olschimke, 2015). Other examples of information marts are an Error Mart, which consists of a central location for errors in the DW and a Meta Mart that is also a central location but for the metadata. The two types of information marts are not rebuilt from the Raw Data Vault or any operational data source. End-users, like administrators, use these types of marts to analyze errors in the ETL processes when loading the DW and the metadata collected for the DW, to trace the data sources (Linstedt & Olschimke, 2015).