João Pedro Botequim Ferreira
Licenciado em Engenharia InformáticaMobile Image Processing to Support
Educational Geometry Games
Dissertação para obtenção do Grau de Mestre em Engenharia Informática
Orientador : Nuno Manuel Robalo Correia, Prof. Catedrático, Faculdade de Ciências e Tecnologia, Universidade Nova de Lisboa
Júri:
Presidente: Doutor Pedro Manuel Corrêa Calvente Barahona
Arguente: Doutora Maria Teresa Caeiro Chambel
iii
Mobile Image Processing to Support Educational Geometry Games
Copyright cJoão Pedro Botequim Ferreira, Faculdade de Ciências e Tecnologia, Universidade Nova de Lisboa
Acknowledgements
Abstract
The mobile IT era is here, it is still growing and expanding at a steady rate and, most of all, it is entertaining. Mobile devices are used for entertainment, whether social through the so-called social networks, or private through web browsing, video watching or gaming. Youngsters make heavy use of these devices, and even small children show impressive adaptability and skill. However not much attention is directed towards education, especially in the case of young children. Too much time is usually spent in games which only purpose is to keep children entertained, time that could be put to better use such as developing elementary geometric notions.
Taking advantage of this pocket computer scenario, it is proposed an appli-cation geared towards small children in the 6 – 9 age group that allows them to consolidate knowledge regarding geometric shapes, forming a stepping stone that leads to some fundamental mathematical knowledge to be exercised later on. To achieve this goal, the application will detect simple geometric shapes like squares, circles and triangles using the device’s camera. The novelty of this ap-plication will be a core real-time detection system designed and developed from the ground up for mobile devices, taking into account their characteristic limi-tations such as reduced processing power, memory and battery. User feedback was be gathered, aggregated and studied to assess the educational factor of the application.
Keywords: application, prototype, detection, geometric shapes, geometric notins,
Resumo
A era móvel está aqui, está ainda a crescer e a expandir a um ritmo constante e, acima de tudo, é entretedora. Os dispositivos móveis são usados primariamente para entretenimento, seja social através das chamadas redes sociais, ou privado através de navegação na internet, visualização de vídeos ou jogando videojogos. Os mais jovens fazem uso elevado deste dispositivos, e mesmo crianças pequenas demonstram uma adaptabilidade e destreza impressionantes. No entanto, pouca atenção é direcionada para a educação, especialmente no caso de crianças peque-nas. Demasiado tempo é normalmente gasto em jogos fúteis cujo único propósito é manter crianças entretidas, tempo esse do qual poderia ser feito um uso melhor tal como o desenvolvimento de noções geométricas elementares.
Aproveitando este cenário do computador de bolso, é proposta uma aplica-ção direcionada para crianças pequenas na faixa etária dos 6 aos 9 anos que lhes permita consolidar conhecimento sobre formas geométricas, formando uma base que levará a um conhecimento matemático fundamental que será exercitado no futuro. É um videojogo, uma vez que os videojogos são o principal chamariz de atenção para pessoas nesta faixa etária. A ideia é seguir uma aproximação de exemplos no mundo real e fazer com que as crianças resolvam questionários ge-ométricos simples utilizando a câmera do dispositivo, eventualmente levando a noções mais complexas como paralelismo de linhas e simetria de figuras.
xii
Contents
1 Introduction 1
1.1 Motivation . . . 2
1.2 Context . . . 3
1.3 Expected Contributions . . . 3
1.4 Document Structure . . . 4
2 Related Work 5 2.1 Shape Recognition . . . 5
2.1.1 Feature Extraction . . . 6
2.1.2 Matching. . . 12
2.1.3 A Shape Recognition System . . . 15
2.2 Virtual and Augmented Reality in Geometry Education . . . 18
2.2.1 Simple Android Shape Detector . . . 18
2.2.2 Construct3D . . . 21
2.2.3 TinkerLamp . . . 24
2.2.4 Discussion . . . 28
2.3 Exploratory Application . . . 29
3 Mobile-Oriented Library 31 3.1 Library Requirements . . . 31
3.2 Library Structure . . . 32
3.3 Detector . . . 35
3.3.1 Extracting Features . . . 35
3.3.2 Matching Features . . . 36
xiv CONTENTS
4 System Prototype 45
4.1 System Architecture. . . 45
4.1.1 Android . . . 46
4.1.2 Canvas . . . 46
4.1.3 JNI . . . 47
4.2 Interface . . . 48
4.3 Detection Modes . . . 49
4.4 Discussion . . . 53
5 Evaluation 57 5.1 Testing Context . . . 57
5.2 Testbed Setup . . . 58
5.3 Testing . . . 60
5.4 Results . . . 66
5.4.1 Paper Testbed . . . 67
5.4.2 Real Testbed . . . 68
5.4.3 “Paper” vs “Real” . . . 74
5.4.4 Issues . . . 76
5.4.5 Discussion . . . 79
6 User Study 81 6.1 Study Context . . . 81
6.2 Study Description . . . 82
6.3 Observational Analysis . . . 83
6.4 Result Analysis . . . 88
6.4.1 User Results . . . 88
6.4.2 Questionnaire Results . . . 92
6.4.3 Discussion . . . 95
7 Conclusion and Future Work 97 7.1 Conclusion . . . 97
7.2 Future Work . . . 98
A Paper Testbed 105
B User Results 107
List of Figures
2.1 Graphical example of a high intensity variation . . . 7
2.2 An example of Sobel edge detection1 . . . . 7
2.3 An example of Canny edge detection (Canny, 1986) . . . 8
2.4 Comparing the Sobel and Canny operators . . . 9
2.5 The idea behind Harris corner detection . . . 10
2.6 An example of Harris corner detection (Harris and Stephens, 1988) 10 2.7 A Bresenham circle being used in a candidate corner test. The high-lighted squares are the pixels comprising the circle perimeter and the pixel p at the centre is the candidate corner. The dashed arc marks the 12 (3/4of 16) contiguous pixels which have a higher in-tensity comparing topthan the threshold (Rosten and Drummond, 2006) . . . 11
2.8 An example of the definitions (Chen et al., 2010) . . . 13
2.9 Block diagram of the multi-stage system . . . 15
2.10 Conversion of the input image from RGB to HSL color space (Za-karia, Choon, and Suandi, 2012) . . . 16
2.11 Application of Otsu (1979)’s threshold technique (Zakaria, Choon, and Suandi, 2012) . . . 16
2.12 Application of the Sobel operator (Zakaria, Choon, and Suandi, 2012) 17 2.13 Shape detection and segmentation . . . 17
2.14 A white wall sticked with papers of different shapes and colors (Kareva, 2011a) . . . 19
2.15 The Simple Android Shape Detector2 . . . 20
xvi LIST OF FIGURES
2.17 A user working in Construct3D wearing the AR kit while a live (monoscopic) video feed of his current construction is displayed
(Kauf-mann and Schmalstieg, 2002) . . . 22
2.18 The hybrid setup. The yellow ellipse is the hand held prop tracked by the FireWire camera (out of view) and the red ellipse is the VR overlay over the video image . . . 23
2.19 The TinkerLamp system (Bonnard and Verma, 2012) . . . 25
2.20 The “test bench” displaying all the shape’s basic characteristics (Bon-nard and Verma, 2012) . . . 25
2.21 Measuring angles in both clock and anti-clockwise directions (Bon-nard and Verma, 2012) . . . 26
2.22 The space junk satellite cleaning game (Bonnard and Verma, 2012). 28 2.23 The small exploratory application. . . 29
3.1 The library structure . . . 33
3.2 Application of the approxPolyDP() function . . . 38
3.3 Bounding property for circles . . . 41
4.1 System architecture. The mobile-oriented library integrates with the Android Java application through the JNI framework . . . 46
4.2 Multiple Java API calls incurring multiple JNI overheads . . . 48
4.3 Multiple OpenCV calls incurring a single JNI overhead . . . 48
4.4 The prototype interface. The name Doctore refers to the trainers of gladiators in ancient Rome and much like in that era, it sym-bolises the hard learning process and journey towards greatness – obtaining a Masters degree . . . 49
4.5 Mode selection. . . 50
4.6 Triangle detection mode with timer activated . . . 51
4.7 Equilateral triangle detection . . . 52
4.8 Quadrilateral detection (note on the left image how the approxi-mation compensates the defect caused by the pin) . . . 52
4.9 Square detection (note that the object in the left image is the same used in the exploratory application) . . . 53
4.10 Pentagon detection . . . 53
4.11 Hexagon detection . . . 54
4.12 Circle detection . . . 54
4.13 Line detection (comparison angle is set to π 2) . . . 54
LIST OF FIGURES xvii
4.15 Right angle detection . . . 55
4.16 Obtuse angle detection . . . 55
4.17 Symmetry detection (y-axis) . . . 55
5.1 Optimized angle checking for regular geometric shapes . . . 58
5.2 Best case scenario “Paper” testbed . . . 59
5.3 “Real” world scenario testbed . . . 59
5.4 Detection on “Paper” testbed (1) . . . 62
5.5 Detection on “Paper” testbed (2) . . . 63
5.6 Detection on “Real” testbed (1) . . . 64
5.7 Detection on “Real” testbed (2) . . . 65
5.8 Geometric shapes results on “Paper” testbed . . . 67
5.9 Geometric notions results on “Paper” testbed . . . 68
5.10 Symmetry results on “Paper” testbed . . . 68
5.11 Geometric shapes results on “Real” testbed . . . 69
5.12 Geometric notions results on “Real” testbed . . . 69
5.13 Symmetry results on “Real” testbed . . . 70
5.14 Geometric shapes: unsuccessful results . . . 70
5.15 Geometric notions: unsuccessful results . . . 71
5.16 Symmetry: unsuccessful results . . . 71
5.17 Mean frame time (ms) to disregard an uninteresting shape . . . 72
5.18 Mean frame time (ms) to disregard an uninteresting notion . . . 72
5.19 Mean frame time (ms) to disregard an uninteresting symmetry. . . 73
5.20 Moto G @ 720 mean frame time (ms) comparison . . . 74
5.21 Nexus 5 @ 768 mean frame time (ms) comparison . . . 75
5.22 Nexus 5 @ 1080 mean frame time (ms) comparison . . . 75
5.23 Reflective garbage bin . . . 76
5.24 Bin edges comparison . . . 77
5.25 Reflective cube. . . 77
5.26 Cube edges comparison . . . 77
5.27 Transparent glass cup. . . 78
5.28 Glass cup edges comparison . . . 78
6.1 The experiment room . . . 82
6.2 Long range (detection-wise) objects. . . 84
6.3 Creative solutions figured out by fourth year participants . . . 84
xviii LIST OF FIGURES
6.5 Second year’s most answered shape . . . 86
6.6 Answer comparison (for questions in common) between second year and other years . . . 87
6.7 Fourth year performance results . . . 88
6.8 Third year performance results . . . 89
6.9 Second year performance results . . . 89
6.10 Aggregate performance results . . . 90
6.11 Aggregate completion results . . . 91
6.12 Mean time spent detecting per question . . . 91
6.13 Usefulness histogram - 5 is best . . . 93
6.14 Potential as an educational game - 5 is best . . . 93
6.15 Difficulty histogram - 5 is best . . . 94
6.16 Mobile devices the participants use at home, but not necessarily own. Obsolete refers to devices three or more years old . . . 94
A.1 The “Paper” testbed . . . 106
C.1 Age . . . 114
C.2 Gender . . . 114
C.3 Question 1 . . . 115
C.4 Question 2 . . . 115
C.5 Question 3 . . . 116
C.6 Question 4 . . . 116
C.7 Question 5 . . . 117
C.8 Question 6 . . . 117
C.9 Question 7 . . . 118
List of Tables
3.1 Detector functions overview . . . 34
1
Introduction
It was not long ago that mobile devices were introduced to the masses, and the smartphone, tablet andphabletboom is still well underway, showing no signs of
slowing down (Telegraph, 2013). With each iteration these devices become faster, lighter, thinner, last longer and this fosters the need to upgrade to a new device for various reasons. In the case of most families with small children, devices are firstly shared and soon become inherited with the acquisition of newer, more advanced successors. In other cases, it is the young who crave for this technology and usually are better versed than the parents themselves, with infants showing remarkable adaptability, to the point of discarding other types of media as non-functional (News, 2011). Therefore there is a considerable number of children either owning or with easy access to mobile devices and using them for all kinds of activities, mostly related to leisure and entertainment.
1. INTRODUCTION 1.1. Motivation
1.1
Motivation
As previously stated, young children see mobile devices as mobile entertainment and tend to engage on less educational content while using them. Mobile games tend to be the preferred choice and with readily available application distribution platforms such as App Store1 and Google Play2which sport thousands of
low-cost and free mobile games. There is seemingly no end to this content nor reasons to engage on something else, at least while the battery lasts.
Albeit not new, the idea of using games for educational purposes seems to be gathering strength due to the new possibilities mobile devices brought to the realm of interactivity. One area susceptible to children within the 6 – 10 age group is the contact with geometric shapes, which plays an important role in developing recognition skills that are later used not only in mathematical, geo-logical, drawing and other fields, but throughout their lives in day to day activi-ties like driving, even if at a more subconscious level. A good, solid knowledge base is thus fundamental. Since games are the primary attention grabber for this age group, one would expect to encounter a considerable amount of education-oriented games in the aforementioned distribution platforms, and indeed there are some that deal with geometry, however most are preset quizzes with fixed answers that don’t really take advantage of the mobile device’s array of capa-bilities. Also there is the common notion that humans tend to learn better by example, especially if one uses real world examples.
This brings motivation to create a simple yet novel geometry game where an-swers are not preset, but can be many things found in the real world, and further expand the interactive learning area. That said, creating a full-fledged game with a real-time detection system falls beyond the scope of time available for this dis-sertation, moreover when it has to be build from the ground up especially for mobile devices. Thus, only the core detection system will be developed.
1http://www.apple.com/osx/apps/app-store.html
1. INTRODUCTION 1.2. Context
1.2
Context
The present dissertation emerges as a collaboration effort between the startup company Watizeet3, the initial proposer, and CITI 4 (Center for Informatics and
Information Technologies) located in the Department of Informatics of the Fac-ulty of Sciences and Technology of the New Lisbon University. The dominant areas of this work are image processing, multimedia and gaming.
1.3
Expected Contributions
A number of contributions is to be expected from this dissertation, a proof-of-concept Android 5 application prototype capable of detecting simple geometric
shapes and notions such as line parallelism, angles, and symmetry. Further on a study will take place to assess the educational factor of the application.
Mobile-oriented library modules To the author’s knowledge, at the time of this
writing there are no libraries or set of functions that will accomplish what is described above efficiently in the given context. While OpenCV is adequate for this sort of tasks, most detection code written in OpenCV does not take into consideration the generally low processing power of mobile devices. Therefore a library with a new set of mobile-oriented geometry detection modules is another expected contribution.
Android application prototype While the longterm goal is to reach as many users
as possible, as of 2013 Android is the leading mobile platform, dominating over 80% of the market (CNET, 2013), making it the primary development platform. The application will also make use of OpenCV6, a highly
popu-lar open source library of programming functions mainly aimed at real-time computer vision. It is expected that the detection system at the core of this prototype will be integrated in an actual mobile game to be developed by Watizeet.
Assessment on the educational factor In order to assess the educational factor,
a study will be undertaken together with the target audience of the applica-tion and any feedback will be taken into account for further improvements.
3http://watizeet.com/
4http://citi.di.fct.unl.pt/
5http://www.android.com/
1. INTRODUCTION 1.4. Document Structure
1.4
Document Structure
The document is divided into seven chapters: introduction, related work, mobile-oriented library, system prototype, evaluation, user study and finally conclusion and future work.
Introduction Chapter 1 presents an overview of the dissertation regarding its
description, context and expected contributions.
Related Work Chapter 2sums what other work has been done in two main
re-lated areas – Shape Recognition and Virtual and Augmented Reality in Geometry Education.
Mobile-Oriented Library Chapter3 details the requirements, module structure
and functions of the mobile-oriented library.
System Prototype Chapter 4 explains in greater detail the development of the
Android system prototype. It provides insight into the architecture, integra-tion with the mobile-oriented library, user interface and detecintegra-tion modes.
Evaluation Chapter 5 analyses the results obtained from tests done to the
pro-totype integrating the mobile-oriented library on different mobile devices and configurations.
User Study Chapter6reports the results gathered from an experiment conducted
in an elementary school in order to access the educational factor of the ap-plication.
Conclusion and Future Work Chapter 7 critiques and comments on the work
2
Related Work
This chapter presents a study of work done in the areas relevant to the present dis-sertation. It is divided into two main sections, the first (Section2.1) dedicated to shape recognition and the latter (Section2.2) to virtual reality in geometry learn-ing.
2.1
Shape Recognition
Although object and shape recognition has been around for quite some time, it was only recently that it gained a broader research activity (Szeliski, 2011). Machine vision was mostly confined to the industrial segment, applied to con-veyor belt inspecting, metal cutting and other well defined, immutable, mass-producing tasks. With the development of better equipments, particularly all-in-one devices such as smartphall-in-ones and tablets, there was a sudden urge to bring object recognition into the street and use it to, among other things, explore and enhance the dynamic, ever-changing world around us. If a picture is worth a thousand words, a recognized one is possibly worth more.
2. RELATEDWORK 2.1. Shape Recognition
2.1.1
Feature Extraction
Feature extraction is the process of transforming input data into a reduced set of features in order to perform some desired task using this reduced representa-tion as opposed of the full size input. This is broadly used as a starting point for several computer vision and image processing algorithms. To better understand feature extraction, one must begin by understanding what a “feature” is. Indeed a feature can be many things, and while there is no canon definition of what con-stitutes a feature, it can be defined as an “interesting” part of an image (Szeliski, 2011), or as a way to describe some object using reduced (yet sufficiently accurate for the task at hand) notions. For instance, a square can be defined as a group of four vertices separated by equal distances, instead of a full fledged group of four lines intersecting each other and forming 90 degree angles at the endpoints; whereas a circle can be defined by its compactness index instead of a given centre point and a radius. Features are used not only as a starting point but also as main primitives for several algorithms, therefore any given algorithm will often be as good as its feature extractor. This is all the more important in the mobile devices’ realm, where processing power, memory, storage and operational time is limited. Taking these limitations into consideration, a feature extractor must be light, fast and relatively accurate in order to prove viable in such context. Below are presented a number of features and their extraction methods and techniques that fit this criteria.
2.1.1.1 Edges
Edge detection is the process of identifying points in an image where there are abrupt changes in its brightness, also referred to as intensity. The aim is to ob-tain a set of connected curves that represent the boundaries of objects, as well as curves that correspond to discontinuities in surface orientation. The resulting im-age will have filtered out information that is supposedly regarded as less relevant, while preserving the structure of the objects. Therefore any subsequent task of in-terpreting the information contents may be considerably simplified comparing to using the original image. Several edge detection methods have been proposed, such as the Sobel and Canny operators.
Sobel The Sobel operator is based on the fact that the pixels show a high
2. RELATEDWORK 2.1. Shape Recognition
and horizontal directions, mathematically called a gradient and defined as a 2D vector composed of the function’s first derivatives (Equation2.1). Usu-ally a3×3kernel matrix, or pixel window, is used to operate on the pixel
of interest in order to reduce influence of noise. Figure2.2shows the result of an application of the Sobel operator.
f(t)
t
(a) The intensity function f(t) alongside an
edge
f(t)
t
(b) The first derivative of f(t). The
maxi-mum indicates the presence of an edge
Figure 2.1: Graphical example of a high intensity variation
grad(I) =h∂I
∂x, ∂I ∂y
iT
(2.1)
(a) Original image (b) Edges image
Figure 2.2: An example of Sobel edge detection1
2. RELATEDWORK 2.1. Shape Recognition
Canny The Canny operator, developed byCanny (1986), is a widely used
multi-stage edge detector algorithm that strived for good detection, localization and minimal response. Good detection and localization means it would identify as many correct edges as possible in the image, and such edges would be marked as close as possible to the real edge, respectively. Mini-mal response would be the ability to mark any given edge only once while avoiding identifying false edges due to image noise. The are four stages to this algorithm. The first is to smooth out the image using a Gaussian filter, since the edge detection in general is susceptible to noise (Szeliski, 2011). Next, the smoothened image is filtered with a kernel in both horizontal and vertical direction in order to get the respective first derivatives to ultimately obtain the edge gradient, which is always perpendicular to edges, and di-rection for each pixel. Afterwards, a full scan of the image is carried out to remove any extraneous pixels which may not be a part of the edge it-self, resulting in a binary image with “thin” edges. Finally the last stage uses hysteresis thresholding to identify genuine edges among the set of all edges, discarding noise pixels that are sure not to belong to any genuine edge. Figure2.3shows the result of an application of the Canny operator.
(a) Original image (b) Edges image
Figure 2.3: An example of Canny edge detection (Canny, 1986)
2. RELATEDWORK 2.1. Shape Recognition
(a) Original image (b) Sobel image (c) Canny image
Figure 2.4: Comparing the Sobel and Canny operators
2.1.1.2 Corners
While corner detection is pretty self-explanatory, most corner detection meth-ods detect feature points, rather than corners in particular. A feature point, also known as keypoint or interesting point, is a point in an image which is usually well defined and can be consistently detected (Szeliski, 2011). Corners stand out as one such feature point, and can be defined as the intersection of two edges, or as a point for which there are two dominant and different edge directions regard-ing the surroundregard-ing area. They are also plentiful in images containregard-ing man-made objects, which could prove advantageous when detecting simple shapes through their vertices. Some relevant, corner-specific detection methods are introduced next.
Harris The Harris corner detection algorithm (Harris and Stephens, 1988), while
2. RELATEDWORK 2.1. Shape Recognition
detection algorithm.
(a) A single dominant gradient direction in-dicates an edge
(b) Two dominant gradient directions indi-cate a corner
Figure 2.5: The idea behind Harris corner detection
Figure 2.6: An example of Harris corner detection (Harris and Stephens, 1988)
FAST Features from Accelerated Segment Test (FAST) is a high-speed corner
2. RELATEDWORK 2.1. Shape Recognition
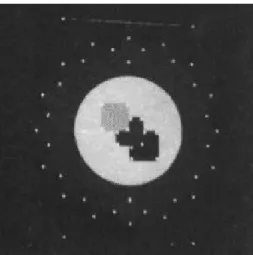
out by examining a circle of pixels, denominated a Bresenham circle, cen-tered on it. Figure2.7exemplifies this notion. Should an arc, composed by
3/4of the circle’s perimeter pixels, be found in which every pixel’s intensity
differs in module by a certain threshold from the centre’s intensity, then a corner is declared. This allows for another speed improvement. Instead of testing the circle pixel by pixel, one can test four pixels evenly separated on the circle,i.e., top, right, bottom and left pixels, it can be shown (Rosten
and Drummond, 2006) that at least three of these pixels’ intensities must all differ from the centre pixel. If it is not the case, then the candidate pixel can be immediately rejected without examining additional perimeter pixels. In practical means, this is very effective since most of the candidate corners will be rejected by this simple comparison test.
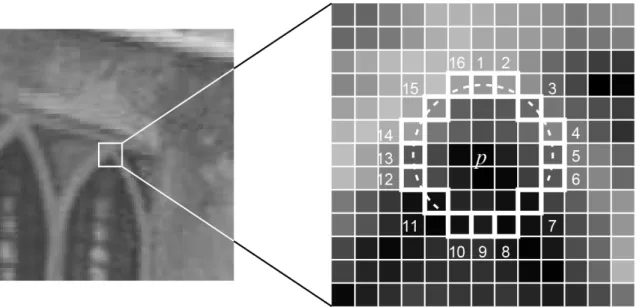
Figure 2.7: A Bresenham circle being used in a candidate corner test. The high-lighted squares are the pixels comprising the circle perimeter and the pixelpat the
centre is the candidate corner. The dashed arc marks the 12 (3/4of 16) contiguous
pixels which have a higher intensity comparing to pthan the threshold (Rosten
and Drummond, 2006)
2. RELATEDWORK 2.1. Shape Recognition
2.1.2
Matching
After extracting the relevant features for a certain task, the next step is to match the features from two or more images in order to identify some image, whether for labeling and storage purposes, or for further downstream processing. There are plenty of ways to match features, with varying degrees of precision, ranging from pure brute force to statistical matching and decision making. However it is clear that several methods are not viable where mobile devices are concerned. In the case of feature extraction (Section 2.1.1), feature matching methods must be computationally efficient while preserving some degree of accuracy.
2.1.2.1 Edge Pixel Point Eigenvalues
This algorithm, developed by Chen et al. (2010), uses the eigenvalue of pixel points located on the edges to quickly recognize polygon apexes, or vertices, and rank order. It is based on the following definitions:
• The distance along the polygon edges of a pixel point P and its eigenvalue
follow-pixel point P’, called the eigenedge-distance of P,dEED.
• The straight-line distance between P and P’, called the eigendistance of P,
dED, is fixed and depends on the size of the recognized figure.
• The eigenvalue of P,vEV, which is given by Equation2.2.
vEV =|x−x′| − |y−y′|
(2.2)
Figure2.8exemplifies the aforementioned definitions. Note that P’sdEED and dED are equal in Figure2.8.
The underlying principle details that, if any two given pixel points P and Q and their respective eigenvalue follow-pixel points P’ and Q’ are situated on the same edge, thevEV of P and Q is equal, if and only if the edge is not a curve. On
the other hand, if a pixel point P and its eigenvalue follow-pixel point P’ are not situated on the same edge, the vEV of P varies continuously in the same search
direction movement, either clock or anti-clockwise. Knowing this, Chen et al. (2010) state that the number of apexes of a polygon are equal to the number of times that thevEV of all pixel points on the polygon edges change from steady to
2. RELATEDWORK 2.1. Shape Recognition
Figure 2.8: An example of the definitions (Chen et al., 2010)
The midpoint between the pixel point R with minimum dED and its eigenvalue
follow-pixel point R’ along the edge is the spot where the ellipse and its semi-major-axis cross. Likewise, a midpoint with maximumdED is where the ellipse
and its semi-minor-axis cross. According toChen et al. (2010), many advantages stand out from this algorithm, with the most relevant for this dissertation being summarized below:
1. For a figure resolution size ofW ∗H, a time and space complexity of O(n)
can be achieved, withn(n << W ∗H)as the number of edge pixel points.
2. A lower time and space complexity than other Hough transform-based recog-nition algorithms, while also having a lower implementation difficulty.
3. No need for shape descriptors or previous template matching.
4. Invariant to scale, translation and rotation.
2. RELATEDWORK 2.1. Shape Recognition
2.1.2.2 Compactness
Another way to recognize simple shapes is through the shape’s own compact-ness (Pomplun, 2013). A shape compactness is nothing more than its perimeter squared divided by its area as shown in Equation2.3.
c= P
2
A (2.3)
This computation is applicable to all geometric shapes, independent of scale and orientation, and its value is dimensionless (Zakaria, Choon, and Suandi, 2012):
• A square of heights has a perimeterP = 4sand an areaA = s2
, therefore its compactnessc= 16s2
s2 = 16.
• A circle of radiusrhas a perimeterP = 2πrand an areaA=πr2, therefore
its compactnessc= 4π2r2
πr2 = 4π.
The more compact a shape is, the lower its compactness value, with no shape being more compact than a circle. Thus 4π is the minimum value for
compact-ness (Pomplun, 2013). This simple calculation is not only considerably fast and efficient computationally, but it is also highly accurate when applied to simple shapes as demonstrated byZakaria, Choon, and Suandi (2012). Thus it is a viable method for shape recognition on mobile devices.
2.1.2.3 Discussion
Overall the two methods are adequate for deployment in a mobile device ap-plication, each with its own reasons. The Edges Pixel Point Eigenvalues (Sec-tion2.1.2.1) method can not only recognize the same shapes as the Compactness (Section2.1.2.2) method, as it can also recognize shapes with different side lengths
i.e., rectangles, non-equilateral triangles, trapezoids, etc., and even non-convex
2. RELATEDWORK 2.1. Shape Recognition
2.1.3
A Shape Recognition System
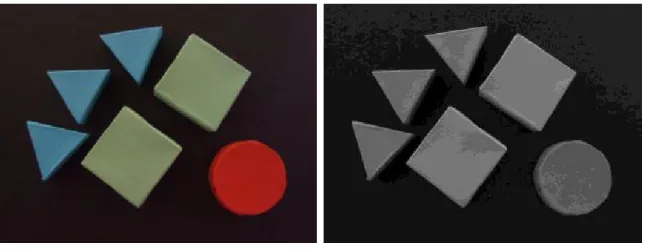
In order to gain a better understanding of how shape recognition is carried out, one must look at a full-fledged shape recognition system (Zakaria, Choon, and Suandi, 2012). It is divided in multiple stages, as depicted in Figure2.9, taking as input an RGB image and going through all the stages to produce an output image with the target shapes segmented.
Preprocessing
Feature Extraction
Feature Matching
Output
Figure 2.9: Block diagram of the multi-stage system
Preprocessing The first stage of the system is where the input image is
prepro-cessed with the aim of helping the work done by later stages which allows them to achieve better results, while also potentially reducing their work-load. In this stage,Zakaria, Choon, and Suandi (2012)start by changing the image’s color space from RGB to HSL in order to work with theL
(Light-ness) channel. By using theLchannel, a good color separation between the
2. RELATEDWORK 2.1. Shape Recognition
applied to help reduce the “salt and pepper” noise and preserve edges. The image is now ready for feature extraction.
(a) Input image (b)Lchannel
Figure 2.10: Conversion of the input image from RGB to HSL color space ( Za-karia, Choon, and Suandi, 2012)
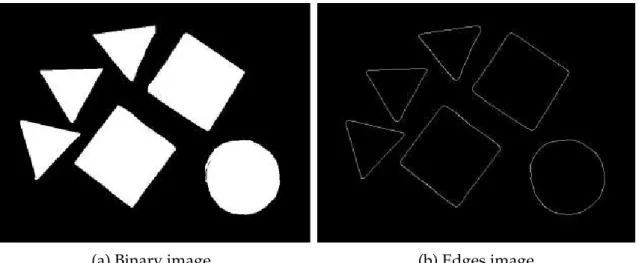
(a)Lchannel (b) Binary image
Figure 2.11: Application of Otsu (1979)’s threshold technique (Zakaria, Choon, and Suandi, 2012)
Feature Extraction Having preprocessed the input image into a more simplified,
2. RELATEDWORK 2.1. Shape Recognition
(a) Binary image (b) Edges image
Figure 2.12: Application of the Sobel operator (Zakaria, Choon, and Suandi, 2012)
Feature Detection In this stage, the method used to match the features is the
Compactness method previously described in Section 2.1.2.2. In this sys-tem,Zakaria, Choon, and Suandi (2012) attempt to match the features ex-tracted with three simple shapes – triangles, squares and circles – one at a time, and use these templates to segment the original image through image subtraction. This yields the results shown on Figure2.13.
(a) Triangle output (b) Square output (c) Circle output
Figure 2.13: Shape detection and segmentation
2. RELATEDWORK 2.2. Virtual and Augmented Reality in Geometry Education
2.2
Virtual and Augmented Reality in Geometry
Ed-ucation
The ultimate goal of geometry education is to improve one’s spatial skills. The idea of using virtual reality (VR) technology to aid in the geometry learning pro-cess is not new, and studies conclude that spatial abilities can also be improved through the use of virtual reality (Osberg, 1997). There are two main trending approaches in educational geometry software: the traditional, desktop-oriented application and the increasingly popular, immersion-oriented augmented reality (AR) environments. The latter, while offering a higher tier of immersion and in-teractivity at the cost of specialized hardware, falls in line with the goals of this dissertation: geometry learning and knowledge consolidation through the use of real world examples in an engaging, exploratory manner. Below is presented an overview of a few relevant systems developed at the time of this writing.
2.2.1
Simple Android Shape Detector
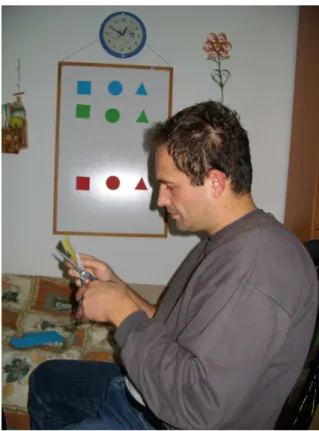
This is the most similar application to the expected contribution of this disser-tation. Developed by Kareva (2011a) as an alternative to the costly interactive walls 2, its aim was to make any white wall interactive by sticking papers with
different shapes and colors on it, as shown in Figure2.14, and then detecting them using any smartphone with a camera, as depicted in Figure 2.15a. It was later extended as a memory game showing the player an array of shapes (triangles, quadrilaterals and circles) that he/she would have to remember and then detect on the sticker wall in the same order. It is worth noting that the detection was car-ried out through a method similar to the Compactness method (Section2.1.2.2), albeit somewhat more empiric and directed to a specific sticker size.
This application was later tested on a local primary school (Figure2.15b), with a total of 75 children in 3 different classes, with 34 having access to a smart-phone (Kareva, 2011b). Since no assessment was made on the educational qual-ity of this application, as it was not designed nor developed for that purpose, it stands that more research must be conducted concerning the use of mobile de-vices for geometry learning. Fortunately, the attention grabbing potential seems to be quite evident since the children promptly adhered to the use of this tech-nology in the classroom, which it could prove a good indicator of a successful integration of mobile devices in the learning process.
2. RELATEDWORK 2.2. Virtual and Augmented Reality in Geometry Education
Figure 2.14: A white wall sticked with papers of different shapes and col-ors (Kareva, 2011a)
3Taken from http://www.youtube.com/watch?v=zwDVMs0P5jw and http://www.
2. RELATEDWORK 2.2. Virtual and Augmented Reality in Geometry Education
(a) Detecting a circle (b) Child using the application
2. RELATEDWORK 2.2. Virtual and Augmented Reality in Geometry Education
2.2.2
Construct3D
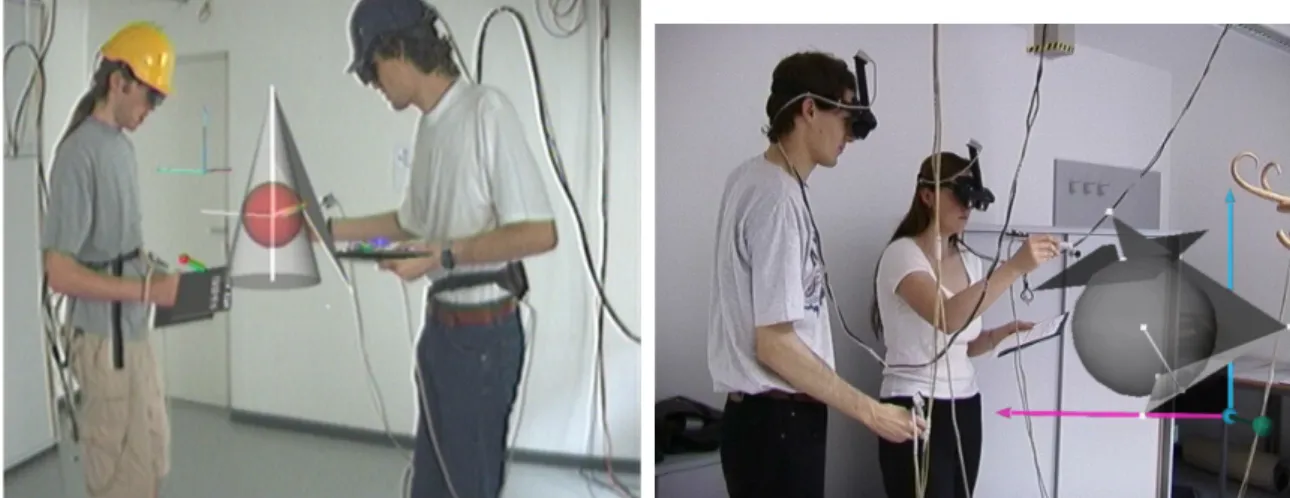
Construct3D (Kaufmann and Schmalstieg, 2002;Kaufmann, 2004;Kaufmann and Dünser, 2007) is a three dimensional geometric construction tool specifically de-signed for mathematics and geometry education which aimed for the improve-ment of spatial abilities. The system makes use of AR to provide a simple, easy to learn environment for face-to-face collaboration between teachers and students. The underlying idea is that by using AR technology in detriment of more tradi-tional methods (pen and paper), allowing students to visualize 3D objects and to work directly in 3D space (Figure2.16), a better and faster understanding of complex spatial problems and spatial relationships can be achieved.
Figure 2.16: Students using Construct3D in a lab setup (Kaufmann and Schmal-stieg, 2002)
To accommodate the myriad of possible interaction scenarios in an educa-tional environment, and acknowledging many of them cannot realistically be ac-complished in schools (even nowadays) with the same expensive lab equipment comprised of tracking systems, Head Mounted Displays (HMD) and stereoscopic video projectors,Kaufmann and Schmalstieg (2002)devised three “hybrid” hard-ware setups:
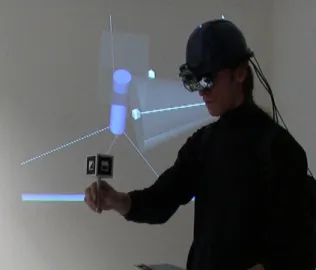
Augmented Classroom Setup This setup consists of two wearable AR kits
2. RELATEDWORK 2.2. Virtual and Augmented Reality in Geometry Education
of a blackboard in class – either the teacher or a single designated student work on the blackboard, while the rest of the students watches or works along on paper. To further mimic this situation, an additional computer and video projector can be used to project a live, albeit monoscopic, video feed of the constructions being worked on by the kit wearers on a projection screen for the rest of the students to watch, as depicted in Figure2.17.
Figure 2.17: A user working in Construct3D wearing the AR kit while a live (monoscopic) video feed of his current construction is displayed (Kaufmann and Schmalstieg, 2002)
Distributed Hybrid Setup In this setup, students are all equipped with a
per-sonal virtual reality (VR) system workstation built using a FireWire camera for optical tracking, an of-the-shelf consumer graphics card and a pair of stereoscopic shutter glasses. Students work with hand held props equipped with markers, which are tracked by the camera, and can choose individual viewpoints or be locked to the teacher’s viewpoint in a guided mode. It is a relatively low price, personalized setup (Figure2.18).
Projection Screen Setup This setup is a less immersive but also less complex and
expensive option. It is simply a large screen projection shared by the class in which is displayed images of the current user’s construction. Although the images displayed are typically stereoscopic, therefore requiring active or passive stereoscopic glasses, there are a number of issues pointed out such as severely distorted images and objects not appearing to be aligned or superimposed with the user’s hands.
2. RELATEDWORK 2.2. Virtual and Augmented Reality in Geometry Education
Figure 2.18: The hybrid setup. The yellow ellipse is the hand held prop tracked by the FireWire camera (out of view) and the red ellipse is the VR overlay over the video image
when the lab setup was used, since it had been primarily designed and developed for that hardware. Another point was how easily the students (high school stu-dents in this case) interacted with the system, and applied their experience with 2D interfaces to the system’s 3D interface (Kaufmann and Schmalstieg, 2002). Most completed the assigned tasks with time to spare and boasted a sense of pride in their constructions, to the point of walking around or admiring them from below. When asked if it felt easier to work with Construct3D for the first time comparing to their first experience with traditional desktop Computer As-sisted Design (CAD) software, most students agreed and mentioned that they could imagine themselves working with Construct3D without any previous CAD experience. It is interesting to note that most students outlined the “playful” way of constructing and exploring which helped them focus on the task at hand, and that the knowledge acquired from the experience is easier to recall.
2. RELATEDWORK 2.2. Virtual and Augmented Reality in Geometry Education
2.2.3
TinkerLamp
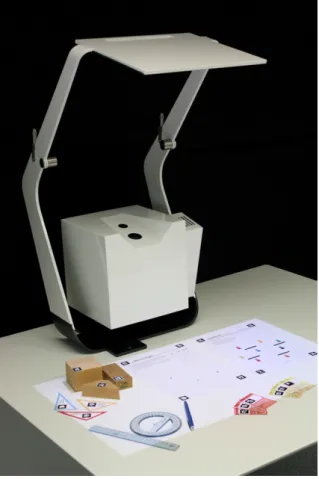
In an effort to seamlessly integrate conventional school tools in computer inter-faces designed to learn geometry and promote group and classroom-level learn-ing,Bonnard and Verma (2012)presented an AR-based tabletop system possess-ing interface elements made of paper. It was designed for young students under the hypothesis that geometry education in primary schools can benefit substan-tially from the use of paper interfaces and inherent characteristics. The reasons for choosing paper lie in its persistent, malleable, adaptive and low cost charac-teristics, strong integration with the classroom environment, and even the fact that many computer interface metaphors such as cut-copy-paste, files and fold-ers, are inspired by practices involving paper.
The system, shown in Figure 2.19, is known as TinkerLamp. It incorporates a camera and a projector directed at the tabletop surface by a mirror, effectively extending the augmented surface area. It sports an embedded computer with minimal interaction (ON and OFF) and relies on the use of fiducial markers to detect, track and bestow meaning to the interface’s paper elements, consisting of papersheetsandcards, while also allowing the possibility of using these very same
elements themselves as additional projection surfaces due to the top-down pro-jection mode. Conventional geometry tools such as ruler and protractor are also a part of the system, completing what is referred to as ascattered interface(Bonnard
and Verma, 2012).
In order to both study the system’s educational impact on primary schools and integrate it accordingly in the conventional classroom curriculum, three ac-tivities where created, each taking into consideration one of the three circles of usability in the classroom – individual, group and classroom. Video material of the following activities can be found inBonnard (2012).
Classifying Quadrilaterals The first activity had the students classify a set of
quadrilateral cardboardshapesinto squares, rhombuses, trapezoids, etc. This
2. RELATEDWORK 2.2. Virtual and Augmented Reality in Geometry Education
Figure 2.19: The TinkerLamp system (Bonnard and Verma, 2012)
the system. Actually, the combination portrayed in Figure2.20was thought up by a group of students who created this “test bench” and just swapped shapes to observe their characteristics simultaneously (Bonnard and Verma, 2012).
2. RELATEDWORK 2.2. Virtual and Augmented Reality in Geometry Education
Discoverying the Protractor The second activity was designed to help the
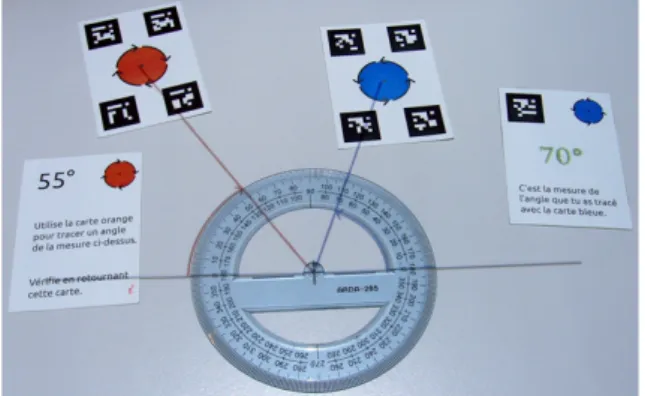
stu-dents learn to use the protractor in an exploratory mindset, after being in-troduced to angles in the classroom. A deck of marked cards is available, containing two kinds of cards: twoangle control cardsand tenangle measure cards. These are further divided into two groups based on the orange or
blue icon printed on them. Orange colored cards indicate that a given angle is to be measured in a clockwise direction while blue colored cards denote
an anti-clockwise measurement. During the collaborative development of the activity with school teachers, this distinction was identified as the main difficulty when learning to use the protractor. Each angle measure card has a different angle value printed on it and falls upon the student to use the same colored angle control card to reproduce the angle in the respective direction. Once the student is confident that the angle is correct, he/she flips the angle measure card to validate the result. Figure2.21 presents an example.
This activity was conducted with over 100 students in the 8 – 10 age group, which were divided into groups and carried out the measurements. After-wards, the students undertook a test on paper where they were asked to identify and write down a series of angle measures next to a printed pro-tractor. Most students had a strong engagement response while using the system to complete the given task and the creativity surfaced once again, with students switching off the feedback for the sake of suspense. However the tests did not yield any significant results due to a ceiling effect (Bonnard and Verma, 2012).
2. RELATEDWORK 2.2. Virtual and Augmented Reality in Geometry Education
Describing Angles Yet another activity with game-like traits, its objective was
to have students use a laser gun to destroy space junk, non-functional satel-lites still orbiting around Earth (Figure 2.22a). The educational goal was to develop the students’ angle describing skills by being able to convey clearly to someone an angle measure, direction of measurement (clock or anti-clockwise) as well as the most convenient axis reference. A group of four students were divided into two cooperating teams, observers and con-trollers, and a physical separation was set between them (see Figure2.22b).
The first were in charge of choosing the next target and were granted a sheet with all the satellites as well as the position of three laser guns along with their respective axis printed on it. Using a protractor, they would pick a suitable laser gun axis and measure the angle to the chosen target satellite and describe it to the controllers who were standing by. The latter were pro-vided three sheets corresponding to the 3 laser guns (seen in the left part of Figure2.22a), and would use an angle control card (similar to the one used in the previous activity) to change the inclination of the desired laser gun in order to reproduce the angle given by the observer team. Once confident that the angle reproduction was accurate, they would open fire by flipping another card representing the laser’s ammunition. Being the ammunition finite, the students would have to exercise caution instead of simply em-ploying trial-and-error strategies.
2. RELATEDWORK 2.2. Virtual and Augmented Reality in Geometry Education
(a) The controllers (left) and observers (right) sheets
(b) The teams physically separated by a bar-rier
Figure 2.22: The space junk satellite cleaning game (Bonnard and Verma, 2012)
2.2.4
Discussion
All the projects above demonstrated to some extent that children are quite re-ceptive to the idea of using VR methods to complement their geometry learning process, and do so in a very engaging manner while exercising their creativity. This in turn promotes their productivity, sense of self-accomplishment and, more importantly, better consolidates their knowledge.
2. RELATEDWORK 2.3. Exploratory Application
2.3
Exploratory Application
An exploratory application was developed with the purpose to assess the per-formance of readily available shape detection algorithms found within OpenCV sample code. It is able to detect squares, rectangles and circles. The developed testbed was a Samsung Galaxy S with a 1GHz single core processor, 512MB of memory and a 5MP camera running Android 4.3 Jelly Bean. Figure 2.23 below shows the application in action.
(a) Square detection (b) Rectangle detection
(c) Quadrilaterals detection (d) Circle detection
Figure 2.23: The small exploratory application
As can be seen in Figure 2.23b, when detecting rectangles the application ended up detecting the camera edges as well. While technically correct, this was not intended. Another thing to note is the use of two adjacent rectangles to form a square in Figure 2.23c. This hints at the possibilities children have to conjure up solutions to answer the game’s questions (i.e., to show a square made of other
shapes).
2. RELATEDWORK 2.3. Exploratory Application
3
Mobile-Oriented Library
In this chapter the transition is made from the techniques and systems studied in Chapter2, along with the small exploratory application results, into the mobile-oriented library requirements and functions. Sections 3.1 and 3.2 allude to the requirements this library strives to meet and its structure. Section3.3details how the Detector module actually performs detection. Finally, Section 3.4 briefly ex-plains the purpose of the Painter module.
3.1
Library Requirements
Given the inefficient results obtained from the OpenCV sample algorithms, past experience with mobile devices and some common sense, three major require-ments were outlined prior to the library development: be lightweight, adjustable and portable.
Lightweight Due to the substantial frame rate drop the first major requirement
3. MOBILE-ORIENTEDLIBRARY 3.2. Library Structure
shapes to be detected, satisfying results can be yielded.
Adjustable Being able to adjust options and parameters is the hallmark of any
proper library. Therefore this library is to provide a few customization op-tions without straying too far for the intended purpose.
Portable Despite being a mobile-oriented library, this does not mean it has to
be mobile-exclusive. The library should be able to be used within multiple environments where OpenCV is available and to perform shape detection on any frame, regardless whether it comes from a video stream or still im-agery. While OpenCV provides a Java interface to it’s functions that inte-grates nicely with Android, this proves very limiting, outright excluding not only desktops but also other mobile platforms such as iOS. Develop-ment in C++ both solves this impedance and offers performance benefits on the Android platform itself. More on this in Chapter4.
3.2
Library Structure
This library is comprised of two independent, yet interoperable, components: the Detector and the Painter. The former is the core component – it is there that all the heavy lifting is done – and the latter is used to display the detection results on the frame, providing different ways to do so. As mentioned previously, it is written in C++, leveraging the functions available in OpenCV. An overview of the library structure can be visualized in Figure3.1and Tables3.1and3.2.
The Detector class, detector.cpp, provides several functions that operate
on a given frame to produce a set of points representing the detected shape. These points can then be passed on to the Painter class,painter.cppin order to draw
3. MOBILE-ORIENTEDLIBRARY 3.2. Library Structure
Detector
- mDetectedPoints - mCircleRadius
+ Detector() + getPoints() + getRadius() + applyCanny() + extractContours() + findTriangle() + findQuadrilateral() + findPentagon() + findHexagon() + findCircle() + findSymmetry() + findLine() + findAngle() - angle()
- euclideanDistance() - isValidContour()
(a) Detector class diagram
Painter
+ drawLine() + drawLines() + drawPolygon() + drawCircle() + drawCircles() + drawRectangle()
(b) Painter class diagram
3. MOBILE-ORIENTEDLIBRARY 3.2. Library Structure
Function Description
getPoints() Returns the points of the last successful detection getRadius() Returns the radius of the last successful circle
de-tection
extractEdges() Finds the edges of a greyscale frame extractContours() Extracts contours of a binary image
findTriangle() Analyses the contours for triangle presence findQuadrilateral() Analyses the contours for quadrilateral
(rectan-gle or square) presence
findPentagon() Analyses the contours for pentagon presence findHexagon() Analyses the contours for hexagon presence findCircle() Analyses the contours for circle presence
findLine() Analyses the contours for
parallel/perpendicu-lar line presence (in respect to the y-axis)
findAngle() Analyses the contours for acute/right/obtuse
angle presence
findSymmetry() Analyses the contours for symmetry presence (in
respect to the y-axis)
angle() Returns the cosine of the angle between three
points
euclideanDistance() Returns the Euclidean distance between two
points
isValidContour() Checks if a contour is valid within the
applica-tion’s context
Table 3.1: Detector functions overview
Function Description
drawLine() Draws a line between two points
drawLines() Draws a line between each set of two points
drawPolygon() Draws a polygon (open or closed) from a set of points drawCircle() Draws a circle with a specified centre and radius drawCircles() Draws several circles with a specified radius at
differ-ent cdiffer-entres
drawRectangle() Draws a rectangle from a Rect object
3. MOBILE-ORIENTEDLIBRARY 3.3. Detector
3.3
Detector
It is worth recalling that a video is composed of a sequence of image frames, which in turn are simply pixel matrices. They have a number of columns and rows, pertaining to the width and height, and can have as many layers as the frame’s channels. Greyscale 8-bit frames have a single layer, while RGBA 32-bit have four layers. Given this notion, it is also reasonable to think of a part or region of a frame as submatrix of the original matrix – a Region of Interest (ROI) (Laganière, 2011). Therefore it is more accurate to state that the Detector operates on matrices, specifically greyscale matrices, abstracted from whether it is the whole frame or simply part of it. However, for the sake of simplicity, the terms frameand ROI will be used instead of matrix and submatrix. The reason
for choosing greyscale is performance and efficiency related: not only is it faster and simpler to work on a single channel, but most times better feature extraction (and by extension better results) can be achieved by using such frames, as per Chapter2.
Next will be discussed what can be currently detected and how the actual de-tection is performed. As can be seen in Figure3.1a, detection can be split into two categories: geometric shapes and geometric notions. The geometric shapes that can be detected are triangles, quadrilaterals (rectangles and squares), pentagons, hexagons and circles, while the geometric notions that can be detected are lines (parallel and perpendicular), angles (acute, right and obtuse) and axis symmetry (horizontal and vertical). Several reasons are behind this detection set. The tech-nological standpoint is the more complex the shape, the more computationally expensive becomes detecting it. The practical standpoint lies with the fact that there aren’t many geometric shapes past hexagon occurring in the real world. One other reason falls on the target audience of this study – children in the 4th grade usually only learn as far as the hexagon. Despite that, the Detector can be easily extended to support more complex geometric shapes.
3.3.1
Extracting Features
3. MOBILE-ORIENTEDLIBRARY 3.3. Detector
3.3.1.1 extractEdges()
This function takes the greyscale frame and outputs a binary frame representing the edges. The edges are extracted by two alternative approaches: an adaptive threshold or the Canny operator. The adaptive threshold employs amean-C
strat-egy (Fisher et al., 2003) to better deal with illumination gradients. It allows an adjustable kernelsize which defaults to 11 and aC constant which defaults to 2.
On the other hand the Canny operator applies hysteresis thresholding with the high threshold being calculated through the method byOtsu (1979)and the low threshold being set to half of that value.
Thigh =Otsu(f rame)
Tlow =Thigh/2 (3.1)
Whichever approach is used, both are preceded by a either a Median or a Gaussian blur (again with a adjustable kernel size, defaulting to 5) in order to
enhance edges. While the Median blur is more adequate at enhancing edges, it also is more computationally intensive than the Gaussian blur, and under certain circumstances both can produce virtually the same result, hence the resolve to add both as an option.
3.3.1.2 extractContours()
After obtaining the binary frame containing the edges, it is time to extract a repre-sentation of any meaningful contours, which could be potential geometric shapes. TheextractContours()achieves this through the use of the OpenCV function findContours(), which takes in the binary frame and outputs a list of
con-tours. This function can be adjusted to deliver all contours with no particular relationships, in an hierarchical fashion distinguishing between outer an inner contours, or only the outermost contours, which is the default mode since it is most suited for geometric shape detection as there isn’t any particular concern regarding holes or concentric shapes.
3.3.2
Matching Features
3. MOBILE-ORIENTEDLIBRARY 3.3. Detector
notions, with each notion going down its own route.
In this common initial pattern all contours are subjected to a validity check, requiring the contour area to make up at least 10% of the frame area, as per Equa-tion 3.2, and be convex – a requirement for basic geometric shapes – or else be immediately discarded.
Areacontour >=Areaf rame∗0.1 (3.2)
Should a contour meet the area requirement, it is then checked for a convex property. In order to do this, it is subjected to another treatment common to all geometric shapes: a contour approximation. The reason for this is twofold. First it is impracticable and inefficient to work with the hundreds, possibly thou-sands of points that comprise a contour, therefore the contour must be abstracted into something that still conveys the same meaning while being substantially easier to work with. Second, not all objects in the real world are perfect depic-tions of geometric shapes. A rectangle could have a small defect on one of it’s sides or rounded corners, yet the human eye can still perceive it as a rectangle. The approximation can overlook such defects and caveats, essentially mimick-ing the human eye to an extent. OpenCV provides a function for that called
approxPolyDP(), which is based on the algorithm by Douglas and Peucker
(1973). It approximates a curve or a polygon with another curve/polygon with less vertices so that the distance between them is less or equal to a specified pre-cision. This precision is what determines the approximation result. Too high and small defects will not be compensated, too low and serious defects will be over-looked. The value being used is based on the contour perimeter, calculated with another OpenCV function called arcLength() with a 2% deviation following
Equation3.3. Using this small deviation allows for a rather rigorous approxima-tion of the original contour while compensating small defects.
P recision=P erimetercontour∗0.02 (3.3)
3. MOBILE-ORIENTEDLIBRARY 3.3. Detector
(a) Contour (b) Approximation
Figure 3.2: Application of the approxPolyDP() function
If the contour in Figure 3.2a was not approximated, it would be discarded as not being convex, while it clearly resembles a rectangle. Approximating the contour results in Figure 3.2b. It has transformed the defect-ridden contour into a rectangle, or more precisely the four points that comprise the approximated rectangle’s vertices.
The first requirement excludes many small, usually noise-related, contours and the second non-convex shapes, which in turn speeds up the detection pro-cess by focusing only on potential geometric shapes. Once both requirements are met, the contour – now turned into an approximation – is deemed valid and added to an array of relevant approximations which will be analysed in order to ultimately decide whether a specific geometric shape can be found in the frame. The functions below detail how this analysis stage is performed for each geomet-ric shape.
3.3.2.1 findTriangle()
Triangles are detected either through their internal angles or relative length of sides. For example, a right triangle has one internal angle measuring 90o and a
3. MOBILE-ORIENTEDLIBRARY 3.3. Detector
Equilateral All internal angles measure close to 60o.
Isosceles Two internal angles have roughly the same measure.
Scalene No two angles are the same measure.
Right One angle measures close to 90o.
Obtuse One angle measures higher than 90o.
If an approximation is found to comply with the case respective to the at-tempted detection, it is marked as a triangle.
3.3.2.2 findQuadrilateral()
Quadrilaterals can also be defined by their internal angles all measuring 90o.
Therefore the procedure is relatively the same: check for four points first and then cycle them in triplets measuring the angles. If all angles are close to 90oall
that is left is checked whether the quadrilateral is a rectangle or a square. This is accomplished by applying the Euclidean distance in order to measure the width and height and then compare them. If equal, the approximation is a square, else it is a rectangle.
3.3.2.3 findPentagon()
Regular pentagons have all internal angles measuring 108o. If the
approxima-tion has five points and all angles measure close to 108o, then the it is marked a
pentagon.
3.3.2.4 findHexagon()
Regular hexagons have all internal angles measuring 120o. Again, if there are six
points and all angles measure close to 120o, then the approximation is marked a
hexagon.
3.3.2.5 findCircle()
3. MOBILE-ORIENTEDLIBRARY 3.3. Detector
geometric shape detection up to hexagon opens the possibility for a substantially faster approach in circle detection. In essence, when approximating a circle with the precision specified previously, the approximation will still contain a large number of points. Taking advantage of this, any approximation with a number of points larger than a certain value is marked as a circle. As it stands, this value is defined as 10 points, to avoid accidental marking of octagons as circles.
This concludes the geometric shape detection functions. A few points must be discussed before moving on to geometric notions. First it is mention throughout the functions the expression “close to Xo” This is again tied to the fact that most
real world objects are not perfect depictions of regular geometric shapes, and can be further distorted when captured through different camera resolutions and subjected to feature extraction. A perceived square can have its internal angles deviating slightly from 90o, say by ±1.5o. Ergo, it is reasonable to relax some
of these properties, and to use acceptance margins. Another point is how the angles are actually measured. The cosine of the angle is the actual measure being calculated, as per Equation3.4.
(dx1∗dx2+dy1∗dy2) p
(dx2
1+dy
2
1) + (dx
2
2+dy
2 2)
(3.4)
Wheredx1anddx2 is thexdistance between the each point to the angle point
anddy1 anddy2 is theydistance. The next point is performance driven. Starting
with quadrilaterals, there is a property that allows for a small speed up: if three angles measure 90o, then the last angle must also measure 90o. Generalizing, for
regular geometric shapes with more than three sides, if n−1 angles are equal,
then angle n must also measure the same. Thus, there is only need to measure n−1angles to verify the existence of a regular geometric withnsides.
3. MOBILE-ORIENTEDLIBRARY 3.3. Detector
skewing and distortion.
Figure 3.3: Bounding property for circles
Lastly it is important to remember that whenever a detection is successful, the approximation points are effectively what is returned to the caller, through mod-ification of the array variablemDetectedPoins. With circles, the array contains
only the centre point and the variablemCircleRadiusis updated with the
cir-cle radius, which are acquired by placing a bounding rectangle (more accurately a square in this case) over the circle and calculating the centre of the square and half its height (Equations3.5and3.6), respectively.
xcentre =xtoplef t+height/2
ycentre =ytoplef t+height/2 (3.5)
radius=height/2 (3.6)
3.3.2.6 findLine()
This function detects lines in a frame which obey a parallel or perpendicular spec-ification. It takes the edges frame as input, an angle and a boolean value dictat-ing whether it should look for a parallel (true) or perpendicular (false) line. The OpenCVHoughLines() function is used to search for lines in steps of π/2, in
respect to the unit circle, essentially limiting the search to horizontal and vertical lines. Searching only for two directions is much less exhaustive and thus faster enough to make the Hough transform viable for real-time detection. All horizon-tal and vertical lines are stored in a array and then iterated over, extracting their angle and marking or discarding the line according to the following conditions:
3. MOBILE-ORIENTEDLIBRARY 3.3. Detector
• Input angle equals line angle and boolean is false – discard
• Input angle differs from line angle and boolean is true – discard
• Input angle differs from line angle and boolean is false – perpendicular
Currently only horizontal and vertical lines are searched for, so this equal-or-different logic is enough to categorize them.
3.3.2.7 findAngle()
The initial pattern of this function is somewhat similar to the geometric shapes’ pattern, albeit with some key differences. First, the validity check requires the contour length to be at least two times the size of the frame width or height, whichever is smaller. Second, the contour approximation does not require the contour to be closed, nor it is checked for a convex property. An approximation failing these requirements is discarded. Another meeting them yet having only two points is also discarded. The rest of the approximations are then analysed in a similar fashion as the geometric shapes, with triplets of points being cycled for angle measurement. However, should the distance between the one outer point and the angle point be smaller than a certain value the triplet is skipped and discarded. This avoids cases where an approximation has enough length to meet the validity check, yet the triplet being currently analysed is exceedingly close together, making it hard to perceive the angle. After measuring the angle using the Equation 3.4 and converting to degrees, the angles are marked as follows, depending, again, on the type of angle being detected in the first place:
Acute Angle is between 15oand 79o.
Right Angle is between 88oand 92o.
Obtuse Angle is between 101oand 165o.
The reason why these values where chosen is that when detecting angles be-low 15o it became less pronounced and visually awkward, although technically
correct. The margin to 90o from either side is to avoid the grey area where an
angle measuring 88odegrees can be perceived as acute by one individual (and it