Duarte Nuno Rodrigues da Silva
Licenciatura em Ciências da Engenharia
Image processing methodology for
assessment of drilling induced damage in
CFRP
Dissertação para obtenção do Grau de Mestre em Engenharia Mecânica
Orientador :
Jorge Joaquim Pamies Teixeira, Prof.
Catedrático, FCT-UNL
Co-orientadora :
Carla Maria Moreira Machado, Prof.
Auxiliar, FCT-UNL
Júri:
Presidente: Prof. Doutora Rosa Maria Mendes Miranda
Arguente: Prof. Doutor Telmo Jorge Gomes dos Santos
Vogais: Prof. Doutor Jorge Joaquim Pamies Teixeira
Image processing methodology for assessment of drilling induced damage in CFRP Duarte Silva
Image processing methodology for assessment of drilling induced damage in CFRP
Copyright cDuarte Nuno Rodrigues da Silva, Faculdade de Ciências e Tecnologia, Uni-versidade Nova de Lisboa
Acknowledgements
It is with immense gratitude that I acknowledge the support and help of my adviser Professor Jorge Pamies Teixeira in achieving another goal in my academic career. Not only this thesis is the result of his scientific curiosity but also because, throughout many years in many different classes, he was able to teach me his ethic values and some of his immensely vast knowledge.
I cannot find words to express my gratitude to my tireless co-adviser Professor Carla Machado, who was closer than anyone in the preparation of this thesis and therefore made an invaluable contribute to this work.
I would like to thank Professor Telmo Santos for the encouragement and support given and to Professor João Lourenço whose help came in a critical time.
A special reference has to be made to Eng. João Gonzalez whose availability, willing-ness to help and advice allowed me to overcome many obstacles.
I am indebted to my friends and colleagues Júlio Balagões, Henrique Costa, Jorge Martins and Vasco Sobral and everyone else at the Industrial Technology Section that one way or another supported me every day and helped me in this journey.
I wish to thank Mr. António Campos and Mr. Paulo Gonçalves for their contribution to this work.
Abstract
Composite material components are produced in a near final shape. Machining op-erations such as drilling are often indispensable, namely for joining of structures. This process introduces damage along the periphery of the hole. Different methods to reduce this induced damage were developed. However, difficulties arise when comparing them since delamination is irregular in shape and in size. The delamination factor and the ad-justed delamination factor quantify the damage but none achieved full acceptance since no international standards have been set. The aim of this work is to develop an image processing methodology associated with digital radiography that is capable of assessing the drilling induced damage in CFRP, being easily reproducible and allowing compari-son of different drilling approaches. The subtraction of pre and post drill radiographies defined the target image to reach. In the image processing the threshold was found to be the most influential variable causing significant changes to the delamination factors. A new approach to the delamination factor is proposed in order to characterize the drilling induced damage. This approach allows the minimization of the quantified damage for the most irregular delamination shapes while equalling the current delamination factors for regular (crown like) damages.
Keywords: Carbon Fibre Reinforced Plastics, Delamination, NDT, X-Radiography,
Resumo
Operações de maquinagem, tal como a furação, introduzem dano em componentes fabricados em materiais compósitos. Estes, apesar de serem produzidos numa forma quase final, exigem frequentemente este tipo de operação. Têm vindo a ser desenvolvi-dos diferentes métodesenvolvi-dos de redução de dano induzido. No entanto, existem dificuldades na comparação dos mesmos pois a delaminação é irregular na forma e no tamanho. O factor de delaminação e o factor de delaminação ajustado quantificam o dano mas ne-nhum alcançou plena aceitação e não existe estandardização internacional para o efeito. O objectivo deste trabalho é desenvolver uma metodologia de processamento de imagem associada a radiografia digital capaz de avaliar o dano de furação em CFRP, facilmente reprodutível e que permita a comparação do dano obtido através de diferentes técnicas de furação. A subtracção de radiografias pré e pós furação definiu a imagem a obter. No processamento de imagem, verificou-se que oThresholdé a variável mais importante causando variações significativas nos factores de delaminação. Neste trabalho é proposto um novo modelo de quantificação do dano causado pela furação. O factor de delamina-ção assim obtido permite minimizar o dano quantificado para as formas mais irregulares de delaminação e iguala os actuais factores de delaminação nas formas regulares.
Contents
1 Introduction 1
1.1 Motivations . . . 1
1.2 Objectives . . . 1
1.3 Structure . . . 2
2 Literature Review 3 2.1 Background . . . 3
2.1.1 Non-Destructive Testing . . . 6
2.2 State of the Art . . . 7
2.2.1 Drilling Composite Materials . . . 7
2.2.2 Delamination Assessment . . . 12
2.2.3 Digital Radiography . . . 14
2.2.4 Image Segmentation . . . 15
2.2.5 Literature Review Conclusion . . . 18
3 Experimental Procedure 19 3.1 Introduction . . . 19
3.2 Materials . . . 20
3.3 Equipment . . . 21
3.4 Experimental Methodology . . . 22
3.4.1 Radiography Stage . . . 22
3.4.2 Image Processing Stage . . . 23
4 Results and Discussion 27 4.1 Threshold Investigation . . . 27
4.2 Delamination Quantification . . . 33
5 Conclusions and Future Work 45 5.1 Conclusions . . . 45 5.2 Future Work . . . 46
Appendix A Test data I
Appendix B Delamination results from the threshold application XI
B.1 Spindle Speed effect on delamination . . . XIII B.2 Feed per tooth effect on delamination . . . XV B.3 Tool diameter effect on delamination . . . XVII B.4 Thickness effect on delamination . . . XVIII
Appendix C Matlab Scripts Examples XIX
List of Figures
2.1 Different types of weaving . . . 4
2.2 Airbus A350XWB airframe composition . . . 5
2.3 Boeing 787 Dreamliner: New and old fuselage construction methods . . . 5
2.4 Boeing 787 Dreamliner: Structural materials distribution . . . 6
2.5 Effect of flank wear on thrust force, cutting force, entry delamination and exit delamination . . . 7
2.6 Schematic of special drill bit geometries . . . 8
2.7 Delamination Mechanisms . . . 9
2.8 Effect of spindle speed and feed rate on the thrust and cutting forces. . . . 11
2.9 Delamination patterns . . . 13
2.10 Integration time vs Exposure time . . . 15
2.11 Unimodal histogram . . . 16
3.1 CFRP samples . . . 21
3.2 Drilling equipment . . . 21
3.3 Tool geometries used on the experimental work . . . 22
3.4 Image subtraction process example. . . 26
4.1 Image subtraction for the twist drill test V01 . . . 27
4.2 Image subtraction for the straight flute drill test V01 . . . 28
4.3 Manually thresholded images for the straight flute drill . . . 28
4.4 Manually thresholded images for the twist drill . . . 29
4.5 Affected Area . . . 30
4.6 Delamination Factor . . . 30
4.7 Adjusted delamination factor . . . 31
4.8 Automatic thresholding methods for the straight flute drill . . . 31
4.9 Automatic thresholding methods for the twist drill . . . 32
4.10 Automatic thresholding algorithms . . . 32
4.12 Low threshold images . . . 34
4.13 Low threshold images . . . 34
4.14 Discarded tests . . . 35
4.15 Delamination factor obtained with the twist drill . . . 35
4.16 Delamination factor obtained with the straight flute drill . . . 36
4.17 Delamination factor obtained with the W-shaped drill . . . 36
4.18 Delamination factor obtained with the twist drill pressed setup . . . 36
4.19 Effect of tool diameter on twist drilled tests. . . 37
4.20 Effect of tool diameter on straight flute drilled tests. . . 37
4.21 Effect of tool diameter on W-shaped drilled tests. . . 37
4.22 Effect of tool diameter on twist drilled pressed tests. . . 37
4.23 Comparison ofFdminwithFdChen for the twist drill . . . 40
4.24 Delamination factors plot comparison for twist drill tests . . . 40
4.25 Adjusted delamination factors plot comparison for twist drill tests . . . . 40
4.26 Comparison ofFdminwithFdChen for the straight flute drill . . . 41
4.27 Delamination factors plot comparison for straight flute drill tests . . . 41
4.28 Adjusted delamination factors plot comparison for straight flute drill tests 41 4.29 Comparison ofFdminwithFdChen for the W-shaped drill . . . 42
4.30 Delamination factors plot comparison for W-shaped drill tests . . . 42
4.31 Adjusted delamination factors plot comparison for W-drill tests . . . 42
4.32 Comparison ofFdminwithFdChen for the twist drill (pressed) . . . 43
4.33 Delamination factors plot comparison for twist drill pressed tests . . . 43 4.34 Adjusted delamination factors plot comparison for twist drill pressed tests 43
List of Tables
2.1 Threshold evaluation according to overall average quality . . . 17
3.1 Comparison of sensitivity to impact damage in CFRP’s between major in-spection methods . . . 20 3.2 Test data summary . . . 22
A.1 Manual threshold application – Twist drill: Delamination factor . . . III A.2 Manual threshold application – Twist drill: Adjusted delamination factor . IV A.3 Manual threshold application – Straight flute drill: Delamination factor . . V A.4 Manual threshold application – Straight flute drill: Adjusted delamination
List of Symbols and Abbreviations
ANOVA Analysis of Variance.
CER Cutting Edge Rounding.
CFRP Carbon Fibre Reinforced Plastics.
CMC Ceramic Matrix Composites.
FRP Fibre Reinforced Plastics.
GFRP Glass Fibre Reinforced Plastics.
HSD High Speed Drilling.
HSS High Speed Steel.
MMC Metal Matrix Composites.
NDT Non-Destructive Testing.
OGMA Oficinas Gerais de Material Aeronáutico.
PMC Polymer Matrix Composites.
1
Introduction
1.1
Motivations
Drilling induced damage causes many composite drilled parts to be rejected in industries where close tolerance is needed and even if the required tolerance is met the part may be structurally compromised due to a reduction of the bearing strength or fatigue resistance. The state of the art shows a number of damage quantification based methods that are currently used by researchers to better understand the effects of both drilling techniques and their variables. All of these methods start with the acquisition of an image of the damage however, their description is not detailed enough to allow reproducibility and be considered as a potential damage comparative unit. Furthermore, the mathematical quantification of the damage is in itself a point of discussion since no standard on what damage quantification method should be used has been set. In addition, no definition on what constitutes an acceptable drilling induced damage as a function of at least the predicted loading or application of the component has been established.
The work presented on this thesis was motivated by the need to compare the compos-ite drilling induced damage between different composcompos-ite drilling techniques and equip-ment to allow the inspection of each method’s and tool’s qualities.
1.2
Objectives
The main objectives of this thesis are:
• Development of an image processing methodology, based on digital radiographic
1. INTRODUCTION 1.3. Structure
Reinforced Plastics (CFRP), easily reproducible and allows the comparison of dif-ferent drilling approaches.
• Re-think the premises of the delamination factor concept.
Complementary objectives are:
• Evaluate the influence of the threshold value on the end results.
• Compare the pre existing damage with post drilling induced damage
1.3
Structure
This thesis comprises 5 chapters: Introduction, Literature Review, Experimental Proce-dure, Results and Discussion and Conclusions and Future Work.
The Introduction focuses on presenting the motivations and the objectives that con-stitute the reasoning behind this study. Afterwards, the Literature Review consists of the essential conceptual knowledge that lays the ground work for the tasks here discussed. The State of the Art section contained in this chapter features the latest contributions in the Non-Destructive Testing (NDT) field that are relevant for this work with special focus on the drilling induced damage and damage assessment topics.
The Experimental Procedure chapter presents the materials used as well as the se-lected equipment and describes the experimental techniques. Both the radiographic pro-cedure and the image processing methodologies are thoroughly depicted in this chapter in order to carefully explain the choices made and emphasize the influence of each step in each procedure such as the image segmentation step.
In chapter 4, the results of the application of the methodologies introduced in chapter 3 are presented and discussed. The variation of the image segmentation is investigated and an analysis is conducted on the delamination quantification leading to a definition of a new approach to the delamination factor.
2
Literature Review
2.1
Background
Composite materials are formed by combining two or more materials that differ in form or composition on a macro scale and have quite different properties, giving the resulting material a unique set of properties. In this mixture at least one of the components acts as a structural reinforcing element and the other(s) as a supporting matrix. Although the constituents or phases work together to improve the properties upon their original states, they do not merge into one another and have to remain identifiable and mechanically separable macroscopically.
Messler [1] categorized composites by their matrix material or phase:
• Polymer Matrix Composites (PMC): organic- or polymer-matrix composites with
either thermosetting or thermoplastic matrices and polymeric, ceramic, glass, or metallic reinforcements;
• Metal Matrix Composites (MMC): metal-matrix composites with polymeric,
ce-ramic, intermetallic, or metallic reinforcements;
• Ceramic Matrix Composites (CMC): ceramic-matrix composites with ceramic, glass, metallic, intermetallic, or polymeric reinforcements;
2. LITERATUREREVIEW 2.1. Background
can reduce the number of small parts in a system by combining several small parts into one larger composite component. The main drawbacks are the production cost, harder NDT when compared to its metal counterparts and complex manufacturing process.
The lowering production costs and the industry’s recognition of their performance capabilities have allowed composite materials to become available to a much wider array of applications such as aerospace, military and automotive industries who found in PMC, the combination of high performance fibres and resin matrices, the perfect choice for a structural component. This composite, often referred to as Fibre Reinforced Plastics (FRP), benefits from high strength and stiffness and provides an opportunity to improve performance when replacing a metallic part through weight reduction.
Prepregs, composite fibres that are pre impregnated with a resin matrix in very pre-cise quantities, are widely used as the starting point to a composite component. They can be shaped as particulate reinforcements, whisker reinforcements, continuous fibre laminated reinforcements or woven composites. A requirement of the prepregs is the appliance of pressure or heat (or both) to consolidate and cure the composite. From here, a variety of processes can be done to meld the fibres with the matrix and achieve the de-sired final shape such as hand lay-up, vacuum bag moulding, autoclave moulding, resin transfer moulding, etc. The choice of the process should account for variables like the size and shape of the component, application, production volume and the materials involved since both quality and costs vary significantly across the processes, with the appeal on out of autoclave techniques due to possible quality improvements and cost reductions.
a) b) c)
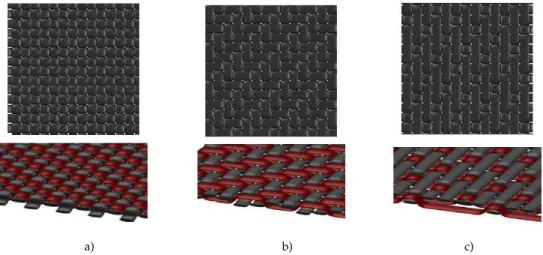
Figure 2.1Different types of weaving: a) Plain weave; b) Twill weave; c) Satin weave. Adapted from [2].
In the aerospace industry, composite materials may account for up to 50% of an air-craft (Figure: 2.2). The continuous pursuit of lower operating costs lead to a carbon fibre reinforced plastic fuselage in the Airbus A350XWB resulting in lower fuel burn, easier maintenance and increased resistance to corrosion [3].
2. LITERATUREREVIEW 2.1. Background
Figure 2.2Airbus A350XWB airframe composition [3]
Figure 2.3Boeing 787 Dreamliner: New and old fuselage construction methods [4]
panelized construction has been replaced by one-piece barrel sections assembly (Figure: 2.3).
Despite replacing metals in many applications, composite materials must be seen as a completely different entity when considering NDT methods. The heterogeneous struc-ture allows multiple defect geometries to occur making the metals’ damage assessment criteria, crack growth, inadmissible for composites because no single failure model can adequately describe the critical point when damage becomes significant.
Tool Wear
Unique wear characteristics result from the anisotropy of FRPs and the low thermal con-ductivity of composite laminates, when compared to that of metals, which leads to a fluc-tuating load acting on the tool’s cutting edge. The hard and abrasive fibres provoke ex-cessive tool wear and frictional heat while a soft and sticky matrix clogs the tool, dulling its edge [6].
2. LITERATUREREVIEW 2.1. Background
Figure 2.4Boeing 787 Dreamliner: Structural materials distribution [5]
tungsten carbide drill bit. They state that the progression in the flank wear is not uniform and can be divided into three distinct wear regions:
1. Initial Wear Region– at the start of drilling in which the new cutting edge has sharp corner radius that carry cutting forces over a small chip contact area resulting in a heavily loaded system as explained by Teti [8] with a high wear rate with the occurrence of chipping and micro-cracking;
2. Steady Wear Region– After cutting edge rounding in theInitial Wear Region the in-crease in contact area between tool and workpiece lowers contact stresses reducing the wear rate;
3. Severe Wear Region– Here the flank wear reaches a second critical value causing a rapid increase in cutting force and temperature due to the thermal softening of both tool and workpiece causing an increase in applied contact pressure becoming again an highly loaded system with high wear rate.
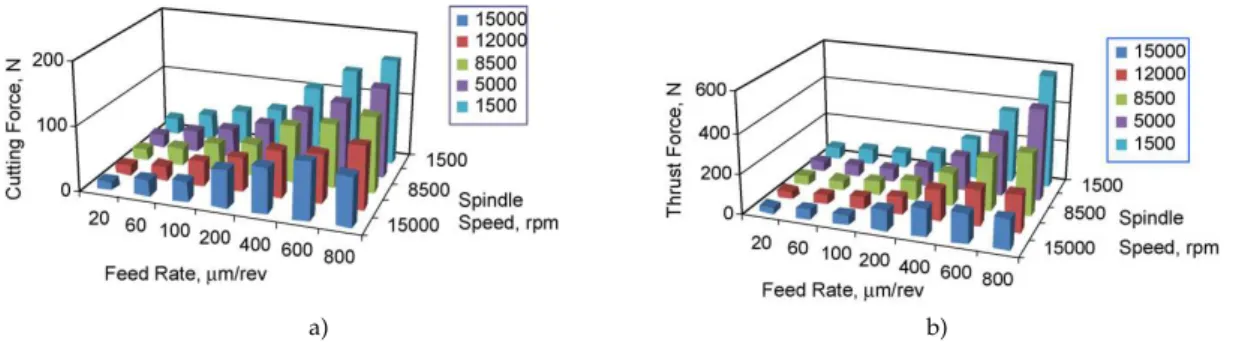
Furthermore, tool wear is both affecting and being affected by the cutting parameters. While cutting forces and temperature control the mechanism and the kinetics of the wear process, the latter in turn alters the tool geometry, deteriorates the cutting capability of the tool and thus ultimately dictates the hole quality of the laminate. Figure 2.5 shows that both thrust force and cutting force increase with the increase in flank wear which in turn leads to an increase in delamination [7].
2.1.1 Non-Destructive Testing
2. LITERATUREREVIEW 2.2. State of the Art
Figure 2.5Effect of flank wear on thrust force, cutting force, entry and exit delamination at spindle speed of15000rpm and feed rate of100µm/rev. After [7]
fibre breaks, microcracks, matrix pores and fibre-matrix detachment. Many of these de-fects or micro structural variations result in changes of the composite properties which can lead to high rejection rates when compared to conventional materials. These prevent the full exploitation of these materials and lead to the development of NDT techniques for the manufacturing quality control where variables such as porosity, fibre/matrix dis-tributions and fibre volume fractions are observed.
When considering on duty composites NDT methods search for damage and degra-dation like impact damage, delaminations, disbonds, heat damage and stress rupture which have the potential for catastrophic failure. Operations such as milling and drilling can cause this type of damage and if so make the component useless.
2.2
State of the Art
2.2.1 Drilling Composite Materials
The mechanism of material removal is another aspect of divergence between metals and composites due to the heterogeneity of the composites structure [8]. Several machining operations can be employed to composite drilling however most literature is dedicated to conventional drilling.
Comprehensive experiments have been conducted with this drilling method provid-ing extensive data on the influence of input variables such as feed rate, spindle speed, drill bit geometry and materials and tool wear, on output variables such as delamination and thrust force.
2. LITERATUREREVIEW 2.2. State of the Art
In the pursuit of better results, experiments on other drilling methods such as Grind-ing DrillGrind-ing [9], Vibration Assisted DrillGrind-ing [10], and High Speed DrillGrind-ing (HSD) have been performed. Although HSD requires specific machinery it somehow became a widely used technology due to the inherent capacity of achieving higher production rates. The main expectation from the application of HSD was reduced delamination through the lessening of thrust forces. A variety of drill geometries (Figure 2.6) and materials has been used in composite drilling with the twist drill in the spotlight. Due to the abrasive nature of the reinforcements the drill bit material dictates tool wear which causes severe degradation in hole quality. Numerous authors support that the drill bit geometry plays an important role in hole quality so many special drill bits have been developed such as straight flute [11], step drill [12], core drills [13] and step-core drills [14]. In general, spe-cial drill bits allow the use of higher feed rates without delamination when comparing to twist drills [15]. Other delamination reduction techniques include the drill of pilot holes [16] and the use of support plates to minimize delamination at hole exit [17].
Figure 2.6Schematic of special drill bit geometries: a) standard twist drill; b) step drill; c) W-shape drill; d) straight flute drill; e) multifaceted drill; f) core drill. After [18]
Drilling Induced Damage
Damage produced while drilling can lead to mechanical failure of a component or assem-bly as well as cause a component to be rejected because of a nonconformity in the hole tolerance. The most common types of damage referred in literature are delamination, microcracks, fibre-matrix debonding, matrix cratering and thermal damage [19]. None of which is as important as delamination, an inter-ply failure phenomenon that reduces assembly tolerances and bearing strength and as the potential for long term deterioration under fatigue load.
2. LITERATUREREVIEW 2.2. State of the Art
a) b)
Figure 2.7Delamination mechanisms: a) Peel up at entrance; b) Push-out at exit. Adapted from [20].
Chen [6] used X-ray non-destructive inspection to investigate the damage zone in unidirectional and multi-directional CFRP laminates. The laminates were drilled with a
5.0mm carbide drill and High Speed Steel (HSS) drill. This method required the hole edge to be coated with Tetrabromoethane to single out x-ray absorption of the damaged areas. To enable the comparison between different cutting conditions, the delamination degree was defined as the ratio between the maximum diameter of the damage zone and the predicted hole diameter (Equation 2.1). Chen’s main conclusions were that the delamination varied linearly with average thrust force for both drills. Additionally, he presented the relation between flank wear and delamination factor with the number of drilled holes showing that this causes an increase of the delamination as a consequence of the increase in thrust force. Also the laminate properties had significant influence on the delamination factor with the multi-directional CFRP achieving better results.
Davim and Reis [21] used a Mitutoyo TM 500 optical microscope with 30x magnifica-tion and1µm together with a statistical study based on the Taguchi method and Analy-sis of Variance (ANOVA) to investigate cutting parameters selection for “Straight Shank” and “Brad & Spur” drills. The “Straight Shank” presents less specific cutting pressure and specific power than the “Brad & Spur” drill. They concluded that the feed rate was the most significant factor on power and specific cutting force for either drill bit. Delam-ination increases with both cutting parameters with feed rate being the most significant factor on entry delamination whereas for exit delamination it is the cutting velocity that has the highest influence.
Avdelidis, Almond, Dobbinson,et al.[22] made use of transient thermal NDT to as-sess aircraft composites. This method accomplished the visualization of notches and simulated delamination in carbon and boron epoxy composites with good agreement between the measured damaged area and the real defective area. The overall quality is dependent on defect depth and size thus restricting its application to near-surface defect imaging.
2. LITERATUREREVIEW 2.2. State of the Art
Hocheng and Tsao [15] compared the effects of five different HSS drill bits, namely twist drill, saw drill, W-shape drill, core drill and step drill, on the onset of delamina-tion. They found that the special geometries can be operated at larger feed rate without delamination damage when compared to the twist drill.
Hamdoun, Guillaumat, and Lataillade [24] researched the fatigue resistance of drilled composites at 60% of compression notched strength. Two sets of drilling parameters were employed producing two types of samples, one “defect free” and another with intention-ally introduced defects. X-ray and optical microscopy analysis were used to observe the damage. The samples were impregnated with Zinc Iodide to enhance contrast. Defect free samples showed a narrow dark band around the hole where the Zinc Iodide did not penetrate due to fibre wrenching during the drilling process. Besides the damage seen in defect free samples, severe drilling conditions caused larger delamination areas which emerged in the x-rays as two different scales of damage, a dark narrow band and a larger lighter area where detachment of the last layers occurred. Longitudinal cracks were the main visible fatigue damage.
Campos Rubio, Abrão, Faria,et al.[25] chose an optical toolmaker’s microscope at 30x magnification and1µm (Mitutoyo TM 500) to evaluate the effect of delamination in HSD of Glass Fibre Reinforced Plastics (GFRP) with three K20 cemented carbide drills: two
5mm diameter twist drills with different point angle and one “Brad & Spur” drill. They found that both increasing spindle speed and decreasing feed rate causes delamination to decrease for spindle speeds up to8000rpm. The Brad & Spur” produced less delam-ination than both twist drills. Feed rate was seen to loose influence on delamdelam-ination for higher spindle speeds (40000rpm). The use of such spindle speeds yields higher material removal rates and minimal delamination.
Rawat and Attia [7] used the machinability maps approach to study the effects of cut-ting conditions on the quality attributes of high speed drilled holes of woven graphite epoxy composites with5mm and118◦ tungsten carbide drills. Delamination was
2. LITERATUREREVIEW 2.2. State of the Art
a) b)
Figure 2.8Effect of spindle speed and feed rate on the thrust and cutting forces: a) Cutting Force; b) Thrust Force. After [26]
easier than conventional flank wear.
Torres Marques, Durão, Magalhães, et al.[28] analysed the selection of cutting pa-rameters and the delamination of CFRP drilled with a four different drill geometries by enhanced radiography with diiodomethane contrasting fluid and image post processing. The processing sequence comprised a manual selection of the interest zone, a noise re-ducing filter, automatic binarization, erosion and dilation morphologic filters for noise reduction and finally a measuring algorithm. A correct selection of cutting parameters was found to have the potential to reduce delamination between 4 and 5%. Moreover, a selection of a dedicated tool further improves the end results, particularly with a pilot hole associated with a twist drill allowing an additional improvement of 2% when com-pared to the second best result. A special step drill bit can be useful to reduce delamina-tion however the tested tool does not yet show a significant advantage when compared to the commercial tools available. The enhanced radiography method was found capable of determining and quantifying the damage caused by drilling.
Shyha, Aspinwall, Soo,et al.[29] applied the Taguchi method with ANOVA to study the influence of process parameters on tool life and workpiece damage when drilling
3mm thick CFRP with TiN-coated and uncoated step and twist drills (φ = 1.5mm). A Joel 6060 Scanning Electron Microscope was used to acquire digital image of the work-piece plates which were afterwards processed in Omnimet software. The measurements were performed with a DEA coordinate measuring machine equipped with a1mm ruby ball stylus and a Renishaw head. Drill geometry and feed rate were the most signifi-cant parameters on measured outputs. Cutting speed and feed rate had the greater effect on torque. The combination of stepped drill geometry, higher feed rates and the use of uncoated tools maximized tool life in terms of number of drilled holes while the worst results were found for the TiN-coated conventional twist drill.
2. LITERATUREREVIEW 2.2. State of the Art
Tsao and Chiu [31] found that using compound core-special drills is more advanta-geous when drilling CFRP, since a reduction of thrust force, delamination, chip clogging occurs with higher chip removal.
Machado [2] characterized the high speed drilling damage in CFRP, with three drill geometries (straight flute, W-shape and twist drills), through the development of em-pirical models that correlate the output response (thrust force, torque and delamination factor) with the process variables (spindle speed, feed rate, drill diameter, workpiece thickness) using a design of experiments together with Response Surface Methodology (RSM) and minimize the occurrence of drilling induced damage. AKodak RVG 5100 as-sociated with aKodak RX 2100unit was used to perform digital radiographic analysis on di-iodomethane immersed samples while image processing resulted from the combina-tion of Photoshop, MatroxandSolidworks software in order to measure the extent of the damage caused by the drilling operation. The input variables that influence most the thrust force and torque responses are the workpiece thickness, the tool diameter and the feed per tooth whereas the spindle speed is the factor which least affects the response. The tool diameter and workpiece thickness are the most significant factors with regard to the delamination factor and adjusted delamination factor responses. Analysis by digital radiography demonstrated to be a good option for measuring the delamination damage despite the compulsory use of a contrast medium.
Durão, Tavares, Albuquerque, et al. [32] drilled a batch of CFRP plates with differ-ent drills and measured the resultant delamination extension from digitally enhanced radiographies, with a contrast agent, using computational techniques of image process-ing. The concept of circularity is combined with the delamination factor in the evaluation of the damage so that the shape of the damaged is taken into account. The results con-firmed that higher feed rates correspond to higher delamination extensions regardless of the criterion used. Circularity was found to decrease with the increase of feed rate.
2.2.2 Delamination Assessment
The drilling damage is often evaluated by the delamination factor (Fd) presented by
Chen, which encloses the damage in a circle concentric with the drill hole. It is defined as:
Fd=
Dmax
D (2.1)
whereFd is the delamination factor,Dmax is the maximum diameter of the damage
2. LITERATUREREVIEW 2.2. State of the Art
Fa=
Adel−Anom
Anom
% (2.2)
whereAdelis the delamination damage area andAnomis the nominal area of the hole.
Davim, Rubio, and Abrão [33] propose a different approach in order to better assess the damage patterns shown in figure 2.9: a digital analysis methodology together with an adjusted delamination factorFda. The first part of equation 2.3 accounts for the size
of the crack, which is Chen’s delamination factor, and the second part accounts for the occupation rate of the maximum diameter of the damage zone whereAdis the damaged
area,Amaxis the area corresponding toDmaxandA0is the area of the nominal hole.
Fda =α
Dmax
D0
+βAmax A0
(2.3)
The parametersαandβ are used as weights withβ being considered as the ratio of the damage area to the area corresponding to the area of the delamination zone minus the nominal hole area andαbeing a complement ofβ:
α= 1−β (2.4)
β = Ad
Amax−A0 (2.5)
Equation 2.3 can be rewritten by substituting equations 2.4 and 2.5 thus obtaining equation 2.6:
Fda =Fd+
Ad
Amax−A0
(Fd2−Fd) (2.6)
Figure 2.9Delamination patterns: a) fine cracks b) uniform damage area. After [33]
2. LITERATUREREVIEW 2.2. State of the Art
equal perimeter) using equation 2.7.
f = 4π A
P2 (2.7)
When the damage pattern resembles a circle, the circularity is near 1 at which it be-comes a perfect circle. As the value approaches 0 the damage pattern bebe-comes an elon-gated polygon.
2.2.3 Digital Radiography
This technique involves the use of penetrating gamma or X-radiation to examine parts and products for imperfections. An X-ray machine or radioactive isotope is used as a source of radiation. Radiation is directed through a part and onto film or other media causing shades to appear, called shadowgraph. The resulting shades show the attenua-tion of the signal while it has passed through the sample [34].
X-rays are attenuated when they interact with energy states of electrons in the atoms in the beam’s path resulting in different shades to appear in the shadowgraph. The denser the material is, and the more material there is, the more the x-rays will be atten-uated while travelling through the sample. Therefore, different shades mean differences in material density, material thickness or both [35].
X-radiography of composites is slightly different because composites are highly trans-parent to x-rays requiring low energy x-rays to be used. Otherwise, if energies that are commonly used when scanning other materials were used, such x-rays would go through the composite sample almost as if there was no sample in place, producing merely sat-urated images. Such defects as delaminations and disbonds are virtually invisible to x-rays because they do not significantly change the composition or total amount of ma-terials through which the x-rays travel. However, it is possible to get delaminations and disbonding visible in x-ray image with radio-opaque absorbent penetrant using chem-ical fluids like diiodomethane, dibromomethane or zinc iodide which serve as contrast agents, causing the damage to become visible in the x-ray image [35].
The method can detect following defect types: • matrix cracking
• cracks
• delaminations
• inclusions
• voids • porosities
Digital radiography differs from conventional radiography by the use of an x-ray digital detector eliminating the need of chemical revelation processes.
2. LITERATUREREVIEW 2.2. State of the Art
image element (pixel), if its contrast is important enough. On the other hand, it is not ob-viously possible to separate two distant objects of less than two pixels. The detectability of a detail is thus connected to two essential notions for the detector: the resolution in contrast and the spatial resolution Berthel, Bonin, Cadilhon,et al.[36].
The advantages of the digital sensors with regard to the traditional film are:
• Significant benefits on consumables, safety and environment (screen, chemical sup-plies), and on maintenance (simpler on a scanner than on a developing machine), • Use of the same sources of radiation, the same metal screens as the radiography
film,
• Wide range of exposure with a linear relation between the luminescence intensity and the received dose,
• Reduction of the exposure time (in certain conditions) and dose debits with regard to the film
• Treatment and filing of the data.
• Real time applications and sharing possibilities.
• A quasi-immediate availability of the image.
Since no chemical revelation is needed, there is no more need to refer the exposure time but rather the integration time. The advantage of digital radiography compared to films is shown in figure 2.10. Note that the integration times used for the digital technique are much smaller in comparison with the exposure times used with traditional films.
Figure 2.10Integration time vs Exposure time. After [37]
2.2.4 Image Segmentation
2. LITERATUREREVIEW 2.2. State of the Art
share a certain property. The simplest method of image segmentation is the threshold method which transforms a gray-scale image into a binary one, depending solely in the selected threshold value, where the object will be assigned one state and the background another.
If we plot the number of pixels which have a specific grey level versus that value we create the histogram of the image Petrou and Petrou [38]. The grey levels of pixels belonging to the object often are substantially different from the grey levels of the pixels belonging to the background. For a medical x-ray this is particularly useful since the resulting image consists of a dark background and a bright object that translate into the histogram plot as two peaks and a valley in between. The best possible threshold will be the lowest valley point since it represents the highest variation between the object and the background. However CFRP x-rays do not have a similar histogram so the threshold selection is much harder. Instead they feature unimodal distributions as that shown on figure 2.11.
0 2 4 6
·104
Number
of
pixels
0 50 100 150 200 250
Figure 2.11Unimodal histogram
Sezgin and Sankur [39] conducted an extensive survey on automated image thresh-olding techniques and quantitative performance evaluation. The authors categorized the thresholding methods according to the information they are exploiting:
1. histogram shape-based methods, where, for example, the peaks, valleys and curva-tures of the smoothed histogram are analysed.
2. clustering-based methods, where the grey-level samples are clustered in two parts as background and foreground (object), or alternately are modelled as a mixture of two Gaussian distributions.
2. LITERATUREREVIEW 2.2. State of the Art
and background regions, the cross-entropy between the original and binarized im-age, etc.
4. object attribute-based methods search a measure of similarity between the grey-level and the binarized images, such as fuzzy shape similarity, edge coincidence, etc.
5. the spatial methods use higher-order probability distribution and/or correlation between pixels.
6. local methods adapt the threshold value on each pixel to the local image character-istics.
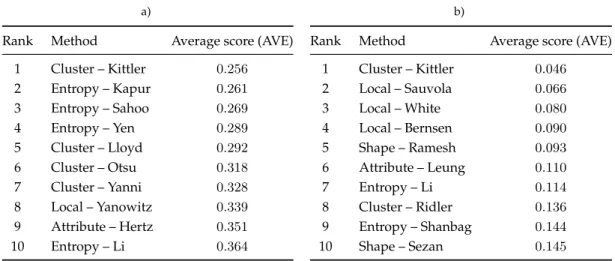
The evaluation followed criteria based the difficulties of each method when facing disproportionate backgrounds and foregrounds and overlapping distributions of grey levels, namely misclassification, edge mismatch, relative foreground area error, modi-fied Hausdorff distance and non-uniform region. The five criteria were then combined into a single factor, the average score, to sort all methods according to their results. Two datasets were organised in groups of 40 images, one built with NDT images and the other with document images. Table 2.1 summarizes the results obtained. The result of each algorithm differs significantly depending on what image type is inputted. For NDT ap-plications, the highest-ranking seven techniques are all from the clustering and entropy category.
Table 2.1Threshold evaluation according to overall average quality. a) Evaluation of 40 NDT images; b) Evaluation of 40 document images. After [39]
a)
Rank Method Average score (AVE) 1 Cluster – Kittler 0
.256
2 Entropy – Kapur 0
.261
3 Entropy – Sahoo 0
.269
4 Entropy – Yen 0
.289
5 Cluster – Lloyd 0
.292
6 Cluster – Otsu 0
.318
7 Cluster – Yanni 0
.328
8 Local – Yanowitz 0
.339
9 Attribute – Hertz 0
.351
10 Entropy – Li 0
.364
b)
Rank Method Average score (AVE) 1 Cluster – Kittler 0
.046
2 Local – Sauvola 0
.066
3 Local – White 0
.080
4 Local – Bernsen 0
.090
5 Shape – Ramesh 0
.093
6 Attribute – Leung 0
.110
7 Entropy – Li 0
.114
8 Cluster – Ridler 0
.136
9 Entropy – Shanbag 0
.144
10 Shape – Sezan 0
.145
2. LITERATUREREVIEW 2.2. State of the Art
2.2.5 Literature Review Conclusion
From the State of the Art it can be concluded that most authors rely on optical methods to analyse the drilling induced damage. However, this is a surface analysing method while the damage varies along the thickness of the workpiece thus questioning the accuracy of the results. Moreover, no author refers thoroughly the image processing settings used to prepare for the measurements.
The observation of the presented image segmentation techniques shows that a num-ber of automatic methodologies have the potential to be implemented in post processing of NDT radiography however manual thresholding should not be completely set aside as it is always coupled with the observers experience and thus an indispensable tool for verification of automatic methods. Furthermore, the image processing data presented in literature seems to be only capable of analysing continuous damage samples with dis-continuous ones being completely disregarded.
In respect to drilling variables, it is clear that they have a significant influence on hole quality with feed rate being the dominant cutting parameter despite losing influence on HSD. This led to the idea that high spindle speeds coupled with high feed rates are ca-pable of minimizing drilling induced damage. Workpiece thickness and diameters larger than6mm do not have enough data available for reference.
3
Experimental Procedure
3.1
Introduction
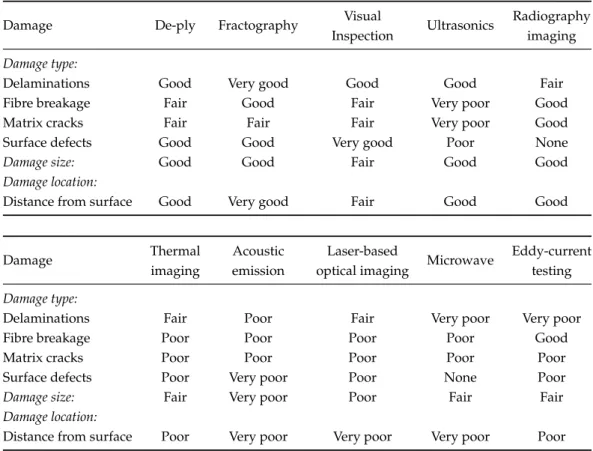
The assessment of drilling induced damage in CFRP is strongly dependent on the meth-ods used for this purpose. Table 3.1 provides a general overview of all available methmeth-ods and focus on each methods’ capacity of identifying different types of damage. In here, ra-diography imaging is seen as a capable technique having qualitative evaluations similar to destructive methods such as de-ply and fractography.
Several researchers [2], [32] successfully made use of this technique to quantify de-lamination and benefited from the conversion to digital radiography which allowed this technique to become an even more proficient tool in detecting damage in CFRP, despite still requing the application of a contrast agent. Afterwords, image processing is em-ployed in order to quantitatively assess the registered damage.
3. EXPERIMENTALPROCEDURE 3.2. Materials
Table 3.1Comparison of sensitivity to impact damage in CFRP’s between major inspection methods. After [41]
Damage De-ply Fractography Visual
Inspection Ultrasonics
Radiography imaging
Damage type:
Delaminations Good Very good Good Good Fair Fibre breakage Fair Good Fair Very poor Good Matrix cracks Fair Fair Fair Very poor Good Surface defects Good Good Very good Poor None
Damage size: Good Good Fair Good Good
Damage location:
Distance from surface Good Very good Fair Good Good
Damage Thermal imaging
Acoustic emission
Laser-based
optical imaging Microwave
Eddy-current testing
Damage type:
Delaminations Fair Poor Fair Very poor Very poor Fibre breakage Poor Poor Poor Poor Good Matrix cracks Poor Poor Poor Poor Poor Surface defects Poor Very poor Poor None Poor
Damage size: Fair Very poor Poor Fair Fair
Damage location:
Distance from surface Poor Very poor Very poor Very poor Poor
3.2
Materials
The CFRP samples shown in figure 3.1, were supplied by OGMA from leftovers of the NH-90 helicopter construction in the shape of plies with 300mm×300mm. The plies were manufactured using an autoclave and consist of 10 prepreg plies of plain weave 3K yarn with a 50% carbon fibre to epoxy content ratio and a thickness of 0.2mm per ply. The plies were then stacked in a [010]sequence, resulting in a final thickness of2mm.
3. EXPERIMENTALPROCEDURE 3.3. Equipment
a) b)
c)
Figure 3.1CFRP samples: a) Plain weave detail; b) Test samples; c) Different thickness sam-ples.
3.3
Equipment
The drilling tests were performed in a LEADWELL VMC-15 vertical machining centre
coupled with a NIKKENBT30-NX5-153 spindle speeder as presented in figure 3.2, which allows a maximum rotation of20000rpm
a) b)
Figure 3.2Drilling equipment: a) CNC machining centre – LEADWELLVMC-15; b) Spindle speeder – NIKKENBT30-NX5-153.
The samples were drilled using the cutting parameters shown in table 3.2. The indi-vidual information of each test can be found in appendix A. Tungsten Carbide K20 drills were used with two diameters, 5mm and 9mm and three different drill geometries, a twist drill with120◦point angle, a straight flute drill and a W-shape drill (recommended
by DORMER). Figure 3.3 presents the tool geometries used used.
3. EXPERIMENTALPROCEDURE 3.4. Experimental Methodology
a) b) c)
Figure 3.3Tool geometries used on the experimental work: a) Twist drill; b) Straight flute drill; c) W-shaped drill.
new clamping fixture that compresses the CFRP sample as presented in [2]. All tests were conducted with new unused drills.
Table 3.2Test data summary. After [2]
Spindle Speed 8000rpm,12000rpm,16000rpm and18000rpm
Feed Rate 0
.3250mm/tooth,0.05500mm/tooth,0.7750mm/tooth and0.08875mm/tooth
Tool Geometry Twist, Straight flute and W-shaped Tool Diameter 5mm and9mm
Workpiece Thickness 4mm and8mm
The new clamping fixture is composed of two aluminium plates with two guide pins and a central concentric hole. The compression is attained through the bolted connection. A specific tightening of the screws provides a certain pressure exerted to the CFRP sam-ple that are placed in between the plates. The central hole diameter is the same diameter as the tool being used to drill the CFRP sample so that the clearance is as small as possible to avoid edge bending and fracturing.
The radiographic analysis was performed using a combination of a KODAK 2100 RX unit and a KODAK RVG 5100 digital radiography system. The RX unit is a high
frequency DC X-ray generator with a tube voltage of 60kV working at 7mA with a
23mm×35mm collimator and a maximum focal distance of 200mm This system fea-tures a spatial resolution of18.5µm and an active sensor area of22mm×30mm and a maximum integration time of620ms.
X-radiography alone does not suffice to evaluate the delamination extension so a con-trast enhancing agent needs to be used. Diiodomethane, a radio-opaque penetrant, was the contrast fluid used in this work.
3.4
Experimental Methodology
3.4.1 Radiography Stage
3. EXPERIMENTALPROCEDURE 3.4. Experimental Methodology
containment after being immersed for at least an hour in diiodomethane.
Radiographies covering the entire sample area were taken prior to the drilling op-eration to allow the comparison of the magnitude of the formation damage on the post drilling radiographies. All images were saved in high resolution tiff format files with
1200pixels×1600pixels.
3.4.2 Image Processing Stage
There are many tools available to conduct image processing tasks. In this section, the procedures associated to an observer based methodology coupled with image process-ing software and an automatic algorithm developed with tools from MATLAB’s Image Processing Toolbox are analysed. The basic principles are shared by both methodologies and consist in:
1. Selecting the Region of Interest (ROI); 2. Differentiating the contents of the ROI; 3. Segmenting its contents;
4. Collecting data for delamination assessment.
The points of divergence lie in the criteria used in each step to make certain deci-sions in the path to the delamination quantization. The observer based methodology, as the name indicates is under control of the user or observer and depends entirely on the experience of the observer. Therefore this methodology can virtually use any image processing software since it is only present as a tool for the observer and the commands required come as standard in most commercial software, like ADOBE PHOTOSHOP, or free software, such as IMAGEJ.
Task 1, the selection of the ROI, is simply the cropping of an adequate area of the orig-inal radiography, that encloses the drilled hole and should encompass the two farthest points in terms of x-ray reception so that the linearization of two different images is close enough to allow a precise comparison between them. This means that the image should have, besides the drilled hole, at least one pixel receiving the full amount of incident radi-ation and another receiving no radiradi-ation whatsoever. If these two points always exist in the images then, for that equipment, accurate comparison can be performed for different images. Having a radiation sensor bigger than the test samples should help in achieving this result. The influence of the size of the cropped area, that contains the ROI, over the threshold result has not been established.
3. EXPERIMENTALPROCEDURE 3.4. Experimental Methodology
leaving just the drilling induced damaged areas.
Image segmentation, task 3, is one of the main topics of this thesis. Many researchers [2], [28], [32], [33] have employed thresholds to process their radiographs but none have addressed this tool as a source of either error or room for improvement despite using dif-ferent image segmentation techniques. Section 2.2.4 presented an overview on the prin-ciples of applying a threshold to an image and the different types of techniques available. From this it can be concluded that the results can vary significantly depending on what technique is employed however, relying on the experience, the observer can supersede this question and manually adjust the threshold value according to the specific image under analysis and its parent radiography without any consideration for the image his-togram. In addition, the histograms of all radiographs taken were always very close to being unimodal which was expected as it is a hallmark of radiographic images.
This choice should bear some thought because by defining individual thresholds per image the assurance that two thresholded images are comparable decreases significantly especially if the selected threshold values differ considerably.
Finally, in task 4 the data needed to quantify the damage is retrieved from the selec-tion previously made in task 2 and evidenced numerically through the segmentaselec-tion in task 3. Choosing the inside of the resulting areas, that now possess the same value due to the threshold operation, allows for the determination of an approximation to the drilling centre. From here the smallest circle that encloses the resulting areas can be drawn. This circle defines the total affected area and its diameter features both in Chen’s delamination factor and Davim’s adjusted delamination factor.
The application of MATLAB’s Image Processing Toolbox is nothing more than the
evolution of the observer’s interpretations with the laying out of some of the criteria dis-cussed above and an attempt to remove the issue of the definition of individual threshold values.
As such, task 1 should be performed in the same manner to build the input for the MATLABscripts. This input is then translated into numerical pixel values according to its intensity in a grey scale. The visual information the observer relied on to identify the region of interest is not something that the algorithm can execute. For this reason, the image segmentation is performed beforehand so that the resulting finite boundaries can be used for the identification of each area.
For comparison with the values obtained through the observer methodology, ten se-quential values between 30 and 120 were picked from the0to255grey scale for the man-ual segmentation to represent the majority of the pixel intensities under analysis. The usage of an algorithm permits the introduction of the automatic segmentation methods referred to in section 2.2.4. Three threshold algorithms were chosen according to their ease of application as well as their performance in evaluating NDT images as shown in table 2.1. Consequently Kittler [42] and Kapur [43], the top two methods, were selected together with Otsu’s method because it is a built in MATLABfunction and also thoroughly
3. EXPERIMENTALPROCEDURE 3.4. Experimental Methodology
The use of automatic segmentation algorithms improves the comparability of the end results since more image data is taken into account. In addition, if the images feature the two farthest points in terms of x-ray reception they will have similar linearizations and hence the algorithms will respond with similar threshold values despite whatever cutting variables are employed. Preliminary tests with the algorithm and the observer method showed that the use of a manually set threshold of constant value had the potential to become a standardized method. However, this constant value is a function of at least the sensor covered area which has an effect on the linearization of the highest and lowest radiation points.
After the segmentation is executed, the regions can be sorted according to their areas. Again, since the formation process damage is smaller than the drilling induced damage, the smaller areas are deleted from the image leaving only the drilling induced damaged areas.
After removing the irrelevant areas, the data collection can begin. Firstly, the drilling centre and drill radius are estimated from the unsegmented image through the applica-tion of a Hough transform. Secondly, a manually adjusted filter is applied to the seg-mented image. This is performed in order to remove all damage that is not considered to be drilling induced. Afterwards, the convex polygon with the least number of sides that circumscribes the segmented image is computed. From the vertices of this polygon the minimum enclosing circle can be determined. Finally, the shape’s external boundary is traced and the distances between the latter and both the drill centre and the minimum enclosing circle centre are calculated.
Image subtraction
In order to have a realistic target for the image processing methodologies based on the threshold application, an image subtraction technique was conducted. Image subtraction is a process that makes use of the digital conversion of an image to perform a subtraction of the pixel values between two different images. This is often used in astrophotography for asteroid detection since static bodies such as stars do not move and consequently the pixels that represent them maintain their intensity values whereas moving bodies do change position and a change in pixel intensity occurs. The subtraction of such images features only the moving pixels in a dark background. Other applications include the detection of flaws and defects in production lines through the comparison of a "Golden Template", an image of a correctly manufactured product.
3. EXPERIMENTALPROCEDURE 3.4. Experimental Methodology
manual registration notches up to5mm long were cut on one side of the specimens. This technique can be implemented in a variety of image processing software just as the observer based methodology for threshold application. The layer registration is obtained through the visual alignment of the notches using the transparent feature of the different layers. After attaining a satisfactory registration the subtraction can be per-formed. Figure 3.4 illustrates the subtraction process. Some software uses another vari-able to correct the brightness of the resulting image calledOffset. In this work anOffsetof -50 was found adequate.
a) b)
c) d)
Figure 3.4Image subtraction process example – Tests V01 and V05 performed with the twist drill.a) Pre drill radiography; b) Post drill radiography; c) Manual image
4
Results and Discussion
A preliminary set of experiments using two drill geometries, straight flute and twist drill, was conducted for the development of the methodologies’ implementation procedure which were compared to the image subtraction results.
These tests featured a variety of cutting parameters as well as two workpiece thick-nesses so that a representative sample of drilling damage could be achieved in order to investigate the influence of the segmentation of the image on the damage assessment.
4.1
Threshold Investigation
For a selection of relevant tests performed with the straight flute and twist drill, the influ-ence of the threshold on the affected area, delamination factor and adjusted delamination factor is presented in the following figures. The corresponding drilling variables can be found in appendices A.1 and A.3 for the twist drill and the straight flute drill, respec-tively.
a) b) c)
4. RESULTS ANDDISCUSSION 4.1. Threshold Investigation
The image subtraction method is shown in figure 4.1 for the twist drill and figures 4.2 for the straight flute drill. In these, damage isolation is almost perfect despite the manual alignment of the pre drill (figures 4.2a and 4.1a) and post drill (figures 4.2b and 4.1b) radiographies.
a) b) c)
Figure 4.2Image subtraction for the straight flute drill test V01: a) Pre Drill; b) Post Drill; c) Image subtraction.
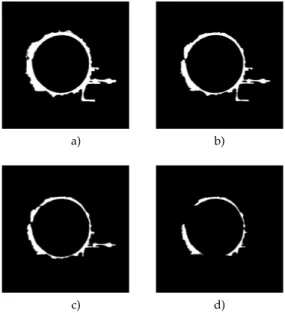
Manual thresholding is illustrated in figures 4.3 and 4.4. The evolution of the affected area with the increase of the threshold value for both drills is visible. A threshold value that is too small will cause formation damage to appear connected to the drilling induced damage. On the other hand, a threshold value too high will neglect some drilling induced damage, leading to the thinning or even disconnecting of some areas.
The penetrability of the contrasting fluid is a factor that is inseparable of the appli-cation of x-radiography to composite materials. The variability of the drilling induced damage in shape, in size and in depth, causes differences in the penetration of the di-iodomethane thus affecting the radiographic process with obvious consequences. This indicates that the threshold value should be a consequence of the properties of the radio-graphy of each drilled hole and not a constant predetermined value.
a) b)
c) d)
4. RESULTS ANDDISCUSSION 4.1. Threshold Investigation
a) b)
c) d)
Figure 4.4Manually thresholded images for the twist drill: a) Threshold = 30; b) Threshold = 60; c) Threshold = 90; d) Threshold = 120.
Comparison with the image subtraction results confirms that the targeted result is contained in the selected threshold interval. The60to90threshold interval seems to be the closest interval that contains all image subtraction results.
Using the output of all manual thresholds, the affected area, the delamination factor and the adjusted delamination factor were determined. The following figures contain a selection of six tests that represent the majority of the findings. The full set of results can be found in appendix A. In figures 4.5 through 4.7, the data appears connected with lines however this is merely indicative and serves no other purpose than to facilitate the comparison between tests.
4. RESULTS ANDDISCUSSION 4.1. Threshold Investigation
30 40 50 60 70 80 90 100 110 120
0 20 40 60 Threshold Level Af fected Ar ea (mm 2) V01 Otsu – 84 V07 Otsu – 77 V21 Otsu – 83 V10 Otsu – 68 V16 Otsu – 70 V24 Otsu – 70
a)
30 40 50 60 70 80 90 100 110 120
0 20 40 60 Threshold Level Af fected Ar ea (mm 2) V01 Otsu – 91 V07 Otsu – 79 V21 Otsu – 88 V10 Otsu – 73 V16 Otsu – 72 V24 Otsu – 76
b)
Figure 4.5Affected Area: a) Straight flute drill; b) Twist drill.
The delamination factor as defined by Chen, shown in figure 4.6, is not influenced as much as the affected area by the increase in the threshold value. To a lower extent the delamination factor displays a similar decay. However a step-like behaviour occurred for some tests with a significant change in both delamination factors. This is a consequence of the thinning of some shapes in one direction in spite of an equiaxed contraction of the shapes’ dimensions. Therefore, in some of the tests, the farthest damaged points from the theoretical drilling centre remain connected to the larger damaged areas as well as almost unchanged in size for a certain range of threshold values.
30 40 50 60 70 80 90 100 110 120
1 1.5 2 2.5 3
Threshold Level
F
d
V01 Otsu – 84 V07 Otsu – 77 V21 Otsu – 83 V10 Otsu – 68 V16 Otsu – 70 V24 Otsu – 70
a)
30 40 50 60 70 80 90 100 110 120
1 1.5 2 2.5 3
Threshold Level
F
d
V01 Otsu – 91 V07 Otsu – 79 V21 Otsu – 88 V10 Otsu – 73 V16 Otsu – 72 V24 Otsu – 76
b)
Figure 4.6Delamination Factor: a) Straight flute drill; b) Twist drill.
The adjusted delamination factor variation with the threshold value is displayed in figure 4.7. In the same manner as the delamination factor a decrease of the adjusted de-lamination factor can be seen with the increase of the threshold value, although it should be noted that the threshold value has a greater impact in the adjusted delamination factor. This result was anticipated because the formulation of the adjusted delamination factor accounts directly for the affected area. The step like behaviour previously referred for the delamination factor is also clear for the adjusted delamination factor.
4. RESULTS ANDDISCUSSION 4.1. Threshold Investigation
30 40 50 60 70 80 90 100 110 120
1 1.5 2 2.5 3 Threshold Level F d a V01 Otsu – 84 V07 Otsu – 77 V21 Otsu – 83 V10 Otsu – 68 V16 Otsu – 70 V24 Otsu – 70
a)
30 40 50 60 70 80 90 100 110 120
1 1.5 2 2.5 3 Threshold Level F d a V01 Otsu – 91 V07 Otsu – 79 V21 Otsu – 88 V10 Otsu – 73 V16 Otsu – 72 V24 Otsu – 76
b)
Figure 4.7Adjusted delamination factor: a) Straight flute drill; b) Twist drill.
delamination factor is because of the diluted effect of the affected area in the formulation of the delamination factor. The affected area is contained in the maximum area (Eq. 4.1) which is represented by the maximum diameter in Chen’s formula (Eq. 2.1). This equa-tion can then be developed into equaequa-tion 4.2 evidencing the presence of the square root of the maximum damaged area unlike the adjusted delamination factor which explicitly features the affected area in its formulation.
Aaf f ected ⊂Amax (4.1)
Fd=
Dmax D0 = 2· r Amax π
D0 (4.2)
The automatic thresholding algorithms vary significantly in quality. The different effects of each thresholding method are displayed in figure 4.8 and 4.9 for the spade drill and the twist drill, respectively.
a) b) c)
4. RESULTS ANDDISCUSSION 4.1. Threshold Investigation
a) b) c)
Figure 4.9Automatic thresholding methods for the twist drill: a) Otsu; b) Kapur; c) Kittler.
While Kapur’s and Otsu’s algorithms yielded similar results to the image subtraction method, Kittler’s algorithm proved inadequate despite achieving the best average score in Sezgin and Sankur’s [39] work. Figure 4.10 clearly marks how much Kittler’s algorithm deviated from an acceptable result.
For the straight flute drill both Kapur and Otsu provided similar threshold values with even similar averages and standard deviations however, with the twist drill Ka-pur’s method increased significantly the standard deviation although the average result remained comparable to Otsu’s algorithm. Consequently Kapur’s suggested thresholds for tests V01, V16 and V21 significantly deviate from the image subtraction results.
Unlike Kapur’s algorithm, Otsu’s method performed well for the entire test range with its output always in the60to90threshold interval as can be seen in figure 4.10. Its results are also plotted as coloured points on figures 4.5, 4.6 and 4.7 for each selected test with the exact threshold value displayed in the graph legend.
V01 V07 V21 V10 V16 V24
0 25 50 75 100 125 150 Test Sample Thr eshold Level Otsu Kapur Kittler a)
V01 V07 V21 V10 V16 V24
0 25 50 75 100 125 150 Test Sample Thr eshold Level Otsu Kapur Kittler b)
4. RESULTS ANDDISCUSSION 4.2. Delamination Quantification
Comparing these results with the application of manual threshold values shows that the automatic algorithm often concurs with a stabilization of the variation of two con-secutive manual threshold values. In figure 4.5, it is clear that the output of the algo-rithm coincided with a reduction in the decay rate of the exponential behaviour of the affected area. In the case where a step occurs, Otsu’s result is immediately before this step (for instance, in tests V01 and V16) thus demonstrating that, for a manual threshold methodology, the threshold choice should fall in an interval where a slight variation of the threshold value does not greatly influence the end results.
4.2
Delamination Quantification
After the investigation on the image processing variables was completed, the test array was increased through the addition of the test sets using the W-shaped drill and the com-bination of the Twist drill and the new clamping fixture. The delamination factor was determined for every test through the application of Otsu’s automatic threshold algo-rithm.
V01 V02 V03 V04 V05 V06 V07 V08 V09 V10 V11 V12 V13 V14 V15 V16 V17 V18 V19 V20 V21 V22 V23 V24 V25 V26 V27 V28 V29 V30 V31 V32
40 60 80 100 120
Test Number
Otsu’s
Thr
eshold
Level
Helical Drill Helical Drill (Pressed) Spade Drill W-shaped Drill
Figure 4.11Threshold analysis
The threshold values obtained are in conformity with those acquired during the pre-liminary tests. The results presented in figure 4.11 show that the60to90threshold range covers the majority of the tests. Nonetheless three tests performed with the twist drill stand out, due to their exceptionally low threshold level with tests V11, V12 and V31 having thresholds below 50.
4. RESULTS ANDDISCUSSION 4.2. Delamination Quantification
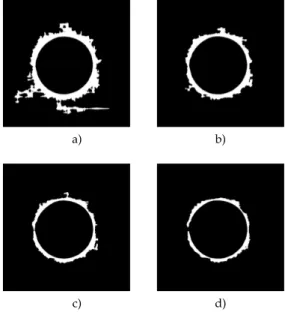
tests where the distance between them is so small that prevents the realization of indi-vidual radiographs. Secondly, a significant variation in the drilling induced damage of both tests, consequence of the different drilling variables, in which the damage of one test surmounts the other. In turn, this leads to a different radiation absorption by the x-ray sensor in these areas. The combination of these two factors results in a considerable difference in the grey scale of the radiographies which induces a considerable difference in the white colour intensity of the two damaged areas as depicted in figures 4.12a, 4.12b and 4.12c.
a) b) c)
Figure 4.12Low threshold images: a) Tests V11 and V15 with the twist drill; b) Tests V27 and V31 with the twist drill; c) Tests V12 and V16 with the twist drill.
In this situation, the application of a constant threshold value would produce an in-correct result. In theory, the constant threshold value would be near the 60to 90range considering the minimum, maximum or average of all the samples taken. Regardless of the amount of this value, it would be significantly higher than the result of Otsu’s algo-rithm and it would seem that an almost perfect hole with practically no trace of damage was performed as figure 4.13 illustrates.
a) b)
Figure 4.13Low threshold images: a) Constant threshold = 75; b) Otsu’s threshold = 35.
Furthermore, twist drill tests V04, V12 and V28 should be discarded due to the drilling induced damage having connected with the notches for the image subtraction as this thwarts the accurate determination of what is the area affected by the drilling process. Additionally, straight flute test V02 should be neglected due to connecting with the dam-age of an experimental test. The discarded tests are displayed in figure 4.14.
![Figure 2.4 Boeing 787 Dreamliner: Structural materials distribution [5]](https://thumb-eu.123doks.com/thumbv2/123dok_br/16563099.737670/28.892.173.684.132.411/figure-boeing-dreamliner-structural-materials-distribution.webp)

![Figure 2.7 Delamination mechanisms: a) Peel up at entrance; b) Push-out at exit. Adapted from [20].](https://thumb-eu.123doks.com/thumbv2/123dok_br/16563099.737670/31.892.166.776.134.324/figure-delamination-mechanisms-peel-entrance-push-exit-adapted.webp)