Repositório ISCTE-IUL
Deposited in Repositório ISCTE-IUL:2019-04-17
Deposited version:
Post-print
Peer-review status of attached file:
Peer-reviewed
Citation for published item:
Bento, N. & Wilson, C. (2016). Measuring the duration of formative phases for energy technologies. Environmental Innovation and Societal Transitions. 21, 95-112
Further information on publisher's website:
10.1016/j.eist.2016.04.004
Publisher's copyright statement:
This is the peer reviewed version of the following article: Bento, N. & Wilson, C. (2016). Measuring the duration of formative phases for energy technologies. Environmental Innovation and Societal Transitions. 21, 95-112, which has been published in final form at
https://dx.doi.org/10.1016/j.eist.2016.04.004. This article may be used for non-commercial purposes in accordance with the Publisher's Terms and Conditions for self-archiving.
Use policy
Creative Commons CC BY 4.0
The full-text may be used and/or reproduced, and given to third parties in any format or medium, without prior permission or charge, for personal research or study, educational, or not-for-profit purposes provided that:
• a full bibliographic reference is made to the original source • a link is made to the metadata record in the Repository • the full-text is not changed in any way
The full-text must not be sold in any format or medium without the formal permission of the copyright holders. Serviços de Informação e Documentação, Instituto Universitário de Lisboa (ISCTE-IUL)
Measuring the duration of formative phases for energy technologies
Nuno Bento a,b, , Charlie Wilson c,da Sustainability Science Program, Kennedy School of Government, Harvard University, Mailbox 117, 79 JFK
street, Cambridge, MA 02138 United States
b DINÂMIA’CET, ISCTE-IUL, Av. das Forças Armadas, Edifício ISCTE, Sala 2N19, 1649-026 Lisboa, Portugal
c Tyndall Centre for Climate Change Research, University of East Anglia, Norwich, Norfolk NR4 7TJ, UK
d Transitions to New Technologies Program, International Institute for Applied Systems Analysis (IIASA),
Schlossplatz 1, A-2361 Laxenburg, Austria
Accepted version: February 18, 2016
Abstract
Innovation processes during the early period of a technology’s development establish the conditions for widespread commercialization. For comparative analysis of innovation processes across technologies, a common operational definition of the formative phase is needed. This paper develops a set of indicators to measure the start and end points of formative phases with reference to key innovation processes including experimentation and market formation. The indicators are then applied to measure the formative phase durations of sixteen energy technologies covering a range of historical periods and applications. Formative phases are found to last 22 years on average. Determinants of formative phase duration are explored. Duration does not appear to be explained by unit scale, up-scaling, nor initial cost. However, technologies that are ready substitutes for incumbents have shorter formative phases, ceteris paribus. Policy implications include the potentials and risks of accelerating formative phases to push low carbon technologies into the market. Keywords: innovation systems; diffusion; formative phase; indicators; energy technologies.
Corresponding author. Telf.: +351 91 641 60 87; fax: +351 21 794 00 42
1. Introduction
Limiting climate change in line with the Paris agreement requires energy system
transformation and the widespread diffusion of low-carbon technologies. Historical energy transitions show the importance of the early years of a technology’s development on subsequent diffusion (Fouquet, 2014, 2008; Smil, 2010). This is often a period of many uncertainties surrounding the formation of a new technology. The formative phase designates the early stage of development that sets up the conditions for a technology to emerge and become established in the market (Wilson and Grubler, 2011).
Two streams of the literature address the challenges faced by a new technology during the formative phase. First, the formative phase has a parallel with the concept of ‘era of ferment’ in the literature on industry lifecycles (Abernathy and Clark 1985; Abernathy and Utterback, 1978; and for a recent review, Peltoniemi, 2011). An era of ferment is a time of intense technical variation and selection, initiated by a technological breakthrough and culminating with the emergence of a dominant design (Anderson and Tushman, 1990). During this period, the number of firms increases while sales remain relatively low as
potential adopters wait for the emergence of a new standard before purchasing. This can be a lengthy process. As an example, 30 product innovations in the US were found to take on average 30 years to move from invention to commercialization, with 14 years more before sales take-off (Agarwal and Bayus, 2002, see also Tellis and Chandrasekaran, 2012; Tellis et al., 2003; Golder and Tellis, 1997). However this literature tends to overlook the systemic conditions (e.g., investment in the production chain, supportive institutions) that often accompany the emergence of new technologies.
Second, formative phases are articulated in the technological innovation systems (TIS) literature, which explains the emergence and growth of an innovation system around a particular technology (Markard et al., 2015; Bergek et al., 2015; Jacobsson and Bergek, 2012; Markard et al., 2012). During the formative phase, constitutive elements of a new innovation system are set up, and essential functions of the emerging innovation system begin
influencing the technology’s development (Bergek, 2008a; Hekkert et al., 2007).
Experimentation and variety as an outcome of knowledge creation are decisive functions in the early years when a technology is surrounded by many uncertainties in terms of design, function and market demand (Kemp et al, 1998; Rosenberg, 1994). Interactions with established technologies and context can further influence the dynamics of growth (Bergek et al., 2015). Later on, resource mobilization and market formation become more influential functions as technology development shifts towards up-scaling and mass commercialization. Although innovation processes during the formative phase have been characterized in depth, the delineation of the formative phase through time remains unclear. It has been only loosely defined as a period lasting rarely less than a decade, and corresponding to a volume of diffusion that is a fraction of the estimated potential (Bergek et al., 2008a; Markard and Hekkert, 2013).
3 This research seeks to understand how long the formative phases of energy technologies last, and how this varies between energy technologies of different type. Specifically, the paper develops an operational definition of formative phase duration drawing on the TIS and industry lifecycle literatures. Indicators of specific innovation processes are proposed to estimate the start and end points of the formative phase consistently for any technology. Application of the indicators is demonstrated on a sample of 16 energy technologies, allowing generic determinants of formative phase duration to be tested empirically. The main purpose of this work is to provide quantitative estimates of formative phase durations of energy technologies observed historically, and to assess the determining factors of those durations. This meta-analytic purpose, together with our use of some ex post measures applicable to full or completed technology lifecycles, means our work can not be used for prospective technology analysis. However, the insights from history that we can draw help inform current efforts to accelerate the commercialization of low carbon
innovations (Winskel and Radcliffe, 2014; Henderson and Newell 2011; Weyant, 2011). This is a novel contribution to the current challenge of climate change mitigation.
The paper is structured as follows. Section 2 reviews the treatment of formative phases in the industry lifecycle and TIS literatures, and identifies relevant innovation processes. Section 3 develops a set of indicators to measure the start and end point of formative phases. Section 4 applies the indicators to a sample of energy technologies and tests potential explanations of the variability in formative phase durations. The paper concludes by discussing implications for energy technology policy in the context of climate change mitigation challenges.
2. Innovation processes during the formative phase
2.1. Industry lifecycles
Measures of progress through innovation stages have been clearly described in the literature on industry lifecycles (Abernathy and Utterback, 1978). A technological opportunity for new products is created from the pressure exerted by technological advances, changes in
customer preferences, or regulation (Abernathy and Clark, 1985). This spurs the entry of many firms introducing different varieties of a product (Klepper, 1996). Increasing entry and rivalry in the early stages of the lifecycle improves the quality of the product, and may also reduce prices, contributing to sales take-off (Agarwal and Bayus, 2002).
The transition to technological maturity is typically characterised by a shift from product to process innovation, the emergence of a dominant design, and a decrease in product variety (Utterback and Abernathy, 1975; Gort and Klepper, 1982; Tushman and Anderson, 1986; Murmann and Frenken, 2006). Reducing uncertainties over technological attributes allows the expansion of production capacity and learning-by-doing economies. As the “era of
ferment” ends, sales grow rapidly from the large number of potential adopters who wait to purchase the dominant design (Anderson and Tushman, 1990).
The decline in product variety and the shift in the nature of innovation activities help explain the exit of a large number of firms (Utterback and Suarez, 1993). Klepper (1997) proposes the notion of “shake-out” for the period of time during which the number of firms decreases as the market grows. This marks the end of the formative phase.
Other indicators of innovation activities during the formative phase focus on sales prior to market growth (Peres et al., 2010). Kohli et al. (1999) find that the “incubation time” of an innovation before market launch relates to subsequent diffusion. Golder and Tellis (1997) estimate the time from introduction to sales take-off of 31 innovations in the US and find significant variation as a function of price and market penetration.
In the specific case of energy technologies, the end of the formative phase is also marked by a transition from experimentation and production of many small scale units to an up-scaling phase which can see rapid increases in the maximum unit sizes of a technology (Wilson, 2012). Up-scaling to capture scale economies is a powerful and constant background condition of technology development, and a common heuristic in innovation systems (Winter, 2008).
2.2. Innovation systems
The role of the formative phase in the emergence of new technologies can also be analysed through the lens of the technological innovation system (TIS). A systemic perspective is well suited to analyse complex and interdependent energy technology innovation (Grubler and Wilson 2014). The TIS literature identifies and elaborates the key innovation processes that take place during the formative phase.
The TIS is a “network of agents interacting in a specific economic/industrial area under a particular institutional infrastructure or set of infrastructures and involved in the generation, diffusion, and utilization of technology” (Carlsson and Stankiewicz, 1991: 111). According to this definition, the three main elements of a TIS are actors, networks and institutions (Bergek et al., 2008a; Jacobsson and Bergek, 2004). Actors include firms and other
organizations (e.g. universities, industry associations) along the value chain (Bergek et al., 2008a). Networks link disparate actors to perform a particular task (e.g. knowledge share, lobby). Institutions consist of formal rules (e.g., laws and property rights) and informal norms (e.g. tradition and culture) that structure political, economic and social interactions.
The emergence of a new TIS has been typically analysed in terms of the development of its key structural elements including (Jacobsson, 2008): entry of firms and other organizations; formation of networks; and institutional alignment. A more recent approach also analyses key innovation processes or functions (Bergek et al, 2008b; Hekkert et al., 2007). Table 1
5 (first column) summarises seven important innovation system functions. The performance of these functions provides indications about the effective functioning of innovation systems. Interactions between a subset of four functions have been associated with virtuous cycles of development in the emergence of new innovation systems (Suurs et al., 2010). These four functions are: knowledge creation, entrepreneurial experimentation, influence on the direction of search, and market formation (Suurs et al., 2009; Hekkert and Negro, 2009). ‘Knowledge creation’ refers to how knowledge is generated, combined, codified and shared to establish the necessary scientific and technological base for an innovation to progress (Jacobsson and Bergek, 2012). ‘Experimentation’ refers to the development of a more applied, tacit and explorative knowledge by risk-taking and hence ‘entrepreneurial’ actors in the innovation system. ‘Influence on the direction of search’ relates to the mechanisms that influence how new actors in the innovation system allocate their activities and investments between competing technologies and designs (Bergek et al., 2008b). ‘Market formation’ refers to the articulation of demand around increasingly organized markets, from
demonstration projects to niches and bridging markets which enable increasing volumes of production before mass commercialization (Bergek et al., 2008a; Hekkert et al., 2009). As the innovation approaches mass commercialisation, other innovation system functions become increasingly important. These include materialisation, resource mobilization, and legitimation as well as continued market formation (Bergek et al., 2008b). Clear evidence of these functions signals the end of the formative phase.
‘Materialisation’ describes the first major investments in capital stock or artefacts (e.g. factories, infrastructure). ‘Resource mobilisation’ refers to the need to draw in human capital, financial capital and complementary assets from outside the innovation system. Finally, ‘legitimation’ is a socio-political process by which actors’ expectations are formed and shared, creating a network of potentially diverse actors as a coalition of advocates for the technology’s development (Bergek et al., 2008a; Borup et al., 2006). ‘Legitimation’ can play a key role in the cumulative strengthening of innovation systems by aligning institutions with the needs of the emerging innovation (Hekkert and Negro, 2009).
Both the performance of each system function and the interactions between them are necessary during the formative phase, along with the structural processes described above. The performance of more system functions is likely to enhance development of the TIS in terms of the generation, diffusion, and utilization of the new technology. In contrast, underperformance of the system functions will hinder development of the TIS. Various indicators have been used to track performance of individual innovation system functions (Table 1). Applying indicators is not straightforward, and in many cases it is difficult to objectively quantify comparable indicators. Examples include measuring expectations and their implications for diffusion, or clearly defining legitimation. However, they provide helpful information to map the emergence of new innovation systems.
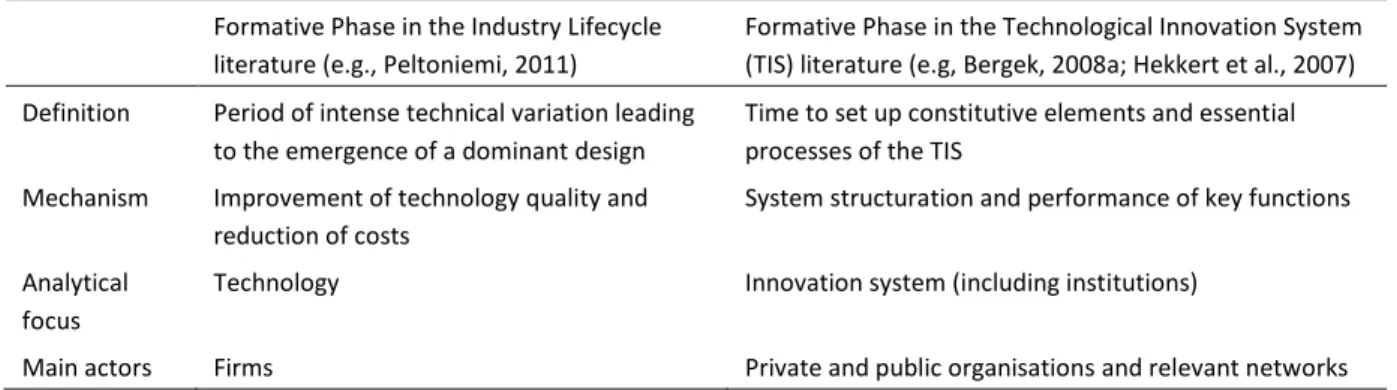
The functional and structural processes should co-evolve with the technology to prepare the innovation system for expansion. Table 2 summarizes the contributions of both the industry lifecycle literature and the technology innovation system (TIS) literature to the
understanding of the formative phase.
Table 1. Indicators used to measure innovation system functions (Sources: Bergek et al., 2008a,b; Hekkert et al., 2007; Vasseur et al., 2013; Gosens and Lu, 2013)
System function * Indicators Application issues & challenges
Knowledge creation R&D funding and activities. Scientific publication and patenting. Research networks (knowledge exchange). Workshops and conferences.
Distinguishing basic from applied R&D. Comparing data on networks,
workshops and conferences.
Entrepreneurial experimentation
Studies, demonstration pilots, field trials activities. Number of firms (new entrants and diversification of activities of incumbents).
Distinguishing experimentation from deployment.
Materialisation New factories opened.
Investment in new production plants, physical infrastructure.
Separating materialisation from resource mobilization.
Influence on the direction of search
Targets set by government or industry (e.g. roadmaps). Expectations and opinions of experts.
Articulation of demand by leading consumers.
Measuring expectations and their implications for diffusion.
Market formation Policies that stimulate market formation and expansion (e.g. protected niches, regulatory or fiscal instruments). Sales, unit numbers.
Installed capacity.
Establishing if sales growth is permanent and represents take-off.
Resource mobilisation Financial investments.
Human capital and complementary assets.
Quantifying human capital and complementary assets.
Legitimation Recognition of societal benefits (e.g. awards, competitions, brochures).
Technical assessment studies. Public debates (e.g. parliament, media). Lobbying activities.
Alignment of science and technology policy, and other institutions.
Confining definition of legitimation. Quantifying social recognition, public debates or lobbying activities.
* Development of positive externalities is included as an additional innovation system function in some studies and refers to the exploitation of synergies with other innovation systems (Bergek et al., 2008b).
Table 2. Conceptualization of the formative phase
Formative Phase in the Industry Lifecycle literature (e.g., Peltoniemi, 2011)
Formative Phase in the Technological Innovation System (TIS) literature (e.g, Bergek, 2008a; Hekkert et al., 2007) Definition Period of intense technical variation leading
to the emergence of a dominant design
Time to set up constitutive elements and essential processes of the TIS
Mechanism Improvement of technology quality and reduction of costs
System structuration and performance of key functions
Analytical focus
Technology Innovation system (including institutions)
7
2.3. Formative processes in the emergence of innovation systems
Formative phases within innovation system development is a relatively recent focus of research (Markard and Hekkert, 2013). A common approach for identifying the formative phase is to compare and contrast the changing state of the innovation system over time. Bergek et al. (2008a) distinguish between a formative phase when “… constituent elements of the new TIS begin to be put into place...” (p. 419) and a growth phase when “… the focus shifts to system expansion and large-scale technology diffusion through the formation of bridging markets and subsequently mass markets…” (p. 420).
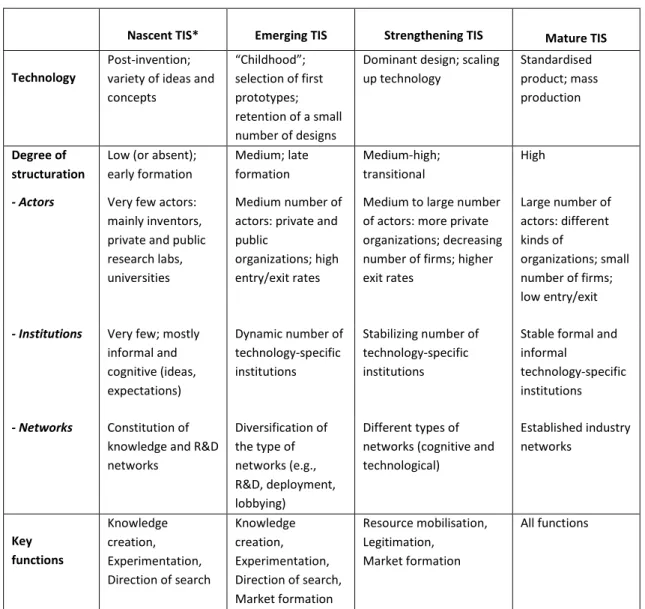
Table 3 summarises the changes in innovation systems as they grow and evolve through different stages: nascent, emerging, strengthening, mature. During each stage, the innovation system is characterised by differences in technology characteristics, structural elements (actors, institutions, networks), and key functions (Markard and Hekkert, 2013). The “nascent” TIS in the start of the formative phase is marked by the existence of a large variety of ideas and concepts. The structure of the innovation system comprises a small number of actors organized mainly in networks dedicated to R&D activities and knowledge creation. Jacobsson (2008) and Markard and Hekkert (2013) consider early trials and demonstrations to also be part of the nascent stage of TIS development.
In contrast, the “emerging" TIS at the end of the formative phase is evidenced by a more stable technology design and a gradually more structured innovation system. The key processes that play a more influential role include market formation and strengthening expectations (guiding the direction of search). This process is complex and typically in competition with other technologies. An increasing number of actors also reinforces the political strength of advocacy coalitions helping to align institutions with the needs of the innovation system (Bergek et al., 2008a; Borup et al., 2006).
Table 3. Stages of maturation of technological innovation systems (adapted from Markard and Hekkert, 2013).
Nascent TIS* Emerging TIS Strengthening TIS Mature TIS
Technology
Post-invention; variety of ideas and concepts “Childhood”; selection of first prototypes; retention of a small number of designs
Dominant design; scaling up technology Standardised product; mass production Degree of structuration
Low (or absent); early formation Medium; late formation Medium-high; transitional High
- Actors Very few actors: mainly inventors, private and public research labs, universities
Medium number of actors: private and public
organizations; high entry/exit rates
Medium to large number of actors: more private organizations; decreasing number of firms; higher exit rates Large number of actors: different kinds of organizations; small number of firms; low entry/exit
- Institutions Very few; mostly informal and cognitive (ideas, expectations) Dynamic number of technology-specific institutions Stabilizing number of technology-specific institutions
Stable formal and informal
technology-specific institutions
- Networks Constitution of knowledge and R&D networks Diversification of the type of networks (e.g., R&D, deployment, lobbying) Different types of networks (cognitive and technological) Established industry networks Key functions Knowledge creation, Experimentation, Direction of search Knowledge creation, Experimentation, Direction of search, Market formation Resource mobilisation, Legitimation, Market formation All functions
* Including ‘incubation time’ of the innovation, i.e. the development time prior to introduction.
3. Indicators of the start and end points of formative phases
The previous section articulated the formative phase in terms of technology characteristics, innovation system elements and functions. This provides a clearer basis for choosing
indicators that can measure formative phase durations in a standardised and comparable way. Estimating formative phase durations consistently across technologies allows the determinants of more rapid formative phases to be identified and tested. This has not been done to-date, yet is of major current policy interest in response to climate change mitigation challenges.
9 This paper proposes a range of indicators for the start and end of the formative phase, building on the formative phase processes shown in Table 3 and the indicators used in the literature to characterise innovation system functions shown in Table 1. Additional indicators are compiled using industry lifecycle characteristics including the number of firms, shake-out, and cost reductions.
3.1. Start point indicators
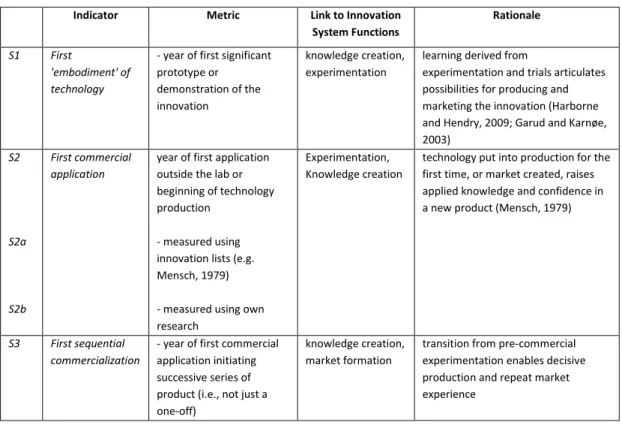
Table 4 presents the indicators and associated metrics for the start points of formative phases. The indicators are: (S1) first ‘embodiment’ of technology; (S2) first commercial application; (S3) first sequential commercialization. Linkages between each indicator and innovation system functions at the beginning of the formative phase are shown in Table 4. These include important system functions in early years such as knowledge creation, experimentation, and market formation.
First embodiment of technology (S1) was chosen because of the importance for technology development of learning obtained from the first trials (Hendry et al., 2010), and its
correspondence with applied knowledge creation as a key innovation process. First
commercial application (S2) has been considered in previous studies (e.g. Mensch, 1979) and is a mark in the development of innovation systems, particularly in the growth of
entrepreneurial experimentation. First sequential commercialisation (S3) is an important indicator of transition from pre-commercial experimentation to more sustained production as a basis for learning and specifically for early market formation. Overall these indicators show the direction of search and mark the progress of the new technology, as well as the increasing dynamics of the emerging innovation system.
Additional indicators were considered but rejected due to lack of data. These include first peak in R&D expenditure (see Appendix B). They are explained in detail in a separate technical report (Bento and Wilson, 2014).
Table 4. Indicators to define start point of formative phase
Indicator Metric Link to Innovation
System Functions
Rationale
S1 First
'embodiment' of technology
- year of first significant prototype or
demonstration of the innovation
knowledge creation, experimentation
learning derived from
experimentation and trials articulates possibilities for producing and marketing the innovation (Harborne and Hendry, 2009; Garud and Karnøe, 2003) S2 S2a S2b First commercial application
year of first application outside the lab or beginning of technology production
- measured using innovation lists (e.g. Mensch, 1979)
- measured using own research
Experimentation, Knowledge creation
technology put into production for the first time, or market created, raises applied knowledge and confidence in a new product (Mensch, 1979)
S3 First sequential commercialization
- year of first commercial application initiating successive series of product (i.e., not just a one-off)
knowledge creation, market formation
transition from pre-commercial experimentation enables decisive production and repeat market experience
3.2. End point indicators
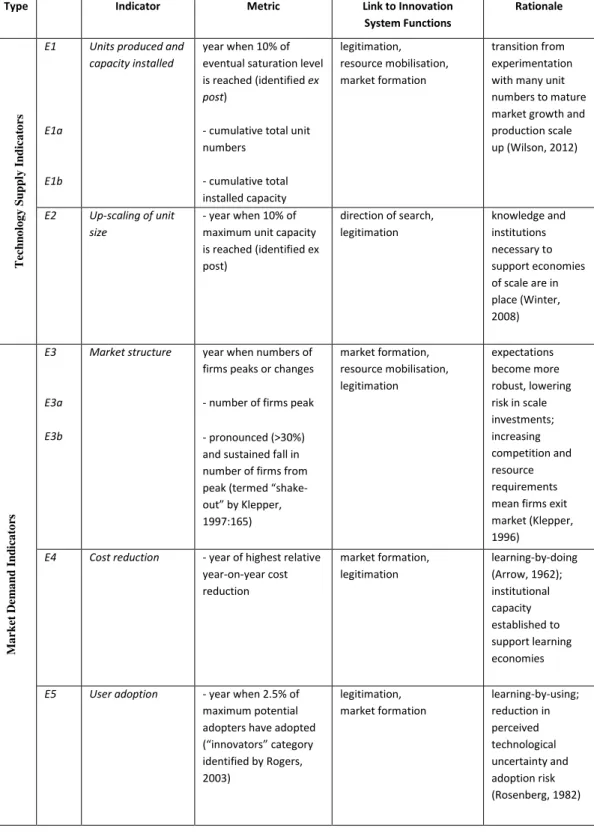
Table 5 presents the indicators and associated metrics for the end points of formative phases. These include both indicators of technology supply and market demand.
Technology supply indicators reveal growth in production capacity (e.g., the entry of actors, development of networks, build-up of value chains, alignment of regulation - reflecting an increasingly structured TIS), as well as indirectly show a technology’s design maturity. The indicators are: (E1) numbers of units produced and capacity installed; (E2) up-scaling. These indicators were demonstrated empirically in a study of wind power development (Wilson 2012). In both cases, a 10% threshold is used. Marchetti and Nakicenovic (1979) first proposed a metric for time durations of technological substitution, with the changeover time, Δt, being the time to grow from 10 to 90% market share. 10% of eventual saturation is therefore a recognised milestone. As an example, Grubler (2012) finds that at the global level, characteristic changeover times in primary energy span 80 to 130 years. The indicators relate to specific innovation system functions. The number of installations indicate market formation, and technology up-scaling reveals the choice of design or standard which reinforces the direction of search.
Market demand indicators provide information about learning-by-using and on the market readiness of a technology. The indicators are: (E3) market structure; (E4) cost reduction; (E5) user adoption. These indicators have been widely applied in technology lifecycle and
11 management studies (Klepper 1997; Agarwal and Bayus, 2002; Rogers, 2003). Linkages to innovation system functions include: number of companies indicating resource mobilisation; learning and cost reduction evidencing market formation; and adoption by the “innovators” group demonstrating legitimation. Additional indicators were considered but rejected due to lack of data. These include number of patents, dominant designs, and production scale up (see Appendix C). They are explained in detail in a separate technical report (Bento and Wilson, 2014).
Although most of the indicators can be tracked as a technology progresses through the formative phase, the two technology supply indicators (E1 & E2) can only be identified ex
Table 5. Indicators to define end point of formative phase
Type Indicator Metric Link to Innovation
System Functions Rationale T ec h n o lo g y S u p p ly I n d ic a to rs E1 E1a E1b
Units produced and capacity installed
year when 10% of eventual saturation level is reached (identified ex
post)
- cumulative total unit numbers - cumulative total installed capacity legitimation, resource mobilisation, market formation transition from experimentation with many unit numbers to mature market growth and production scale up (Wilson, 2012)
E2 Up-scaling of unit size
- year when 10% of maximum unit capacity is reached (identified ex post) direction of search, legitimation knowledge and institutions necessary to support economies of scale are in place (Winter, 2008) M a rk et D em a n d I n d ic a to rs E3 E3a E3b
Market structure year when numbers of firms peaks or changes
- number of firms peak
- pronounced (>30%) and sustained fall in number of firms from peak (termed “shake-out” by Klepper, 1997:165) market formation, resource mobilisation, legitimation expectations become more robust, lowering risk in scale investments; increasing competition and resource requirements mean firms exit market (Klepper, 1996)
E4 Cost reduction - year of highest relative year-on-year cost reduction market formation, legitimation learning-by-doing (Arrow, 1962); institutional capacity established to support learning economies
E5 User adoption - year when 2.5% of maximum potential adopters have adopted (“innovators” category identified by Rogers, 2003) legitimation, market formation learning-by-using; reduction in perceived technological uncertainty and adoption risk (Rosenberg, 1982)
3.3. Estimating durations
Formative phase durations can be estimated by differencing the start and end point indicators. Figure 1 provides an example for passenger cars in the US. Results from all available indicators are compared to find the earliest estimate of the start point (minimum or leftmost dot) and the latest estimate of the end point (maximum or rightmost cross). This
13 sets the upper bound for formative phase duration (light blue bar), expressing the
uncertainties associated with competing indicators. A central estimate of formative phase duration (dark blue bar) spans the time period between preferred indicators of start and end points which are consistent across all technologies (see below). This narrows the gap to a more plausible interval that can be comparable across technologies.
Figure 1. Estimating formative phase durations and uncertainties, using passenger cars in the US as an example.
4. Formative phase durations of energy technologies
4.1. Applying the indicators
To demonstrate how the proposed indicators can be used to consistently measure formative phase durations across diverse technologies, we compiled data characterising a sample of 16 energy technologies that have diffused into the mass market and so transitioned out of their formative phases. The sample was not designed to be exhaustive but to cover a diverse range of technologies. It comprises: (1) energy supply and end-use, (2) large and small technologies, and (3) historical and current technologies (see Appendix A). Following Murmann and Frenken (2006), technologies are defined as the highest level of complexity and aggregation of component parts excluding distribution infrastructure and
commercialization (e.g., power plants rather than electricity systems or steam turbine units). Unless otherwise mentioned, the spatial scale of analysis always corresponds to the initial markets of first commercial application for each technology in which the formative phases marked the emergence of a new innovation system. As examples, wind power is analysed in Denmark, cars in the US, e-bikes in China (see Appendix A for details). A synthesis of all relevant data and sources is included in Appendices B and C, and elaborated in detail in a separate technical report (Bento and Wilson, 2014).
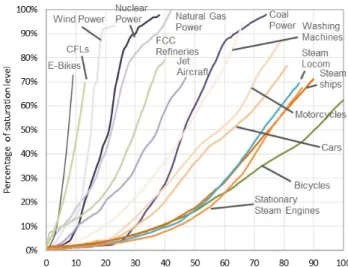
The diffusion dynamics of sampled technologies in their initial markets are shown in
Figure 2. The graph shows rising market shares in these initial markets from the point when each technology passed a threshold of 0.1% of its eventual maximum installed capacity. This makes it easier to compare between technologies and removes the annual growth volatility of the very early diffusion period. Maximum capacities or saturation levels are either observed (e.g., steam engines) or estimated using fitted logistic functions to observations, subject to goodness of fit criteria (e.g., wind power). Saturation levels are only estimated in the mature initial markets of first commercialisation. Full details of the saturation level estimations are provided in a separate technical report (Bento and Wilson 2014).
The sample includes technologies showing relatively fast diffusion (e.g. e-bikes, compact fluorescent lamps or CFLs) as well as those with much slower market progression (e.g. motorcycles, cars, bicycles). Mobile phones are not included in Figure 2 as the saturation level is still uncertain.
Figure 2. Diffusion of energy technologies in their initial markets
4.2. Selecting preferred indicators
Different indicators of the start and end points of the formative phase are shown in Figure 3 for the sampled technologies ordered historically by the year of invention, from the earliest (at the top) to the latest (at the bottom). The periods between start and end indicators reveal long formative phases spanning several decades. Durations are longer in the case of older, general purpose technologies like steam engines which had to wait for the
development of complementary innovations before their pervasive impact across several sectors of the economy could be achieved (Rosenberg and Trajtenberg, 2004).
15 Figure 3. Indicators of the start and end points of formative phases in initial markets. (Technologies ordered historically by year of invention).
Of the indicators for the start point of the formative phase, (S1) ‘first embodiment’ is generally the earliest date whereas (S2) ‘first application’ and then (S3) ‘first sequential commercialization’ provide later estimates, as expected. The start point indicators tend to converge, apart from in certain cases such as wind power and e-bikes. For both technologies, initial innovation and first applications were in the 1890s but the first sequential
commercialisation observed in the data did not begin until almost a century later in Denmark and China respectively.
A single preferred indicator is needed for consistency when comparing formative phases across technologies. Three criteria were used to select a preferred indicator: (i)
correspondence with formative phase processes identified in the literature; (ii) available data for most technologies; (iii) consistency with other indicators (i.e., not an outlier). The (S3) ‘first sequential commercialisation’ indicator best meets these criteria. First, it is strongly related to formative innovation processes as the start of commercialization applies knowledge created to intensify production and materialise a technology. Second, data are available for all but one technology. Third, the indicator correlates strongly with the average of the other two indicators (r=0.93). The main drawback of the (S3) ‘first sequential
commercialisation’ indicator is that it does not take into account early development and experimentation activities (including the ‘incubation time’) which might be important formative processes prior to serial production (Markard and Hekkert, 2013; Jacobsson, 2008).
The different indicators for the end point of the formative phase diverge more clearly in some cases (see Figure 3). The measures for stationary steam engines, for example, range over a 150 year period from 1727 to 1880 for (E4) 'highest % cost reduction' and (E1a) '10%
cumulative total units' respectively. However, there is less divergence for more recent technologies.
Clear links to theory, available data, and consistency, were again applied as criteria to select a preferred indicator. The (E5) ‘user adoption’ indicator, measured by a 2.5% share of market potential being reached, best met the criteria. First, it links directly to the initial segment of market demand identified by Rogers (2003). It is consistent with the formative phase ending since technology risks, uncertainties and market misalignments are reduced such that adoption moves from ‘innovators’ to the subsequent and larger group of ‘early adopters’. Second, data were available for all but one technology (fluid catalytic cracking or FCC in oil refineries). Third, correlations with the average of all the other indicators was high (r=0.95).
To measure this indicator, assumptions have to be made about the potential market within which the innovation is adopted and gains market share. To measure the (E5) ‘user
adoption’ indicator, actual market growth (e.g., units sold or capacity installed) is divided by the potential market size for the corresponding year (see Appendix A). Other methods for inferring thresholds of market take-off compare sales growth rates either with market penetration rates (Tellis et al., 2003), with annual sales (Golder and Tellis, 1997), or with annual net entry rates (Agarwal and Bayus, 2002). Using a 2.5% share of market potential is comparatively simple, less data demanding, and applies to a broad set of technologies. One drawback of the ‘user adoption’ indicator is that it does not directly measure a technology’s maturity at the end of the formative phase. The (E2) ‘up-scaling of unit size’ indicator, measured by a 10% threshold of maximum unit capacity being reached, was selected as a complementary technology indicator. This conveys important information on the readiness of the technology for commercialisation at larger scales. However, data are only available for those technologies that up-scaled significantly (mainly energy supply technologies). Moreover, the indicator could only be estimated ex post once the unit capacity frontier for each technology had been revealed, unless reliable ex ante estimates could be made based on physical principles. Ex post indicators were suitable for this study of historical technologies in their initial markets for which market saturation is either observed or is being approached.
Of the two preferred indicators, (E5) ‘user adoption’ generally gives slightly earlier estimates of the end point of the formative phase, up to a decade earlier than the (E2) ‘up-scaling’ indicator (see Figure 3).
4.3. Average durations
Using (S3) ‘first sequential commercialisation’ and (E5) ‘user adoption’ as the preferred start and end point indicators respectively, Table 6 shows the central estimates of formative phase duration for each technology. The mean central estimate of formative phase duration
17 across the 16 technologies in the sample is 22 years from a range of 4 – 85 years. Table 6 also shows the longest estimates of formative phase duration from the earliest start point indicator to the latest end point indicator which vary for each technology. This upper bound on formative phase duration has a mean of 75 years across the technologies in the sample from a range of 4 – 168 years.
Table 6. Formative phase durations in years. (Technologies ordered historically by year of invention).
Energy technology Central estimate
Longest estimate
Stationary Steam Engines 85 168
Steamships 19 114
Steam Locomotives 21 96
Bicycles 25 83
Coal Power 9 79
Natural Gas Power 25 71
Cars 23 82 Washing Machines 15 58 Motorcycles 21 71 Wind Power 15 115 E-Bikes 35 114 Jet Aircraft 7 40
FCC, Fluid Catalytic Cracking (refineries) 4 5
Nuclear Power 13 22
Mobile Phones 14 55
CFLs, Compact Fluorescent Lamps 20 27
Mean (all technologies) 22 75
Median (all technologies) 20 75
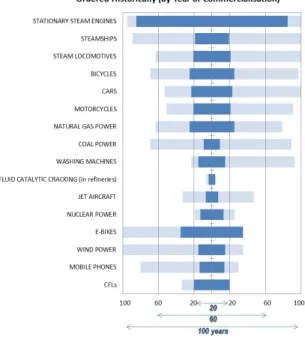
Figure 4 shows the central estimates (dark blue bars) and the longest estimates (light blue bars) of formative phase durations for the technologies ordered historically by year of commercialisation rather than by year of invention, as in Table 6. This reorders wind power and e-bikes to their later commercial time periods. Three observations can be made. First, formative phase durations for older technologies are more uncertain, particularly in terms of their end points. Second, longer formative phases are more uncertain in duration, which includes those for the steam technologies, passenger cars and natural gas power plants. Third, even though stationary steam engines passed through a long formative phase in the 18th century, there is no clear trend indicating an acceleration in formative phases for more recent technologies. This result contributes to the debate on accelerated diffusion. Studies of multiple consumer durables show no evidence of a shorter incubation time (Kohli et al., 1999) or of diffusion acceleration over time (Stremersch et al., 2010; Peres et al., 2010). However, Golder and Tellis (1997) find evidence of decreasing time to takeoff of products
introduced after World War II, and Meade and Islam (2006) similarly discuss studies that suggest an increase of diffusion speed over the past century.
Figure 4. Formative phase durations: central and longest estimates. (Technologies ordered historically by year of commercialization). Note: The origin of the x-axis is set equal to the midpoints of the central estimates for each technology (dark blue bar). Uncertainties in start point are shown to the left of the origin; uncertainties in end point are shown to the right of the origin (light blue bars).
4.4. Determinants of duration
Measuring formative phase durations consistently allows a comparative analysis across technologies of the effect of technology and market characteristics. Although the innovation systems literature identifies key formative processes, it does not generalise how long these processes tend to last nor what the determinants of formative phase duration may be. In contrast, the factors that explain the duration of diffusion are more clearly understood. These include: relative advantage, complexity, compatibility (Rogers, 2003; Golder and Tellis, 1997; Fabrizio and Hawn, 2013); substitutability, inter-relatedness and infrastructure needs (Grubler et al., 1999); and market size (Wilson et al., 2012).
By signalling important characteristics of the technology and market, similar factors may affect the duration of formative phases as well. For example, technologies which are not ready substitutes for incumbent technologies may require longer formative phases to align supporting institutions (legitimation) and to stimulate user demand in forming markets (Hekkert et al., 2007). Other factors explaining formative phase duration may include unit scale, which affects the risks and resource requirements for experimentation with multiple units, and the up-scaling of unit sizes, which is associated with convergence on a dominant
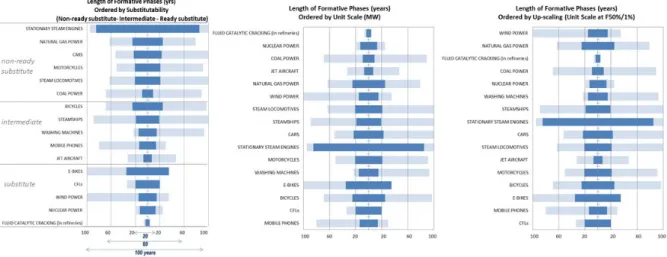
19 design and a clearly articulated market demand. Figure 5 presents formative phase durations sorted by these three factors: substitutability, unit scale and up-scaling.
Figure 5. Formative phase durations in years, ordered by substitutability (left panel), by unit scale (middle panel) and up-scaling (right panel).
a) Substitutability
Technologies in the sample vary in the extent to which they are ready substitutes for
incumbent technologies. Diffusion processes are slower for non-ready substitutes that need new institutions and infrastructures to develop to enable commercialisation (Grubler et al., 1999). The potential to share structural elements with other innovation systems may also be more limited for technologies that are not ready substitutes. This constrains the positive externalities which enable more rapid innovation system development (Bergek et al., 2008b, 2015).
As an approximation of substitutability, the 16 energy technologies in the sample were subjectively assigned to one of three categories (non-ready substitutes, intermediate, ready substitutes) based on the extent to which their market deployment depended on demand for novel services and changes in user practices, or new infrastructures and supporting institutions. As examples, steam engines brought new energy services in mines and industry (non-ready substitute), whereas wind power diffused into already existing electricity
networks and markets (ready substitute).
Figure 5 (left panel) indicates relatively rapid formative phases in the case of ready
substitute technologies for which ancillary infrastructure (airports, electricity grids, refuelling stations, etc.) was already in place. Non-ready substitute technologies, including stationary steam engines, passenger cars, coal and gas power, needed longer to develop the requisite knowledge, institutional capacity and infrastructure to mature commercially and scale up.
b) Unit scale
Figure 5 (middle panel) shows formative phase durations ordered by unit scale (in MW) with larger sized technologies at the top. Although no overall pattern is observed, very large technologies including fluid catalytic cracking, nuclear power plants and jet aircraft, show relatively rapid formative phases. This result is unexpected considering the significant
challenges, resource requirements, and risks involved in the deployment of these large-scale technologies. However, the formative phases of all three technologies were linked to the unique institutional environment around World War II, including strong demand-pull, price insensitive military users, and sharing of intellectual property (Delina and Diesendorf, 2013). This raises the possibility that formative phases can be compressed or accelerated in
extreme demand environments with simultaneous market-pull and technology-push efforts, and low sensitivity to risk.
c) Up-scaling
Figure 5 (right panel) shows formative phase durations ordered by up-scaling of unit sizes, with larger up-scaled technologies at the top. Up-scaling is measured by the growth in unit size up until the midpoint of the diffusion curve. There is no clearly observable relationship between up-scaling and formative phase duration. Some technologies that barely scaled up had long formative phases (e.g., washing machines); others that up-scaled intensively passed through a fast period of formation (e.g., nuclear power).
d) Other determinants
Table 7 summarises the formative phase durations for subsets of technologies grouped by substitutability, unit size, and up-scaling. Differences in the mean formative phase durations between groups were tested for significance, using an 80% confidence interval appropriate for small heterogeneous samples (Boland et al, 2001). Tests confirm the patterns observed in Figure 5, especially for ready substitute technologies which have significantly shorter formative phases. However, given the small sample, wide confidence intervals, and the subjective classification of substitutability, results at this stage are considered to be indicative only.
Technologies are also grouped according to their applications: energy supply vs. end-use; transport vs. non-transport; and environmental vs. non-environmental technologies. End-use technologies might be expected to have shorter formative phases if their smaller unit sizes allow more rapid learning cycles, whereas transport technologies and environmental technologies might be expected to have longer formative phases if their commercialisation is strongly dependent on dedicated infrastructure or regulation respectively. Tests of
difference shown in Table 7 support these expectations only in the case of environmental technologies. Other differences were found to be not significant, even if the direction of difference was consistent with expectations.
21 Table 7. Determinants of formative phase duration. Notes: means show average durations per subset of technologies using central estimates for each technology. Significance of t-test statistics use 80% confidence intervals (see text for details).
Technology or market characteristic Number of technologies Mean formative phase duration Expectation Result (n) (years) Technology characteristics shorter for substitute technologies expectation supported Substitutability Non-Ready Substitute 6 31 Ready Substitute 5 17 t=1.09 * Unit scale
shorter for small unit scales expectation not supported Above 1MW 12 22 Below 1MW 4 24 t= .28 Up-scaling
shorter for low up-scaling
expectation confounded (opposite result) High (higher than 5x) 5 13
low (less than 1x) 4 24
t=1.82 **
Initial cost
shorter for lower initial cost
expectation not supported High (more than $1,000) 3 42
Low (less than $1,000) 4 25 t= .71
Technology lifetime
shorter for shorter lifetime
expectation not supported Long (equal or more than 20 years) 9 22
Short (less than 20 years) 7 22
t= .01
Application of technology
shorter for end-use technologies expectation not supported End-use 10 20 Supply 6 25 t= .41
Transport 7 22 shorter for other
technologies
expectation not supported
Non-Transport 9 22
t= .07
Environmental 4 24 shorter for other technologies expectation supported Non-Environmental 6 15 t=1.57 ** Diffusion characteristics
shorter for rapid diffusion
expectation supported
Diffusion duration
Very slow (more than 50 years) 7 30 Rapid (20 years or less) 5 19
t=1.03 *
Diffusion pervasiveness
shorter for lower pervasiveness
expectation confounded (opposite result) High (more than 10,000 MW) 6 15
Low (less than 10,000 MW) 10 26
t=1.41 **
* significant at 0.2 level, ** significant at 0.1 level, *** significant at 0.05 level. a Environmental technologies comprise CFLs, e-bikes,
Table 7 also includes tests for other potential determinants of formative phase duration. All else being equal, longer formative phases might be expected for technologies that diffuse more pervasively, have higher initial costs and longer lifetimes. These latter two
characteristics imply fewer or more costly opportunities for rapid experimentation and learning cycles during the formative phase.
More rapid formative phases were found for technologies with pervasive impacts in the market. These unexpected results which confounded expectations are again influenced by the presence in these two subsets of technologies of nuclear power and fluid catalytic cracking linked to accelerated formation during a time of war. In sum, the results show that certain technology characteristics, technology applications and overall diffusion can have an effect in the duration of formative phases.
5. Discussion and conclusion
The objective of this research was to develop an operational definition of the duration of formative phases to enable comparative technology analysis. The formative phase
designates the early stage of technology development that prepares an innovation for up-scaling and widespread growth. It was shown that a set of indicators can be developed from signs of innovation maturity and formative processes identified in the literature and then be consistently applied to a diverse sample of technologies.
The year of first sequential commercialization is a decisive mark at the start of the formative phase by showing the innovation’s readiness to fulfil expectations of initial demand.
Distinguishing a clear end point for the formative phase is more uncertain. Diffusion passing an adoption threshold of 2.5% of its market potential is an important milestone as it
coincides with the adoption of a new technology by risk-taking “innovators” whose user experiences contribute to lowering perceived risks and aligning the technology with market needs (Rogers, 2003). For a subset of technologies that up-scale, a 10% threshold of the unit capacity frontier being reached is a complementary metric of a maturing technology that correlates well with the user adoption metric.
Applying these start and end point indicators to a sample of 16 energy technologies shows that formative phases are long, lasting on average over 20 years. Establishing a functioning innovation system to support a technology’s diffusion takes time. Formative phase durations are significantly longer for technologies that are not ready substitutes and that provide novel energy services. Steam engines are the clearest example. Crude and expensive initial designs required lengthy cycles of knowledge creation, testing and refinement to address
uncertainties on designs, markets, and applications (Craft, 2004). Other technologies that created new service demands and markets, including cars and coal power from the early 20th century, require not just an extended period of experimentation and knowledge
23 development, but also an extensive institutional process of legitimation to overcome the “liability of newness” (Bergek et al., 2008a).
More generally, institutional context was found to be decisive in the formation of new technologies. The sample comprised a set of complex, large-scale technologies, including nuclear power and jet aircraft, whose formative phases were compressed due to aggressive innovation efforts combining market-pull and technology-push under the extreme
environment of WWII (Delina & Diesendorf, 2013). This reinforces the importance of understanding the role of contextual influences in TIS development (Bergek et al., 2015). There were few other consistent influences of market and technology characteristics on formative phase durations. Expectations that smaller unit scale, less cost intensive, energy end-use technologies might have shorter formative phases given the more numerous opportunities for experimentation and learning were not supported in the data. The only significant determinants of relatively rapid formative phases in line with expectations were substitute technologies with short market diffusion times and non-environmental
technologies. Given the small size of the data set, this latter finding needs further research to test how regulation or policy can support environmental technologies as part of broader system transitions.
However, the central finding of formative phases averaging over two decades in duration corroborates the importance of accumulative processes identified in the innovation systems literature, including experimentation in the initial years of the formative phase, as well as legitimation and market formation at a later stage (Bergek et al. 2008a; Markard and Hekkert, 2013).
This highlights the risks inherent in current efforts to accelerate the commercialisation of low carbon technologies (Winskel and Radcliffe, 2014; Henderson and Newell, 2011). The stringency of climate change mitigation targets has led to calls to compress the formative phases of a wide portfolio of novel energy supply and end-use technologies from carbon capture and storage (Haszeldine 2009) and next generation nuclear power (Grimes and Nuttall, 2010) to cellulosic biofuels and electric vehicles (Tran et al., 2012).
The historical evidence analysed in this research shows that compressed formative phases are only characteristic of technologies that are ready substitutes for incumbents (e.g. compact fluorescent lamps, wind power). Centralised low carbon power production and hybrid-electric vehicles meet these criteria for rapid formation more closely than carbon capture and storage (CCS) with its requirements for new CO2 pipeline infrastructure (Smil 2010) or electric vehicles with their requirements for reshaped user expectations and driving practices (Tran et al. 2012). As CCS systems at industrial scales have not been sequentially commercialised over two or more years (de Coninck and Benson, 2014), it is even arguable whether CCS has yet begun its formative phase.
History thus offers a cautionary note on the potentials and risks of policy efforts to
accelerate formative phases. Policies pushing to commercialise pre-mature technologies by picking a technical design or shortcutting key formative processes can result in failure. Examples from the early 1980s include the breeder reactor and synfuel production in the US, and the rapid up-scaling of wind turbines in Germany and the Netherlands (Grubler and Wilson, 2014). A systemic and sustained approach to technology formation, supported by stable and consistent policy, is more likely to help accumulate knowledge and experience from experimentation while building and aligning market demand.
There are various fruitful avenues for further research. First, results can be validated on a larger sample of technologies and additional indicators can be used to track the start and end points of formative phases (e.g., number of patent applications, dominant designs, R&D expenditures). Data availability may be an issue in both cases. Second, further testing is needed to detect robust explanations of formative phase durations across diverse
technologies, particularly for those factors where results confounded expectations (e.g., up-scaling, diffusion pervasiveness). Multivariate models controlling for other influences may be possible for larger samples. Third, it would be interesting to explore whether shorter
formative phases are more strongly associated with lock-in to a dominant design that
ultimately proves inferior, as has been argued for technologies such as the pressurised water reactor in the nuclear industry (Cowan, 1990). Finally, the characteristics of formative phases for innovations that failed to diffuse in the market should also be examined.
Acknowledgments
The research on which this article is based was supported by a grant from the International Institute for Applied Systems Analysis (IIASA), and Harvard Kennedy School. The authors would also like to thank Arnulf Grübler for valuable insights throughout the research, as well as Henry Lee, Laura Diaz Anadon and Luís Cabral.
Supplementary material
The spreadsheets containing the data series and all the analysis can be found at http://webarchive.iiasa.ac.at/~bento
25 Appendix A. Data compiled for 16 energy technologies. (Technologies ordered historically by year of invention). See Appendices B and C for details.
Technology * Data & Units
Time Series Initial Markets
(scale of analysis)
Market Potential
** Main Sources
Unit Capacity Unit
Numbers Industry Capacity Stationary Steam Engines Su Total Capacity (#,hp) 1710-1930
(average only) 1710-1930 1710-1930 UK, US
power provided by different sources Kanefsky, Woytinsky, US Census Steamships Ed Installed Capacity (#, hp) 1810-1940
(average only) 1810-1940 1810-1940 UK, US
gross tonnage of merchant vessel fleet (sail, steam,
motor) Mitchell, Woytinsky, US Census Steam Locomotives Ed Installed Capacity (#, hp) 1830-1960
(average only) 1830-1960 1830-1960 UK, US
rail passenger traffic (million passengers) Woytinsky, US Census, Daugherty Bicycles Ed
Production(#) estimated 1861-2010 estimated
UK, France, Germany population UN, UK and US Census, INSEE, DIW Coal Power Su Capacity Additions (#, MW) 1908-2000 (max. & average) 1908-2000 1908-2000 OECD number of power plants in use Platts Natural Gas Power Su Capacity Additions (#, MW) 1903-2000 (max. & average) 1903-2000 1903-2000 OECD number of power plants in use Platts Passenger Cars Ed Production (#) & Engine Capacity (hp) 1910-1960, 1960-2005 1900-2005 calculated from unit data US number of households AAMA, US NHTSA, ACEA Washing Machines Ed Production (#)
estimated 1920-2008 estimated US number of households
UN, Stiftung Warentest
Motorcycles Ed Production (#)
estimated 1900-2008 1900-2008 UK, France, Germany, Italy number of households UN Wind Power Su Capacity Additions (#, MW) 1977-2008
(average only) 1977-2008 1977-2008 Denmark
electricity generation mix DEA, BTM Consult Electric Bicycles (E-bikes)
Ed Production (#) estimated 1997-2010 estimated China number of households Weinert, Jamerson & Benjamin Passenger Jet Aircraft Ed Production (#, Model) & Engine Thrust (kN) 1958-2007 (max. & average)
1958-2007 1958-2007 Boeing number of air carriers in service Jane’s, aircraft databases Fluid Catalytic Cracking (FCC) in Oil Refineries Su Total Capacity (bpd) 1940-2000 (average only) not available 1940-2007 OECD, Former Soviet Union (FSU) -
Oil & Gas Journal, BP, Enos Nuclear Power Su Capacity Additions (#, MW) 1956-2000 (max. & average)
1956-2000 1956-2000 OECD total installed
capacity Platts
Mobile
Phones Ed Sales
(#)
estimated 1979-2010 1979-2010 Scandinavia,
Japan population Gartner
Compact Fluorescent Light Bulbs (CFLs) Ed Sales (#)
estimated 1990-2003 estimated OECD (exc.
Japan) light bulb sales IEA
* Su = energy supply technologies, Ed = end-use technologies.
** Market potential used for end point indicator (see text for details). Data for same initial markets as time series, except for: stationary steam engines (UK); jet aircraft (US); steamships (US); motorcycles (UK).
Appendix B. Start of formative phase: Data synthesis
Formative Phase
INDICATOR UNITS STATIONARY STEAM ENGINES STEAMSHIPS STEAM LOCOMOTIVES BICYCLES WIND POWER COAL POWER
MOTORCYCLES CARS E-BIKES NATURAL
GAS POWER WASHING MACHINES CFLs FLUID CATALYTIC CRACKING (in refineries) JET AIRCRAFT NUCLEAR POWER MOBILE PHONES Reference Points Invention (cf. invention lists) Year 1707 1707 1769 1818 1888 1842 1885 1860 1897 1842 1884 1972 1929 1928 1943 1973
Source Haustein &
Neuwirth
Haustein & Neuwirth
Mensch Mensch Gipe Mensch Van Duijn Mensch US
Patent 596,272
Mensch Van Duijn IEA
(2006)
Enos (1962) Mensch Haustein &
Neuwirth US Patent 3,906,166 Ex Ante START POINTS First 'embodiment' of technology Year 1712 1776 1804 n/d 1887 1878 1885 1873 1891 n/d 1904 1973 1940 n/d 1951 1946
Model Newcomen Jouffroi's
Palmipède Trevithick's locomotive n/d First wind turbine First power station in Bavaria Daimler-Maybach's Reitwagen Bollé's 1st steam vehicle Electric tricycle by A.L. Ryker n/d First electric washing machine GE invents spiral CFL Pilot plant in Louisiana
n/d EBR-I Idaho First mobile
phone in a car First application outside lab / commercial application (I) Year Source 1712 1809 1824 1839 1891 1884 1894 1886 n/d 1884 1907 1980 1942 1941 1954 n/d (innov.list) Von Tunzelmann (1978) Silverberg & Verspagen; Haustein & Neuwirth
Mensch Mensch Gipe Mensch Silverberg &
Verspagen; Van Duijn
Mensch n/d Mensch Silverberg
& Verspagen; Van Duijn IEA (2006) Silverberg & Verspagen Mensch Silverberg &Verspagen; Haustein &Neuwirth n/d First application outside lab / commercial application (II) Year 1712 1807 1814 1861 1891 1882 1894 1885 n/d n/d 1908 1980 1942 1939 1954 1977 Own Research Newcomen Robert Fulton's Clermont Stephenson's Locomotion Michaux's Velocipède La Cour Edison Electric Light Station H&W motorcycles Benz n/d n/d Thor washer Philips model SL Enos (1962) von Ohain's first flight USSR's Obninsk plant Prototype cellular system First sequential commercialization Year 1717 1811 1825 1861 1977 1908 1900 1888 1970 1903 1908 1980 n/d 1952 1954 1979 Number of Units 5 1 4 2 2 1 1330 n/d n/d 1 n/d 100000 n/d 10 1 n/d
Model Newcomen Paddle wheel
and sail Locomotion No 1 Michaux's Velocipède Danish 3-blade (26kW) Turbo generators
Werner (UK) Benz car n/d n/d Thor Philips
SL n/d Comet APS-1 OBNINSK First commercial system in Japan Additional Indicators First maximum in public R&D expenditure Year n/d n/d n/d n/d n/d n/d n/d n/d n/d n/d n/d n/d n/d 1971 1983 1987 Public R&D in 2005$ million n/d n/d n/d n/d n/d n/d n/d n/d n/d n/d n/d n/d n/d 11185 3963 15726
Legend: n/d (no data), not applicable (n/a)
Sources (not exhaustive): Innovation lists: Mensch (1979), Haustein and Neuwirth (1982), Van Duijn (1983), Silverberg and Verspagen (2003). Steam stationary: Von Tunzelmann (1978), Kanefsky and Robey (1980), Kanefsky (1979). Steamships: U.S. Census Office (1978); Nakicenovic (1984). Steam locomotives: Mitchell (1992). Bicycles: Perry (1995). Wind: Gipe (1995), Danish Energy Agency (2012). Power-Coal: Termuehlen and Emsperger (2003). Motorcycles: Wezel (2002). Cars: Abernathy and Clark (1985), Abernathy et al (1983), Argyres et al. (2011). E-Bikes: Weinert (2007). Power-Natural Gas: Mowery and Rosenberg (1989). Washing machines: Maxwell (2009). CFLs: IEA (2006). FCC refineries: Enos (1962). Jet Aircraft: Mowery and Rosenberg (1989), U.S. Department of Transportation (1960). Power-Nuclear: IAEA
Appendix C. End of formative phase: Data synthesis
Formative Phase
INDICATOR UNITS STATIONARY
STEAM ENGINES STEAMSHIPS STEAM LOCOMOTIVES BICYCLES WIND POWER COAL POWER
MOTORCYCLES CARS E-BIKES NATURAL GAS POWER WASHING MACHINES CFLs FLUID CATALYTIC CRACKING (in refineries) JET AIRCRAFT NUCLEAR POWER MOBILE PHONES Ex Post END POINTS Fraction of full technology lifecycle Year of 10%K (cumul.#) 1870 1880 1880 1922 1985 1938 1949 1937 2005 1968 1951 1994 n/d 1969 1966 2001 Year of 10%K (cumul.MW) 1880 1890 1900 1922 1991 1957 1956 1955 2005 1976 1962 1994 1945 1971 1973 2001 Up-scaling of unit size
Year of 10% K (max. unit capacity) 1748 n/d n/d n/d 1999 1928 n/d n/d n/d 1943 n/d n/d n/d 1958 1960 n/d
Ex Ante END POINTS
Market structure
Year of peak in number of firms 1869 n/d n/d n/d n/d n/d 1921 1908 n/d n/d n/d n/d n/d 1973 n/d n/d
Year of "shakeout" (N falls -30% from the peak)
n/d n/d n/d n/d n/d n/d 1924 1914 n/d n/d n/d n/d n/d 1979 n/d n/d
Year of min. market concentration ratio (CR4)
n/d n/d n/d n/d n/d n/d n/d 1911 n/d n/d n/d n/d n/d n/d n/d n/d
Cost reduction
Year of first 50% reduction in cost n/a n/d 1855 1897 n/a n/a n/d n/a n/a n/a n/d n/a n/d n/d n/a n/d
Year of max. % cost reduction 1727 n/d 1855 1897 2002 n/d n/d 1924 2000 n/d n/d n/d n/d n/d n/d n/d
% (max. cost reduction) 30% n/d 85% 63% 15% n/d n/d 25% 22% n/d n/d n/d n/d n/d n/d n/d
Description (model, mass prod.) Newcomen n/d 4-4-0 Safety
bike Danish model Conventional coal PP n/d Ford Model T
mass prod. Conventional
gas PP
n/d n/d n/d n/d PWR n/d
User adoption
Year of 2.5% potential market 1802 1830 1846 1886 1992 1917 1921 1911 2005 1928 1923 2000 n/d 1959 1967 1993
Additional Indicators
Patent application
Year of first peak n/d n/d n/d n/d 1980 n/d n/d 1897 n/d n/d n/d n/d n/d n/d n/d n/d
Year of start of 2nd wave of increase
n/d n/d n/d n/d 1996 n/d n/d 1914 n/d n/d n/d n/d n/d n/d n/d n/d
Production scale up
Year of 10-fold increase in production
n/a 1820 n/a 1862 n/a n/a n/a n/a n/a n/a n/a n/a n/a no/n.a. n/a n/a
Year of highest growth 1720 1820 1850 1862 1978 1938 1901 1946 1998 1945 1921 1991 1956 1959 1993 1980
% 838% 3417% 560% 7000% 450% 267% 194% 328% 263% 275% 132% 42% 7% 863% 700% 33%
Dominant design
Year 1764 1807 1829 1884 1957 1920 1901 1909 1946 1939 1937 1985 1942 1958 1970 1973
Model Watt engine Fulton's
Clermont Stephenson's Rocket Safety bike Gedser wind turbine Pulverized coal system "diamond frame" Ford T Tucker's Wheel motor unit BBC Velow plant Bendix automatic wash.mach. Electronic ballast Fluid Catalytic cracking B707/DC-8 LWR (PWR) Cooper's portable handset User adoption
Lead user? (Yes/No) No No Yes No No No No No No No No No No No Yes No
Up-scaling of unit size
Year of 10% K (avg. unit capacity) 1730 1830s 1840 n/d 1990 1926 1941 1918 1990s (late) 1906 1943 n/d 1942 <1958 1961 n/d
Notes: n/d = no data, n/a = not applicable Sources: see Appendix B