A MULTIMODAL TRANSPORTATION NETWORK
BETWEEN CHINA AND EUROPE
Mariana Brás de Moura Duarte Miranda
Thesis Dissertation submitted as a partial requirement to obtain the Master of Services and Technologies Management Degree
Advisor:
Professora Doutora Ana Catarina de Carvalho Nunes, Prof. Auxiliar, ISCTE Business School, Departamento de Métodos Quantitativos para Gestão e Economia
Co-Advisor:
Professora Anabela Ribeiro Dias da Costa, Prof. Auxiliar, ISCTE Business School, Departamento de Métodos Quantitativos para Gestão e Economia
“Lombada” A M U L T IM O D A L T RA N S P O RT A T IO N N E T W O R K BE T W E E N CH IN A A N D E U RO P E M a ri a n a Brá s d e M o u ra D u a rt e M ira n d a
A MULTIMODAL TRANSPORTATION NETWORK
BETWEEN CHINA AND EUROPE
Mariana Brás de Moura Duarte Miranda
Thesis Dissertation submitted as a partial requirement to obtain the Master of Services and Technologies Management Degree
Advisor:
Professora Doutora Ana Catarina de Carvalho Nunes, Prof. Auxiliar, ISCTE Business School, Departamento de Métodos Quantitativos para Gestão e Economia
Co-Advisor:
Professora Anabela Ribeiro Dias da Costa, Prof. Auxiliar, ISCTE Business School, Departamento de Métodos Quantitativos para Gestão e Economia
i
Acknowledgements
I would like to thank my professors Prof. Dra. Ana Catarina de Carvalho Nunes and Prof. Anabela Ribeiro Dias da Costa for all the support and knowledge shared throughout the development of this master thesis. Also for the patience and the continuous mentoring that led me into the right path.
To my dear sister Inês for the motivation and help during the past year and for pushing me to think outside the box.
To my parents for always teaching me how to overcome my boundaries and to fight for what I want.
ii
Abstract
Organizations and the markets where they act upon are in constant change, therefore, companies have to innovate and adapt to what the market demands, otherwise they will become obsolete and lose their place. Constant innovation and improvement are a must in any business.
The present investigation is based on multimodal network transportation, where document analysis is conducted and a research is made concerning transportation connections, modes of transportation, duration, costs, and potential departure and arrival cities.
A multimodal network between Chongqing and London is constructed based on the information found within other freight forwarders. To design this network, the methodology used is based on a time-expanded model.
The research and results show that based on a thorough research, it is possible to find information on multimodal networks in order to create one. Based on the time-expanded model methodology, the network will be created using information from some articles and also based on some assumptions. Furthermore, feasible solutions are represented within each given lead time, allowing the network to represent several possible connections to go from the origin to the destination during this time. From here, it is possible to determine the most efficient path.
This thesis delivers a robust network, with a wide range of important information on costs, durations and weekly frequency on the different modes of transportation. The network methodology allows it to be adjusted to other case, it is flexible, and can be more complex.
iv
Resumo
As empresas e os mercados nas quais estas se inserem estão em constante mudança, e, devido a isto, as empresas têm de inovar e de se adaptar às exigências do mercado, ou de outra forma irão tornar-se obsoletas. A inovação e melhoria constante são essenciais em qualquer negócio.
A presente investigação baseia-se numa rede de transporte multimodal onde uma parte crucial passa pela procura de informação relativamente a rotas de transporte, modos de transporte, duração, custos e cidades potenciais como nodos de partida e chegada. Uma rede multimodal entre Chongqing e Londres será construída com base na informação recolhida. Para desenhar esta rede, a metodologia usada tem como base o
time-expanded models.
Os resultados demonstram que com base numa pesquisa minuciosa, é possível encontrar informação relativa a redes multimodais de forma a ser possível criar uma. Com base no modelo time-expanded a rede será construída, usando informação não só de artigos, mas também de pressupostos necessários de criar. Além disto, a rede desenvolvida representará soluções admissíveis dado um certo lead time, permitindo que a rede representada tenha várias possíveis conexões desde a origem até ao destino. A partir deste leque de conexões, será possível determinar o percurso mais eficiente.
Esta tese apresenta uma rede bastante completa, com informação relevante relativa a custos, durações e frequências semanais dos diferentes modos de transporte. A metodologia utilizada para criar a rede permite que esta seja ajustada para ser utilizada noutros casos, pois esta é bastante flexível.
vi
Index
Acknowledgements ... i Abstract ... ii Resumo ... iv Index... vi 1. Introduction ... 1 1.1 Contextualization ... 2 1.2 Objectives ... 31.3 Relevance of the study ... 4
1.4 Methodology ... 4
1.5 Project Structure ... 5
2. Literature Review ... 7
2.1 Supply Chain Management ... 7
2.2 Freight Transportation ... 8
2.3 Multimodal Transportation... 8
2.4 Similar Studies ... 9
2.5 China’s Flows Routes ... 11
2.5.1 Belt and Road Initiative ... 11
2.5.2 The Yangtze River ... 13
2.6 Time-Dependent Method... 13
3. Research ... 15
3.1 Introduction ... 15
3.2 Origin and Destination ... 15
3.2.1 Chongqing Port ... 15
3.2.2 Shanghai Port ... 16
3.2.3 Shenzhen – Yantian Port ... 17
3.2.4 Rotterdam Port... 17
3.2.5 Duisburg ... 17
3.2.6 London Port ... 18
4. Network Construction Methodology ... 19
4.1 Methodology ... 19
4.2 Network Information ... 21
4.3 Explanatory Network ... 25
4.3.1 Network Construction ... 26
4.3.2 Example Network ... 29
vii
4.3.4 Example 2: Lead Time (Same Connection)... 32
4.3.5 Example 3: Shortest-Path... 33
4.3.6 Example 4: Lead Time (different connections) ... 34
4.3.7 Example 5: Cheapest Connection... 35
4.4 Schedules Methodology ... 36
4.5 Specific Cases on the Chongqing-London Network... 37
4.5.1 Cheapest Connection ... 38
4.5.2 Most Expensive Connection ... 38
4.5.3 Shortest Connection ... 39
4.6 Process Explanation ... 40
5. Freight Orders ... 43
5.1 Lead Time 15 days ... 43
5.2 Shortest Lead Time Possible – 7 Days ... 43
6. Conclusions ... 47 6.1 Main Conclusions ... 47 6.2 Limitations... 48 6.3 Future Research ... 49 7. Bibliography ... 51 8. Appendix ... 57
Appendix A. Connection 1 From the Paper... 57
Appendix B. Connection 2 From the Paper ... 57
Appendix C. Connection 3 From the Paper ... 58
Appendix D. Connection 4 From the Paper... 58
Appendix E. Connection 5 From the Paper ... 58
Appendix F. Connection 6 From the Paper ... 59
Appendix G. Connection 7 From the Paper... 59
Appendix H. Connections between Chongqing and London ... 60
Appendix I. Information to Build the Optimal Solution - Connections ... 61
Appendix J. Information to Build the Optimal Solution - Dimensions ... 61
Appendix K. Information to Build the Optimal Solution - Locations ... 62
Appendix L. Information to Build the Optimal Solution – Modes of Transport ... 62
Appendix M. Information to Build the Optimal Solution – Shortest Duration ... 62
Appendix N. Decision-Support Tool Results For a 15 Days Lead Time ... 63
viii
Index of figures
Figure 1. Belt and Road Initiative Routes ... 2
Figure 2. Imports, Exports and Trade Balance in Goods Between the European Union (EU) and China ... 4
Figure 3. The Yangtze River and the 40 Cities Along ... 13
Figure 4. Time-Dependent Model Graph. ... 14
Figure 5. Container Throughput Growth at Shanghai Port Between 1990 and 2000 ... 16
Figure 6. Top 10 Major Ports by Tonnage ... 18
Figure 7. Time-Expanded Model Graph ... 19
Figure 8. Simple Time-Expanded Model ... 20
Figure 9. Realistic Time-Expanded Model... 20
Figure 10. Multimodal Network between Chongqing and London and its Durations.... 24
Figure 11. Network Example ... 25
Figure 12. Network Nodes ... 27
Figure 13. Example of Node A Connections, Arrivals and Departures ... 28
Figure 14. Connections A-B-D Trough Sea and Road ... 31
Figure 15. Connections A-C-D Through Air ... 31
Figure 16. Connections A-B-C Through Sea and Road ... 32
Figure 17. Shortest Path Routes ... 34
Figure 18. Solutions for 11 Days Lead Time ... 34
Figure 19. Route A-B-D Through Sea ... 35
Figure 20. Connections C-A-R-L Through Sea ... 38
Figure 21. Connections C-R-L Through Air ... 38
Figure 22. Connections C-R-L Through Air and Sea ... 39
Figure 23. Connections C-R-L Through Air and Road ... 39
Figure 24. Solution for 15 Days Lead Time ... 43
Figure 25. Shortest and Cheapest Route ... 44
Figure 26. Simplified Network between Chongqing and London ... 44
ix
Index of Tables
Table 1. Information on Chongqing-London Network ... 22 Table 2. Example Network with Schedule, Duration, Costs and Weekly Frequency .... 26
x
Abbreviations
EU – European Union
TEU – Twenty-foot Equivalent Unit UK – United Kingdom
UNCTAD – United Nations Conference on Trade and Development VBA - Visual Basic for Applications
1
1. Introduction
This work will be focused on the construction of a multimodal network between China and Europe. This development will be based on the information found on multimodal transport and on the construction of a multimodal network, considering four types of transportation: road, rail, air, sea. Multimodal transportation implies the use of two or more transportation means, to carry goods, from an origin to a destination point (UNCTAD, 1981). It is also the most efficient method for international transport as it leads to cost optimization, and supply chain efficiency (Harris et al., 2015). Multimodal transport is also defined as a “multiple fixed scheduled transport services” (Dib et al., 2017).
However, when it comes to choosing the ideal mode/modes of transport to deliver a service, the client has a set of factors that will influence this choice. Amongst them, cost, transport quality, reliability and transport time are considered to be the most valuable (Flodén et al., 2017).
In this study, several multimodal modes will be considered as well as their costs and duration, taking into account the buyers need on having the best service delivered, with an optimized cost and within the expected days. Although most of the studies found have examples of multimodal transportation routes and consider costs and distances between locations, they do not consider the dilemma developed in this thesis, that is to represent the different existent solutions within a given lead time, and from there, the most economical transportation solution is chosen. Cost, speed, reliability and flexibility success regarding the delivery of goods will define the customer satisfaction (UNCTAD, 2003).
What differentiates the literature found from the network developed in this thesis, is that the network constructed will be based on a multimodal transportation network, considering the cost of the different modes of transportation, the schedules and limitations of each one, and the time windows regarding deliveries. The most important difference here, is that the solution will depend on the lead time given.
Using the construction methodology of the network it is possible to represent all possible paths within an established lead time and amongst these options, the most economical one will be selected. The network itself and the data within, locations, modes
2 used and connections, are also important information, as these are the baseline of each network delivered.
To make a more concrete analysis, this thesis will focus on the different means of transportation that exist between China and Europe and all its limitations, from timetables to delivery due dates and the best type of transportation options.
This theme was proposed by Wide Scope, a routing and scheduling Portuguese company that through Mathematics, Artificial Intelligence and Information Technologies finds a way to meet a market gap by optimizing supply chains. Its purpose is to create optimized routes and to determine schedules that deliver before due date by optimizing production (Wide Scope, 2012).
1.1 Contextualization
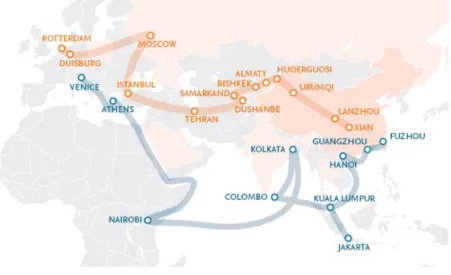
In 2013 China’s President, Xi JinPing, announced he wanted to bring back the silk routes, by building the Silk Road Economic Belt and the 21st Century Maritime Silk Road, known as the Belt and Road Initiative. However, to develop this initiative, China will face some problems, mainly due to the differences that exist between all the countries involved, such as the political regimes or the financial viability (Huang, 2016). In Figure 1, we can see the routes involved in the Initiative.
Figure 1. Belt and Road Initiative Routes
3 Furthermore, since China’s economic growth has been relying on exports and investments, in an attempt of sustaining and increasing it, China wants to develop its infrastructures (Huang, 2016).
1.2 Objectives
The purpose of this Thesis is to get to know and to understand the different types of transportation that link China to Europe and to create a multimodal transportation network concerning several requirements such as cost, schedules, lead times and transition times. In order to do so, information concerning the maritime, aerial, railway and road transportation is necessary, in particular, costs and timetables.
This is done firstly by gathering information concerning the connections between the different locations and its duration, cost, frequency and mode of transport, which leads to a research of scientific papers, and then on information found on shippers and logistic providers websites.
Secondly, a dynamic network based on this information will be created with one origin, Chongqing, and one final destination, London. This network will represent the different options existent between these two locations, taking into consideration a specific lead time and depending on the schedules of the different transportations modes that differ each day, optimizing the resources.
The main objectives of this thesis are:
- To discover information concerning the different transportation modes between China and Europe, such as duration, cost and weekly frequency. - To create a multimodal network based on the time-expanded model,
allowing to find feasible solutions for each given lead time, and from here to deliver the most affordable solution.
4
1.3 Relevance of the study
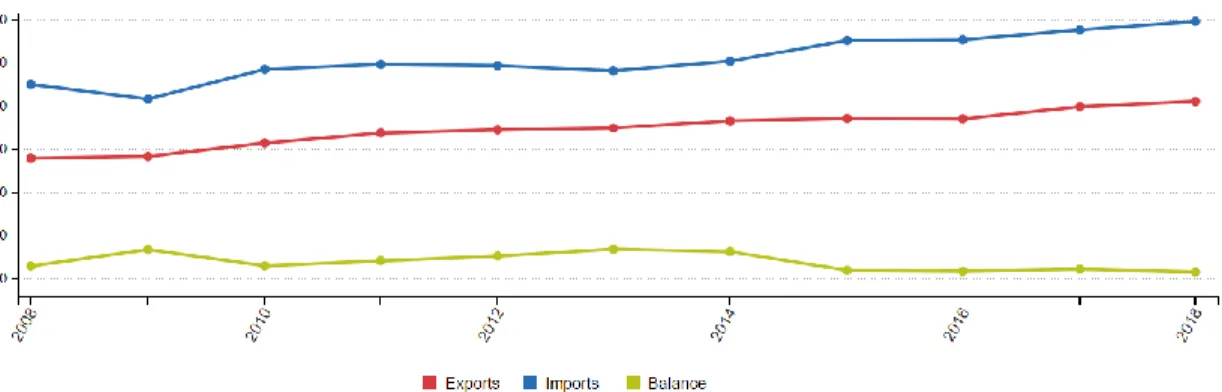
This study relevance concerns the locations involved in this network, which are wealthy, well-located and emerging cities. We can verify, in Figure 2, that between Europe and China the imports and exports have been growing.
Figure 2. Imports, Exports and Trade Balance in Goods Between the European Union (EU) and China
Source:Eurostat (2018)
In 2004, China was considered to be the second trade partner of EU25, and in 2017 the largest partner for EU imports (Eurostat, 2018). China is one of the greatest exporters worldwide, being one of the main countries of Portugal imports, with a preliminary value of 2350,2 million euros (PORDATA, 2019).
On the other hand, there is Rotterdam, considered the busiest port for goods handling in 2012 and is amongst the top ten EU28 cargo ports when considering tonnes of goods handled (Eurostat, 2014). At last, London is one of the main ports when it comes to volume of containers transported (Eurostat, 2019).
1.4 Methodology
The method used to complete this thesis, was a thorough and deep research on the theme in order to find the needed information to develop the network, since the objective is not only to create the network, but also the search that precedes it. From this data research, the network will be built.
5 This thesis presents the construction of a network that allows to shape a given situation, in this case, to achieve feasible solutions, within a network, by guaranteeing the lead time given. This inserts the methodology used in the Design Research category, which uses building and evaluating activities. Design Research is characterized by “a
process of using knowledge to design and create useful artefacts, and then using various rigorous methods to analyse why, or why not, a particular artefact is effective” (Manson,
2006). These artefacts created within this methodology can be physical or abstract, such as models and methods, being built using theory and designed to achieve a goal (Manson, 2006).
The guidelines used in Design Research have several definitions, one of them being the artefact, that for this thesis is the network construction and the methodology used within. This thesis contribution will be the methodology used to create the network, being able to be replicated and used in other cases. The research rigour concerns the comparison between the work developed in this thesis and several papers found on the literature that portray similar cases, but on the research made, none fully follows what is developed here.
For this thesis, the research questions are: Is there at least one path to perform the delivery within the needed time? What is the most efficient path to perform a delivery?
1.5 Project Structure
Chapter 1: Introduction – This Chapter presents the contextualization and the need of
developing the network and specifies the objectives of this thesis, explaining what should be achieved.
Chapter 2: Literature Review – This Chapter is based on the theoretical approach and
literature review on which this project is based on, and that will sustain it.
Chapter 3: Research– In this Chapter, information concerning the locations in this
network will be explored, in order to understand their advantages within the different connections.
6
Chapter 4: Network Construction Methodology – This Chapter explains the method
used to build the foundation of the network. It also demonstrates how the network was built and gives several examples of specificities within the network construction.
Chapter 5: Freight Orders – In this Chapter, examples concerning the network orders
will be considered to verify the utility and network performance.
Chapter 6: Conclusions – This Chapter will present the final conclusions of this study,
7
2. Literature Review
This Chapter will consider the state of the art of multimodal transportation and the several issues included, such as supply chain management and several case studies that were performed on multimodal networks, explaining the differences between each one of them and highlighting the variables developed in this study case, making it innovative comparing to the others.
2.1 Supply Chain Management
A Supply Chain can be described as a group of independent companies that are involved in the flow of sharing information, and the transformation of products/services from the supplier to the end customer (Simatupang & Sridharan, 2002). It is also characterized as a set of links between the upstream and downstream activities, including products, services and finances (Mentzer et al., 2001). Consequently, it is important to have an efficient and effective supply chain, and in order to do so, collaboration between the supply chain members is essential. This happens when two or more independent companies work together in order to execute supply chain operations with a higher success then if acting on their own (Simatupang & Sridharan, 2002). This means companies will not only share benefits but also the risks associated to it.
An important concept that must also be explored in this Thesis is Supply Chain Management, that can be defined as a combination of a company main business processes, from the supplier that provides final products or services, the point-of-origin, to the end customer, point-of-consumption, and the information that adds value for customers (Lambert & Cooper, 1998). It can also be described as “a network of materials,
information and services processing links with the characteristics of supply, transformation and demand” (Chen & Paulraj, 2004). Supply Chain Management seizes
the synergy between companies and within every company, managing relations between every member of a supply chain. Furthermore, its aim is to reduce costs and increase sales, improving communication between all supply chain members (Sitek & Wikarek, 2012).
8 It can be verified that all these definitions are similar, completing and supporting each other. These concepts must be taken into account because the theme to be developed concerns an important area of a supply chain, transportation, the path it takes a final product or a raw material to go from the supplier to its client.
2.2 Freight Transportation
Freight Transportation is a crucial theme when it comes to Supply Chain and Multimodal Transportation. It comes down to the existing modes of transportation, duration of transport, frequency and costs when a company is trying to decide which should be the shipper or logistic provider to choose. Logistic providers deliver freight transportation, cargo handling, storage and warehousing, as well as customs clearance, amongst others (UNCTAD, 2003). On the other hand, there are also some external factors that influence the transport itself but cannot be predicted in advance, such as weather condition, congestion and risk (Kim et al., 2017).
Freight transportation ensures the efficient movement of goods and materials, and that they arrive at their destination within the needed lead time, assuring the client has what he wants when he needs it (Crainic, 2003). The need for the existence of freight transportation comes from the geographical disparity between producers and consumers (Steadie Seifi et al., 2014)
2.3 Multimodal Transportation
Multimodal Transportation is an important concept when it comes to the necessity of moving cargo from the point of origin until the final consumer, as the supplier and the consumer are not always in the same geographical area. In addition, when taking a delivery from one place to another, it will hardily reach the customer door by only using one mean of transport, since e.g., airplanes and ships cannot go any further than the airport or the port.
Multimodal Transportation is the use of two or more modes of transportation, where the unit of transportation can be a box, a container, a swap body, a road/rail vehicle
9 or a vessel (Steadie Seifi et al., 2014). On the other hand, in the European Conference of Ministers of Transport, multimodal transportation was considered to be the integration of two or more modes of transport, to move both passengers and goods from an initial to an end point, using air, rail, truck or ocean lines transports (ECMT, 1968). This type of transportation is very useful because is more flexible, more cost efficient and sustainable, offering lower costs per unit load. Furthermore, full loads over long distances in multimodal transportation will have more attractive costs, once lower costs per unit load are offered (Islam et al., 2005).
Another modality that is related with multimodal transport is intermodal transportation that is a particular type of multimodal transportation. Intermodal transportation may also be defined as a sequence of at least two modes of transport, however, this transportation is only with containers, maintaining a single transportation at a time (Crainic & Kim, 2006).
2.4 Similar Studies
In this literature, already several studies have been conducted. The ones found for this literature show the progress made in this area, highlighting the differences between them. However, during this research, no literature was found concerning the exact method and network developed for this thesis.
Beresford (1999) developed a cost model study for multimodal transport concerning a corridor between the United Kingdom (UK) and Greece. It takes into account cost, time, distance, transport mode and intermodal transfer, enabling several multimodal combinations to be examined and compared from the logistics scheduling, customer requirements, capacity provision, costs and operational efficiency perspective. The data from this study is reliable since it was provided by customers and service providers. However, this study identifies the most optimum solution and the cheapest modes not taking into account lead time.
As verified in other studies, for this cost model, also road is considered to be the one with higher reliability although expensive. The sea route is the slowest, but cheap, and intermodal route is taken as fast and price-competitive but complex and with a higher perceived risk. An advantage of this study is that any route can be considered, and various
10 modes compared, in order to understand when a transportation mode becomes more competitive than other (Beresford, 1999).
Banomyong and Beresford (2001) presented a cost modal on multimodal transportation applied to a real case exportation between Lao People’s Democratic Republic and Rotterdam Port, with the information coming from the exporters, importers, logistic service provider, port authorities, amongst others. The purpose of this study is to find the most efficient route with the best cost, assuming that the unit cost varies from mode to mode and that for high volumes, the sea mode will be the cheapest and road mode will be the most expensive. In addition to other studies, a confidence index is represented by four elements: the decision maker, the alternative courses of action, meaning different routes, the events, that are external and cannot be controlled by the decision maker, and the consequences, that result from a decision depending on the decision maker and the event (Banomyong & Beresford, 2001).
On the other hand, the route selection for auto-parts between Korea and Alabama/Georgia has also been studied through an empirical analysis of transport mode and routeing choices, considering both transport and inventory costs. In this study, inventory costs were not overlooked and also transport cost per unit and transit time were studied, and it turns out that for management, these can have a huge impact in total annual cost for each route, being able to lead to different route choices (Woo et al., 2018).
Pham and Yeo (2018) evaluated the door-to-door electronic goods transport routes from Shenzhen to Hai Phong from logistics service providers and shippers’ point of view. This study objective is to assess on the competitiveness of transport routes by examining decision-making process, taking into account factors like costs, time, reliability and transportation mode capability. This literature adds the use of Delphi method and Consistent Fuzzy Preference Relation method as a way to study the hierarchy of factors and sub-factors that directly affect participants choice on route selection and to evaluate these factors.
Another study concerning the transportation of beverages between Thailand and neighbouring countries was conducted, assessing optimal cost, time and risk for multimodal transportation. The innovation in this study concerns the type of risks assessed: risk of freight damaged, risk of infrastructure and equipment, operational risk
11 and risk of other factors, in particular, external factors such as political risk, financial crisis, amongst others (Kaewfak & Ammarapala, 2018)
A study concerning the laptop transportation between Chongqing (China) and Rotterdam was carried out, adopting the multimodal model. Based on real information given by manufacturers, third logistics service providers and freight forwarders, seven routes were constructed, taking into account transit times, transport cost and confidence indexes on each route (see Appendix A to G). This study will be used as a starting point and basis for this thesis, since it creates a multimodal network between China and Europe exploring the numerous variables that influence the selection of a specific route, depending on the needs (Seo et al., 2017).
2.5 China’s Flows Routes
2.5.1 Belt and Road Initiative
China’s economy stagnated in the last years, so in an attempt of continuing its economic growth, the development of the Belt and Road Initiative was initiated (Huang, 2016).
In 2013, the Chinese President Xi Jinping announced the development of a Silk Road Economic Belt and a 21st Maritime Silk Road which will help China by exploring new ways of international economic cooperation with new partners, promoting regional economic development and leading to a win-win situation with other parties (Huang, 2016). Furthermore, according to Huang (2016), China wants to expand their international influence, and by being one of the major global powers, they want to contribute and be part of the development of the global economic system. This Initiative is going to be developed as a major investment in infrastructures, as a way to connect China borders with its neighbours and to create a direct route to Europe through Central Asia (Cai, 2017)
The Belt and Road Initiative objective is to foster the regional economic development by sharing a positive relation with the other countries involved. Also, for China, the main advantage is to create new markets, diversifying its exports (Sun & Hou, 2019)
12 However, the Belt and Road Initiative also carries some risks that will determine the future of it. First of all, there is a lack of a central coordination mechanism, which will make it difficult to have the same standards of procedure and effectiveness in all countries implicated (Huang, 2016). Secondly, the Initiative will affect around 60 countries, which means they will be facing several difficulties while working towards a same objective. These difficulties concern political regimes and beliefs, economic systems and lack of trust (Huang, 2016). Another problem concerns China excess capacity, because they intend to use the excess of steel, cement and pleat glass by moving company’s excess production to the countries that will take part in the Initiative and that need to build infrastructures (Cai, 2017). This might not suit Belt and Road countries, once it might not be politically acceptable by them, which may create some conflicts. At last, the financial viability of this project cross-border is also an issue, because within its barriers, China can easily start to develop the Initiative, but other countries might not have the same will or funds (Huang, 2016; Cai, 2017).
Belt and Road Initiative is divided into road and maritime routes, where there are three general routes for the Silk Road Economic Belt. According to Huang (2016), the first one is from China through Central Asia and Russia to Europe, then the second starts in China and goes through Central and West Asia to the Persian Gulf and the Mediterranean, and the last one goes from China to the Indian Ocean. On the other hand, the 21st Maritime Silk Road runs from China’s coastal ports, through the South China Sea, into the Indian Ocean, reaching Africa and Europe and also to the Pacific Ocean (Huang, 2016).
China’s infrastructures have been a problem for a while now, leading to the existence of bottlenecks and transportation overload, all due to lack of investment. Furthermore, inland waterways from Yangtze River have a huge importance worldwide but are also being undermined (Beresford et al., 2011). This will help not only to expand the current routes, but also to broaden new opportunities, and to keep up with a trend that will only keep growing, as exportations and importations will always be an important aspect of every country economy and needs.
13
2.5.2 The Yangtze River
China is considered one of the most important economies worldwide, and its role on transportation and supply chain is also increasing. Firstly, only coastal regions were used in supply chain, but nowadays, inland destinations are starting to urge and to gain importance in supply chain (Notteboom, 2012).
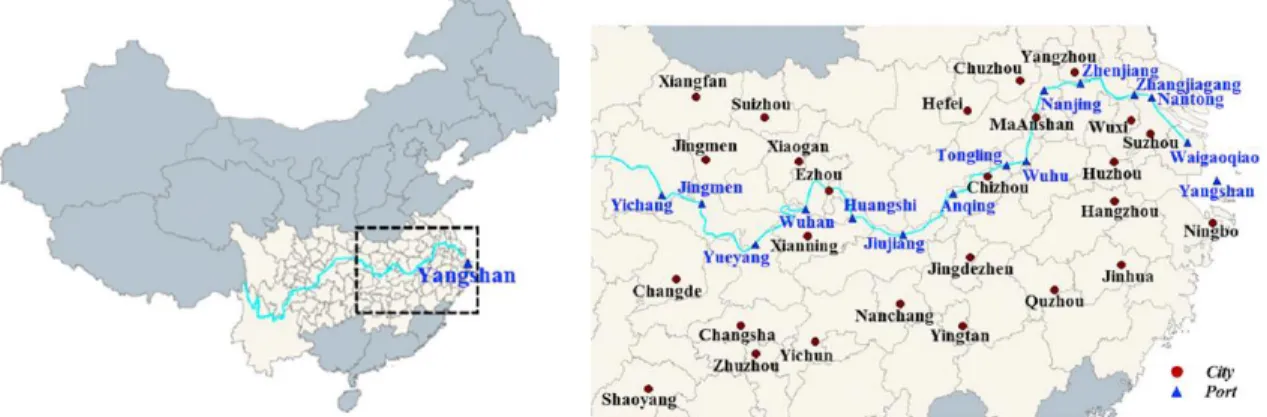
The Yangtze River works as an important hinterland channel when it comes to moving cargo within China. This area is one of the main growth regions along China, including more than 40 cities (Zhao et al., 2019). Figure 3 shows the area and cities involved by the Yangtze River.
Figure 3. The Yangtze River and the 40 Cities Along Source: Zhao et al., (2019)
Yangtze is part of China’s economic belt, starting to become a high-tech base in China, having also good flows to transfer goods to Europe (Notteboom, 2012). These flows are river-sea or land-sea combined, with the ability of moving containers (Zhao et al., 2019). Its 6300km length makes it the third longest river in the world, holding more than 80 ports within it (Notteboom, 2012).
2.6 Time-Dependent Method
Concerning routing planning and shortest path problems, there are two types of time models that can be considered: time-dependent models and time-expanded models.
14 Both of them have advantages and disadvantages considering the network that was constructed here. Considering these two methods, the literature found concerns shortest-path problems, meaning these models were made and developed according to that. However, it is important to state that for the network here created, the final objective is to find the most efficient solution, set of connections, taking into account its cost. The options shown will depend on the lead time of each freight order, but the most efficient solution is based on cost and so is the objective function.
Considering time-dependent models, there are two versions: the simple and the realistic model. These models are characterized by having only one node per station and an edge between stations in case there is a connection between them, as seen in Figure 4 (Muller-Hannemann et al., 2004). The main difference between both versions, is that simple model does not represent or takes into account realistic transfer time, whereas the realistic model does, represented by an additional node in the graph.
Figure 4. Time-Dependent Model Graph. Source: Muller-Hannemann et al (2007)
15
3. Research
This Chapter concerns the research made in order to highlight the different locations main advantages, specifying the importance the location has in its country.
3.1 Introduction
China is betting increasingly in the development of its transport infrastructures. Between 2001 and 2009 the length of highways increased from 191000 km to 651000 km in regions like the Yangtze River Delta, the Pearl River Delta, and Beijing-Tianjin-Tangshan (Hou & Li, 2011).
A port prosperity is related to the economy well-being of the hinterland and overseas regions they are connected to through sea (Pettit & Beresford, 2008). Chongqing and London ports were the ones used as origin and destination points. The intermediate locations, Shanghai, Shenzhen, Duisburg and Rotterdam will also be taken into consideration.
3.2 Origin and Destination
3.2.1 Chongqing Port
Chongqing is a port with much potential due to is location in the river Yangtze corridor, which is the infrastructure to many western provinces. Furthermore, it is the main economic centre on the upper stretch of the river. On account of its natural gas reserve, it attracts a lot of chemical industry, where the automotive industry holds the highest percentage. Chongqing is also attracting more investments from coastal enterprises, that are starting to prefer inland cities, due to its higher land availability, lower labour costs and proximity to Chinese manufacturers and raw material (Notteboom, 2012).
Additionally, according to Seo et al., (2017), Chongqing is rising its economy, also due to the fact of being one of the most important omnibus traffic hub regions, and because of its IT industry development. The railway and airline growth and the “One Belt
16 One Road” Initiative are crucial factors as well when it comes to achieving competitive advantage. The road-ocean mode of transportation is the mostly used in China (Seo et al., 2017).
Using Chongqing port is not the most obvious choice when it comes to transportation options and times costs comparing to Shanghai. However, in a long term, lower production costs and higher efficiency of the barging industry will make it a viable option and a preference (Notteboom, 2012).
3.2.2 Shanghai Port
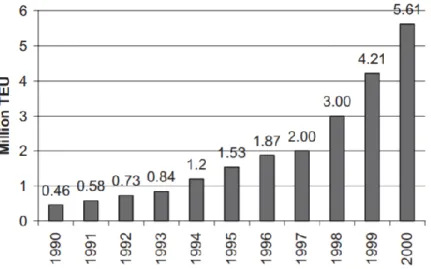
The city of Shanghai has been the most important sea port since the conclusion of the nineteenth century, having hinterland connections with the Yangtze River and playing a role in the domestic and international economy. It took only six years for the Shanghai Port to grow from one to five million Twenty-foot Equivalent Units (TEUs) as reflected in Figure 5 (Wang & Slack, 2006).
Figure 5. Container Throughput Growth at Shanghai Port Between 1990 and 2000 Source: Wang & Slack (2006)
It is considered one of the main industrial centres in China and has been developing its infrastructures throughout time, by increasing berth, cranes and trucks space for example (Li & Oh, 2010).
17
3.2.3 Shenzhen – Yantian Port
Yantian is one of the main economic centres in China, having handled about 1.59 million TEUs in 1999 and offering new shipping lines to South China markets (Song, 2002). One of the main advantages of this port, is its natural deep-water channel of 14 meters, furthermore it is connected to the China railway System, being able to reach any other container port within the Pearl River Delta (Loo & Hook, 2002).
3.2.4 Rotterdam Port
Water way is considered to be the cheapest way of transport considering high-density cargo, and when it comes to Europe, Rotterdam Port is the most important port. It acts as a gateway and a transit point for bulk materials not only inside Europe, but also abroad. Until 2004, Rotterdam port was the world busiest port, and one of its main advantage is its depth, 22 meters, being accessible to most vessels (Shi & Xing, 2015).
Rotterdam port is also lucky due to its location, in the estuary of the Rhine and Meuse rivers, with inland ports in Germany, Belgium, France, Switzerland and Austria (Kotowska et al., 2018). This makes Rotterdam hinterland connections by rail and inland shipping really rich.
3.2.5 Duisburg
Through the Belt and Road Initiative, there is a direct railway connection between Chongqing and Duisburg, highlighting the importance of this connection for the present network. Its main advantage is the reduced transportation time due to the efficient customs dispatch system along the railway. This makes Duisburg a distribution center between Europe and China having around 300 logistic-oriented companies within its port (Li et al., 2018).
18
3.2.6 London Port
The UK is considered to be one of the largest port system in the world and the second largest in Europe, with more than 100 ports. In 2012, London Port was considered to be the second major port in terms of volume in the UK. This port has a total of 70 terminals, and due to its location by the River Thames, it has a network with 80 countries (Asgari et al., 2015).
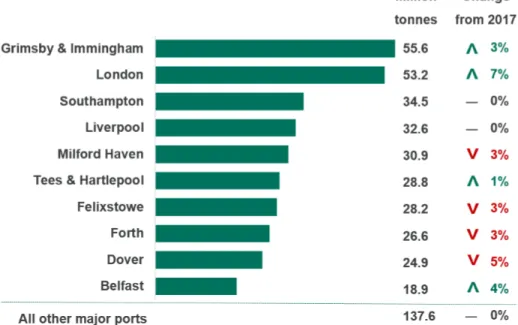
The UK has a great importance amongst the EU as in 2018 the goods transferred between UK ports and the EU were more than in any other region (Dell, 2018). Figure 6 shows the 10 major ports within UK and the tonnes of cargo that passed each one of them in 2018.
Figure 6. Top 10 Major Ports by Tonnage Source: Mohan Dell GOV.UK (2018)
19
4. Network Construction Methodology
In this Chapter we will present the methodology on which the network construction was based on, and the network construction itself, taking into account the several variables.
4.1 Methodology
The literature found on time methods, concerns the earliest arrival problem/shortest path query, existing the time-dependent model and time-expanded model. Once the objective of this thesis network is to find feasible solutions through controlling lead time needs, it will not be possible to use these methods entirely as a foundation for this network. However, it is possible to adapt it in order to represent and develop this network correctly as it will be based on the time-expanded model.
The time-expanded model states that every node represents a specific time event, departure or arrival. Furthermore, it has edges between the nodes, that represent the connections between the two events or the waiting time within stations, linking arrival and departure stations, as seen in Figure 7 (Muller-Hannemann et al., 2004).
Figure 7. Time-Expanded Model Graph Source: Muller-Hannemann et al (2007)
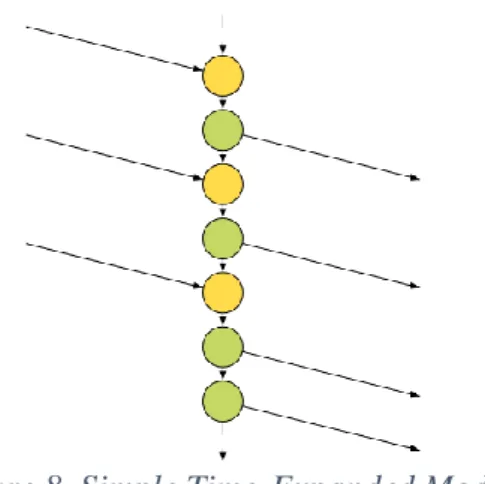
Within the time-expanded model, there is the simple and the realistic model. However, just like for time-dependent models, the simple model does not take into consideration the transfer time as demonstrated in Figure 8.
20
Figure 8. Simple Time-Expanded Model Source: Pajor (2009)
By contrast, the realistic model considers the transports schedules and the transfer times between means of transport, appearing as the purple circle in Figure 9 (Pajor, 2009).
Figure 9. Realistic Time-Expanded Model Source: Pajor (2009)
For the time-expanded model, the departures happen at a same time, every day. The model is then condensed and when reaching the last departure of a day, there is a connection arc that initiates the process all over. This works for shortest path queries, however, that is not what is being developed in this thesis and therefore it will not be totally used this way since the objective is to find feasible solutions through lead time
control, allowing to represent the different existing transportation options from an origin
to the destination.
Considering these two models, the one that better suits the construction of this multimodal network is the realistic time-expanded model. However, the network will not be an exact demonstration of this model as it has to be adapted, since it concerns
21 optimal cost solutions. The model adapted to build this network considers the different departure and arrival moments, which will vary depending on the modes’ schedules, and it will also include the transfer time it takes to move the goods from one mean of transport to the other.
Although, visually, in the realistic time-expanded mode, the transfer nodes exist, in the network built for this thesis, these will not be visible as a way of simplifying the network complexity. The network will still consider transfer time as this is critical for the accuracy and credibility of this network.
All this is essential for this study case, since the network built will take into account the transports schedules, the lead time, the transit time and the weekly frequency of each one of the connections for each transport, crucial for it to be as realistic as possible. Furthermore, this network assumes an acyclic base network of locations, meaning that the links do not have closed loops between them (Shevchuk & Snarskii, 2012) and have no cycle (Yeh, 2016).
The network developed in this thesis has six locations, and according to the model used, it will represent the different connections that exist, by mode of transport and by arrival/departure days based on different lead times. Then the most economic cost solution will be provided amongst the set of connections previously defined. The solution might be the same for different lead times, since the cost might be the same within a range.
4.2 Network Information
First of all, it is important to state that this network is only the baseline for the creation of a more complex and complete network, being capable of being adapted to other destinations and origins, keeping the methodology used.
As previously mentioned, this network will have its origin in Chongqing, China, and the destination in London, UK, going across Shanghai, Shenzhen, Duisburg and Rotterdam, which are the network six main locations. Four transportation modes were used: road, see, air and rail, creating sixteen connections between them, as shown in Table 1, based on the literature (Seo et al., 2017), on logistic providers websites (DHL, s.d.; HUPAC, s.d.; Kombiverkeher, s.d.; OCCL, s.d.) and on assumptions.
22
Table 1. Information on Chongqing-London Network Source: Based on Assumptions and Logistic Providers Websites
A connection is defined by a pair of arrival and departure events, the mode used to go from one to the other, its cost and duration.
From Table 1, we can verify the different connections that exist within the network, the different modes of transport possibilities that exist between two locations, the duration and cost of each connection and the weekly frequency.
We can verify that between Chongqing and Shanghai, there are three different options that can be undertaken: by sea, road or rail. Sea is the cheapest option and also the one that takes the longest time from origin to the destination. Comparing road and rail, its duration is almost the same, but road has a higher cost, mainly because it can leave the locations at any time, depending on the need, it has a daily frequency.
Connections Duration
(days)
Cost (USD)
Weekly Frequency
Chongqing – Sea – Shanghai 15 371 Twice a week (Mon/Thu) Chongqing – Road – Shanghai 12 1983 Daily
Chongqing – Rail – Shanghai 13 1165 Twice a week (Tue/Sat) Chongqing – Road – Shenzhen 11 1500 Daily
Chongqing – Rail – Shenzhen 9 1183 Tue/Sat
Chongqing – Air – Rotterdam 4 8930 Every Monday
Chongqing – Rail – Duisburg 20 3885 3 Times a week (Mon/Thu/Sat)
Shanghai – Sea – Rotterdam 39 1983 5 Times a week (Mon/Tue/Thu/Fri/Sat) Shenzhen – Sea - Rotterdam 33 1883 3 Times a week (Mon/Sat/Sun)
Duisburg – Road – Rotterdam 1 600 Daily
Duisburg – Rail – Rotterdam 1 552 5 Times a week (Mon/Tue/Wed/Thu/Fri) Duisburg – Rail – London 1 600 Every Monday
Duisburg – Road – London 1 630 Daily
Rotterdam – Sea – London 1 100 3 Times a week (Tue/Thu/Sat) Rotterdam – Road – London 1 600 Daily
23 On the other hand, between Chongqing and Shenzhen, there are only two options, by rail or by road, where road takes longer and is more expensive than rail. There is also a connection that takes the cargo from Chongqing to Rotterdam directly through air, but this is the most expensive option although the fastest. Another option goes from Chongqing to Duisburg by rail.
From Shanghai or Shenzhen, the cargo can only leave by sea, taking it about a month to reach its destination, Rotterdam. On the other hand, from Duisburg, the freight can leave either by rail or road to both Rotterdam and London, taking one day.
From Rotterdam, it can leave by sea, road or air, taking one day to reach London. The availability of the connections will always depend on the time-window in the first place, then, the cheapest connections amongst the feasible ones will be selected.
The sea mode is the slowest but also the cheapest, being the best option for transports with high lead times since it will reach the destination on time with the lowest cost possible.
On the other hand, since air is the fastest mode of transport, it will also be the most expensive. It is the best option when it comes to narrow time-windows.
Rail and road mode of transport are very similar, when it comes to time, although
rail is less expensive than road. When it comes to differentiate connections that take road or rail mode, the results are close to each other, but still distinct enough to choose one over the other when it comes to cost.
Along the construction of this network, several assumptions, needed to be made due to the difficulty of finding this information within freight companies. One of the most important, concerns the transfer time within a location, between its arrival and departure times. This means that between every arrival – departure within a same location, the transfer time will be one day, regardless the day the next transportation mode leaves the node. Figure 10 shows the network described and developed in this thesis, with all its locations and connections, and the different modes of transportation used to make it a multimodal network. In addition, it can be verified the different durations between the locations.
24
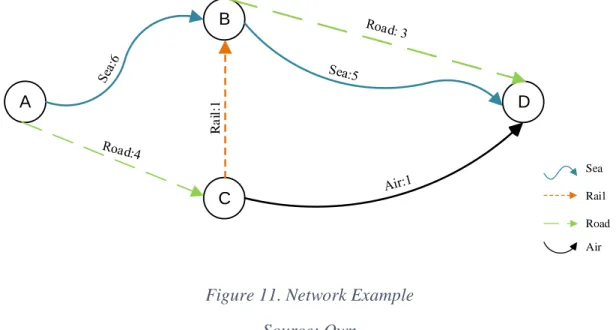
Figure 10. Multimodal Network between Chongqing and London and its Durations Source: Own Chongqing Sea:39 Rotterdam Duisburg Shanghai Shenzhen London Air:4 Sea Rail Road Air
25
4.3 Explanatory Network
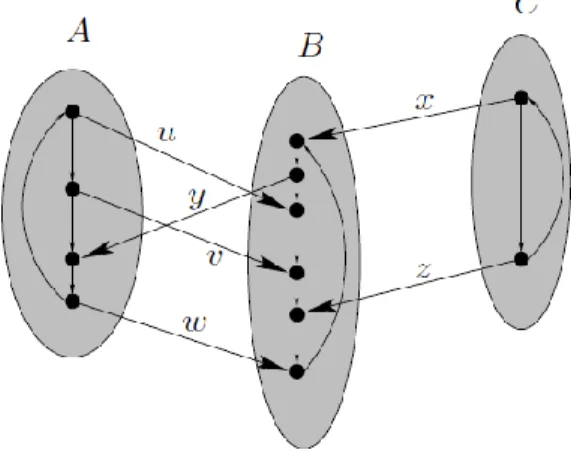
To explain the Chongqing-London network construction methodology, presented on the previous point, without having to use the original one, which is much more complex, let us consider the example in Figure 11 for future references and explanations. The use of this will facilitate the comprehension of the network construction between Chongqing and London allowing the several peculiarities to be introduced.
Figure 11. Network Example Source: Own
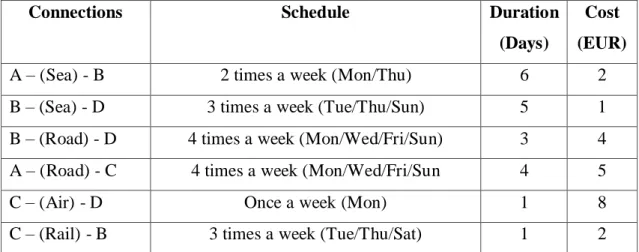
The network uses four locations, six connections and four modes of transportation. The numbers within each arc show the duration of each connection. Table 2 represents the different connections, schedules and costs for the network example, that were based on the literature (Seo et al., 2017), on logistic providers websites (DHL, s.d.; HUPAC, s.d.; Kombiverkeher, s.d.; OCCL, s.d.) and on assumptions.
To explain how the network works, let us establish the language used to code the nodes:
a- arrival
d - departure
“A, B, C and D” are the locations used and “Rail, Road, Sea and Air” the modes. The number that appears next to the transportation mode is the day a cargo may depart or arrive a location. Here it was assumed that day one is a Monday, without loss of
A D B C R a il :1 Sea Rail Road Air
26 generality. For example, as demonstrated in Figure 12, one of the events is AdRoad1, meaning the cargo departs from node A by road on day 1. The lead time considered for the construction of this network is 15 days.
Connections Schedule Duration
(Days)
Cost (EUR)
A – (Sea) - B 2 times a week (Mon/Thu) 6 2
B – (Sea) - D 3 times a week (Tue/Thu/Sun) 5 1
B – (Road) - D 4 times a week (Mon/Wed/Fri/Sun) 3 4 A – (Road) - C 4 times a week (Mon/Wed/Fri/Sun 4 5
C – (Air) - D Once a week (Mon) 1 8
C – (Rail) - B 3 times a week (Tue/Thu/Sat) 1 2
Table 2. Example Network with Schedule, Duration, Costs and Weekly Frequency Source: Based on Assumptions and Logistic Providers Websites
4.3.1 Network Construction
In this point, the network construction will be explained based on the example network since it is less complex and therefore easier to understand.
Based on the time-expanded model, the nodes for this network will be A, B C and D. The edges will be the connections between the different nodes, taking into consideration the different transportation modes as shown in Table 2. Figure 12 shows exactly how nodes work within this example and the several existing arrival and departure
events within each node, for a lead time of 15 days.
Arrival and departure events will be separated within every node and by connections, since the transfer time and the weekly frequency of each connection has to be considered. This means that for every node, there will be an arriving and departure event per mode of transport and also depending on the departure dates that come from each connection frequency. For example, two events within a node can be “Aa” and “AdSea1”, meaning the initial arrival at node A and the departure of the cargo by sea on day 1 from node A.
27
Figure 12. Network Nodes Source: Own Aa DaRoad15 BaRail7 DaRoad13 CdAir8 DaAir9 AdSea1 AdSea4 AdRoad1 AdRoad3 BaSea7 BaSea10 CaRoad5 CaRoad7 CdRail6 CdRail9 BaRail10 BdRoad8 BdRoad10 BdSea9 BdRoad12 DaRoad11 DaSea14 Dd +6 +6 +4 +4 +1 +1 +3 +3 +3 +5 +1
28 In Figure 13, we can verify how do these nodes work within this network, the arrivals and departures events within a node, and several connections amongst the events.
Figure 13. Example of Node A Connections, Arrivals and Departures Source: Own
The departure dates influence the several events established here because within every connection there is the possibility for the cargo to leave on more than one day. Let us take the example of node A, going by sea, the cargo can leave either on day 1 or day 4 and still reach D within the 15 days. By road, there are two departures, on day 1 and on day 3, meaning that node A will have four departure events overall.
By leaving on day 1 by sea, it arrives node B on day 7, departing by road on the 8th, because it is a Monday, and this connection has departures on Mondays, reaching D on the 11th. However, instead of only departing node B on day 8, it can also leave either on day 10 or 12 by road or day 9 by sea and still reach node D within the lead time requested, 15 days. Aa AdSea1 AdSea4 AdRoad1 AdRoad3 Node A Departures Arrivals Connection
29 On the other hand, if leaving A on the 4th, it reaches B on day 10 and leaves by road on the 12th (one of the options of the previous connection also), reaching D on the 15th.
Instead of starting from the beginning each day with the same information, the network built in this thesis considers a weekly frequency, where each day has different modes departing on different schedules, differing here from the time-expanded model. This means that day by day, the available connections will differ, and the feasible solution might change, depending on the lead-time. Also, because the time-expanded model is a shortest-path model, not suitable here, were there is a constant search for the most efficient solution.
This can be verified in Figure 12, all the nodes, connections and events are visible in this example, meaning all the feasible solutions within the 15 days lead time. Here there is a clear notion on how the network between Chongqing and London was created. The same methodology is followed when constructing this thesis network, except it has many more nodes and possible connections, meaning more connections hypothesis to be used and resulting in a much more complex network.
4.3.2 Example Network
For the network previously demonstrated, we will consider a lead time of 15 in order to define the different existing possible connections with origin in A and final destination in D.
By sea mode, the ship can leave location A either on day 1 (Monday) or 4 (Thursday) and still reach location D within the 15 days. By road, it can only leave on day 1 (Monday) or 3 (Wednesday). When leaving A on day 1, since the duration by sea is 6 days, it will only reach B on day 7, and from there it can leave by sea again or by road. If leaving by sea, it can only leave on day 9 (Tuesday) and since the duration is 5 it will reach location D on the 14th.
On the other hand, if leaving location B by road, it can leave either on the 8th, 10th or 12th, taking it 3 days to reach location D, respectively, on days 11, 13 and 15.
30 When leaving location A by road, the departures can be on day 1 or 3, taking the truck 4 days to reach location C, arriving on the 5th and 7th. Considering then the air mode, both of these options will leave by air on the 8th taking the airplane one day to arrive location D, meaning the 9th.
4.3.3 Example 1: Transfer Time
This first case will demonstrate how does transfer time works within the whole network. To better understand how the network works and how it was built, let us consider the connections A – sea – B – road – D.
Figure 14 illustrates the case where transfer time interferes. For these connections, the cargo will leave location A on day 1 by sea, taking six days to reach location B on day 7, which is a Sunday, and therefore one of the days of the week the truck can leave location B to location D, according to the schedule already provided.
However, since one of the assumptions of this network is that the transfer time is 1 day for any transfer, the cargo will not be able to leave location B on Sunday (day 7), although there is a truck leaving on that day. Instead it can only leave from day 8 forward, and since the next truck is on Monday, it will leave location B on day 8 and reach location D on the 11th.
On the other hand, it is also possible that the cargo arrives on the exact previous day of possible departure by the other transportation mode. Considering the connections A-C-D through road and air, the Figure 14 is an example of one of the possible set of connections.
In contrast, for Figure 15, it can be verified that by leaving location A on day 3 and reaching location C on day 7 (Sunday) it has to wait one day due to transfer time, and it will only leave location C by air on day 8.
31 Example1:
Figure 14. Connections A-B-D Trough Sea and Road Source: Own
Example 2:
Figure 15. Connections A-C-D Through Air Source: Own +1 Aa DaRoad15 BaRail7 DaRoad13 CdAir8 DaAir9 AdSea1 AdSea4 AdRoad3 BaSea7 BaSea10 CaRoad5 CaRoad7 CdRail6 CdRail9 BaRail10 BdRoad8 BdRoad10 BdSea9 BdRoad12 DaRoad11 DaSea14 Dd +6 +6 +4 +4 +1 +1 +3 +3 +3 +5 AdRoad1 +1 Aa DaRoad15 BaRail7 DaRoad13 CdAir8 DaAir9 AdSea1 AdSea4 AdRoad1 AdRoad3 BaSea7 BaSea10 CaRoad5 CaRoad7 CdRail6 CdRail9 BaRail10 BdRoad8 BdRoad10 BdSea9 BdRoad12 DaRoad11 DaSea14 Dd +6 +6 +4 +4 +1 +1 +3 +3 +3 +5
32
4.3.4 Example 2: Lead Time (Same Connection)
Figure 16 represents the different hypothesis within a same route (A– Sea – B – Road – D) with lead time of 15 days.
It can be verified that for leaving location A on day 1 (Monday) and arriving location B on day 7, there are three possible routes. This happens because the road mode can leave B either on day 8 (Monday), on day 10 (Wednesday), or on day 12 (Friday) and still reach its destination D within the lead time 15, in this case on day 11, 13 and 15. The cost for any of these sets of connections is 9 EUR.
We can then conclude that within a specific lead time, there might exist several connections, that depart from a certain origin on the same days, taking different departures on the intermediate location and still reach destination within the same time-window.
Example 1:
Figure 16. Connections A-B-C Through Sea and Road Source: Own +1 Aa DaRoad15 BaRail7 DaRoad13 CdAir8 DaAir9 AdSea1 AdSea4 AdRoad1 AdRoad3 BaSea7 BaSea10 CaRoad5 CaRoad7 CdRail6 CdRail9 BaRail10 BdRoad8 BdRoad10 BdSea9 BdRoad12 DaRoad11 DaSea14 Dd +6 +6 +4 +4 +1 +1 +3 +3 +3 +5
33
4.3.5 Example 3: Shortest-Path
Considering the network given, the information in the Table 2, about schedules and costs and taking into account that the transfer time within a location (arrival-departure) is 1 day, the smallest lead time possible for this network is 9 days. For this lead time, there is only one solution available, corresponding to the highest cost possible, since it uses air mode.
Let us now explain how is this possible. A certain company stablished in location A wants to send its cargo to location D, and it has to reach its destination in a maximum of 10 days. To be able to achieve this, there is only one possible group of connections, regardless the cost.
For this freight order, the possible routes are illustrated in Figure 17. The cargo will leave location A by road on the day 1, and since the arc A-C by road has a duration of 4 days, it will reach location C on day 5. Since the air mode only leaves once a week, every Monday, it can only leave on day 8, taking one day to reach location D, which means it arrives on day 9. The cost of this transfer is 13 EUR. In this route and with these conditions, it was not necessary to consider the transfer time, since it was already intrinsic because the departure from location C could only happen 3 days after the arrival due to the weekly frequency of the transport.
Another option to arrive to location D before day 10 is by using the same route, but instead, leaving location A on day 3 (Wednesday), reaching C on day 7 but still being able to catch the air mode on day 8 and therefore arrive location D on day 9, as shown in Figure 17.
These are the fastest routes from A to D, which means they are also the most expensive ones. Air mode of transport is the most expensive, whereas sea is the cheapest. Depending on the customer’s needs, the solution will also differ. The final objective is always to find the cheapest solution, by assuring the lead time provided is followed, and then the cost-saving option that corresponds to the solution.
34
Figure 17. Shortest Path Routes Source: Own
4.3.6 Example 4: Lead Time (different connections)
Considering a lead time of 11 days, there will exist four options of delivering the cargo. Two of them are the ones explained it the previous example, by air mode, and the others use the other three modes of transport. The four possible solutions are demonstrated in Figure 18.
Figure 18. Solutions for 11 Days Lead Time Source: Own +1 Aa DaRoad15 BaRail7 DaRoad13 CdAir8 DaAir9 AdSea1 AdSea4 AdRoad1 AdRoad3 BaSea7 BaSea10 CaRoad5 CaRoad7 CdRail6 CdRail9 BaRail10 BdRoad8 BdRoad10 BdSea9 BdRoad12 DaRoad11 DaSea14 Dd +6 +6 +4 +4 +1 +1 +3 +3 +3 +5 +1 Aa DaRoad15 BaRail7 DaRoad13 CdAir8 DaAir9 AdSea1 AdSea4 AdRoad1 AdRoad3 BaSea7 BaSea10 CaRoad5 CaRoad7 CdRail6 CdRail9 BaRail10 BdRoad8 BdRoad10 BdSea9 BdRoad12 DaRoad11 DaSea14 Dd +6 +6 +4 +4 +1 +1 +3 +3 +3 +5
35 This means there are four different solutions when it comes to arriving location D until day 11. The options by air mode arrive location D at day 9, whereas by rail and road it arrives on day 11 and by sea and road the same. After understanding there are four sets of connections within a certain lead time, what influences the decision is the cost.
Both options by air will cost 13 EUR, the connection by rail costs 11 EUR and the connection by sea and road costs 6 EUR, meaning this last option is the cheapest and therefore the solution given as the optimal one. The network will always represent all the available connections considering the lead time imposed.
4.3.7 Example 5: Cheapest Connection
In this example, only the sea mode of transport is used, meaning this is the longest option to go from location A to D if leaving on day 1, as shown in Figure 19.
Figure 19. Route A-B-D Through Sea Source: Own
Sea mode is also considered to be the cheapest mode, which can be verified here as going from A to B is 2EUR and going from B to D costs 1EUR, making a total of
+1 Aa DaRoad15 BaRail7 DaRoad13 CdAir8 DaAir9 AdSea1 AdSea4 AdRoad1 AdRoad3 BaSea7 BaSea10 CaRoad5 CaRoad7 CdRail6 CdRail9 BaRail10 BdRoad8 BdRoad10 BdSea9 BdRoad12 DaRoad11 DaSea14 Dd +6 +6 +4 +4 +1 +1 +3 +3 +3 +5
36 3EUR. These types of routes are well applied when lead times are greater, since this way the total cost is lower and the transit time is the ideal.
4.4 Schedules Methodology
The network built was based on shipping companies and freight forwarders information within Seo et al (2017) paper and based on information found on shippers and logistic providers’ websites. Besides this, some assumptions had to be made while building the network, involving the several transports timetables, because companies will not provide this information. Although some of the information was found in shipping companies’ websites, other had to be assumed. The assumptions made are the following:
- Between Chongqing and Shanghai, sea transport, is scheduled to happen twice a week, on Mondays and Thursdays.
- Any transportation made by road, meaning by truck, is assumed to leave every day since it will depend on the need of transporting.
- The connection between Chongqing and Shanghai by rail, is assumed to occur twice a week, on Tuesdays and Saturdays.
- The rail transport between Duisburg and London is assumed to occur once a week on a Monday, its cost in 600 USD, and its duration is one day.
- The road transport between Duisburg and London costs 630 USD and has a duration of one day.
- The rail transport between Duisburg and Rotterdam is assumed to happen five times a week, on Mondays, Tuesdays, Wednesdays, Thursdays and Fridays. - The road transport between Duisburg and Rotterdam costs 600 USD and duration
of one day.
- The air transport between Chongqing and Rotterdam, is assumed to happen every seven days, on Mondays.
- The air transport between Rotterdam and London is assumed to happen four times a week, on Mondays, Wednesdays, Fridays and Sundays. Its cost is 2200 USD and the duration one day.
- The sea transport between Rotterdam and London is assumed to happen three times a week, on Tuesdays, Thursdays and Saturdays, with a cost of 100 USD.
37 - The road transport between Rotterdam and London is assumed to have a duration
one day and to cost 600 USD.
- The transfer time for each arrival-departure will be one day, meaning no transportation can leave in the day it arrives.
For the construction of the network, the worst-case scenarios will always be taken into account, this means that for example, for the connection between Duisburg and Rotterdam if the transport can happen three times per week and also five times per week depending on the company used, we will use the three times per week scenario.
It is also important to state that the cost here presented, are for 40’ High-Cube containers, which are similar to standard ones but taller. These containers are used for all type of general cargo, being more suitable for high volume cargo.
This case will have several connections, based on the paper from Seo et al., (2017). Besides the connections already existing in the paper, new ones were added in order to make a more complete network and to demonstrate the reality more accurately. The network will have twenty-six different connections from Chongqing to London. (see Appendix H)
The connections added were:
- From Duisburg to London through road - From Duisburg to London through rail - From Duisburg to Rotterdam through road - From Rotterdam to London through air - From Rotterdam to London through road.
4.5 Specific Cases on the Chongqing-London Network
This Section will show the longest and shortest routes within the network constructed, as well as the most expensive and the cheapest ones.
38
4.5.1 Cheapest Connection
The cheapest set of connections from Chongqing to London, will always be the one that only takes the sea transportation mode. For this network, this set is demonstrated in Figure 20.
Figure 20. Connections C-A-R-L Through Sea Source: Own
These connections will have the cost of 2454 USD, 371 USD for the first shipping from Chongqing to Shanghai, 1983 USD for the second from Shanghai to Rotterdam and 100 USD for the last connection between Rotterdam and London. Whatever the lead time considered, sea mode will always represent the longest connections and the least expensive.
4.5.2 Most Expensive Connection
The most expensive set of connections, seen in Figure 21, will be the ones that use the air mode all the way, as it is the most expensive mode.
Figure 21. Connections C-R-L Through Air Source: Own