A Work Project, presented as part of the requirements for the Award of a Masters Degree in Management from the Faculdade de Economia da Universidade Nova de Lisboa
Children Consumer Behaviour Field
Lab: The Nestum Consumer
Jacqueline Areal Lourenço Student number 359
A Project carried out on the Marketing course, with the supervision of:
Luísa Agante
Index
1. Abstract ... 4
2. Introduction ... 4
3. Literature Review ... 6
3.1.Private Label and National Brands ... 6
3.2.Dietary Habits, Diet and Trends ... 8
3.3.Breakfast Consumption ... 10
3.4.Snacking Consumption ... 12
4. Methodology ... 13
5. Findings... 15
5.1.Children‟s Findings ... 15
5.1.1. Before School Findings ... 17
5.1.2. Mid-Morning Findings ... 18
5.1.3. After School Findings ... 19
5.2 Parents Questionnaire ... 20
6. Conclusions ... 24
7. Limitations and future research ... 27
8. References ... 28 9. Appendixes ... Error! Bookmark not defined.
1. Abstract
The goal of this work project is to help Nestum understand its consumers as to better comprehend the needs, tastes and routines of the target consumer, children with ages between 6 and 10.
Knowing one‟s consumers is vital to stay relevant and also understand how to innovate and differentiate in a day and age where private labels are increasingly becoming consumed which has a negative impact on brands such as Nestum.
Additionally with the ever more diverse and connected worlds, cultures and habits are being changed which affect how, when and what products are consumed.
In conclusion, the main goal of this work project is to understand what children are eating, what are their routines and habits as to help Nestum remain relevant as a brand with a strong cultural attachment in Portugal.
Keywords: Children Consumer Behaviour, Dietary Habits, Routines, Trends.
2. Introduction
This work project is part of a field lab on Children‟s Consumer Behaviour more specifically related to the behaviour of the consumers and potential consumers of products of a specific brand – Nestum.
Nestum is a well known brand in Portugal and its products are included in Nestlé‟s cereal and milk category. It is a brand directed at and for children and children have a powerful presence in the marketplace so it has become increasingly important to understand their behaviours. Therefore understanding Nestum‟s consumers eating habits is essential to have a successful product and brand.
In a market where private labels are increasing sales has intensified competition and lowered market share of national brands (Nestum is considered a national brand). In this industry (in this case breakfast cereals) in Portugal and according to data of AC Nielsen1 private labels market share has increased from 12,38% in 2004 to 19,22% in 2006.
Company executives and industry experts affirm that national brands fight using three tools: lowering prices, engage in more promotional activities and using product differentiation (Nijssen and Van Trijp, 1998). For example in recent years, 27% of General Mills' volume, on average, has come from products five years old or less (Martin and Kubomura, 1999).
According to Quaker Oats' CEO Robert S. Morrison, "Leading brands possess great long-term value only if they can evolve over time to respond to the tastes and needs of new generations". So the purpose of this study is to understand the eating habits of children during breakfast and the mid-morning and afternoon snacks. And eating habits will be defined as what a person (in this case a child) consumes in a given meal/snack.
Consequently children aged between 6-10 years will be analyzed as to what they eat for both breakfast and afternoon snack; will be analyzed as well as where they eat the before mentioned meals. The ages of 6 to 10 years old were chosen as this is the main target for Nestum‟s products. This means that this study will not be focusing on Nestum specifically but rather on its consumers and potential consumers habits and behaviours. Additionally parents will be analyzed as to better comprehend how changes in parents lives are reflected in the child‟s eating habits.
In Portugal, and according to the latest census, children between this age accounts for roughly 5,3%of the population in this case aged between 5 to 9 years old2, therefore one can
1
Data from Ac Nielson available at Nestlé’s site: http://www.nestle.pt/CmsPage.aspx?PageIndex=221
2
acknowledge the importance of understanding their habits and behaviours (for additional population breakdown and graphs please refer to appendix 1). This is particularly important as studies show that people‟s habits acquired during childhood and adolescence tend to remain unchanged in adulthood, provided the person remains within the specific subculture experienced during his or her formative years (Moschis, 1987).
Due to the ever changing world we live in, eating habits have been altered (Gamble, Cotugna, 1999). Meals have become as convenient as possible as to not waste time, since time is money. Not only have adults eating habits changed but children‟s too (Siega-Riz., Popkin, and Carson,. 1998) since both parents now work (the percentage went from 36, 7% in 1981 to 77, 8% in 2001- The Female Population and familiar transitions throughout the Demography, INE 2002) which means that children tend to eat out of the house more and also snack more (Story and French,2004). The societal change has impacted our society in a way that children are increasingly becoming obese which has many repercussions not only on the child‟s health but also on its own body image and confidence as people with obesity often suffer prejudice and discrimination. (Chan, Prendergast, Grønhøj, Bech-Larsen, 2009).
3. Literature Review
3.1. Private Label and National Brands
Sales and market share of private labels have grown considerably over the last decades not only in Europe but in the USA although the impact is bigger in the former than in the latter (Kumar and Steenkamp 2007). In western European countries private labels already have a significant market share, for instance in France the Netherlands and Belgium it is between 18-23%, while in the UK it can reach 34%. (Ashley, 1998).
The expansion on private labels is due to several factors: increased retailer concentration, retailers‟ aim for higher profits, retailers‟ higher levels of efficiency at managing private labels as it is a part of their new strategies. (Dahr and Hoch, 1997; Messinger and Narasimhan, 1995).
Private labels in the past were considered the lower quality option, yet retailers are deliberately moving upscale by introducing private labels with the same quality as national brands, hence making them compete directly. (Verhoef et al., 2000). Retailers at times even have a 2-tier store-brand strategy, which means they have one low price/economical brand at a substantial discount and another more premium brand to compete with the national brands by making it more appealing, especially in terms of packaging (Berlinski, 1997).
As the quality gap has decreased private labels are increasingly being considered a threat and needing to be considered in the marketing strategies of national brands (Morris and Nightingale, 1980).
National brands fight private labels by lowering prices, increasing promotion activities and through brand building that increasingly differentiate their products (Nijssen and Van Trijp, 1998). This is also seen in a Study by Martin and Kubomura (1999) where executives of food companies contend that their brands are maintained through differentiation. For instance Dale F. Morrison, president and CEO of Campbell Soup, said that they keep their brand more contemporary, relevant and convenient so they produced new soup varieties and packaging formats such as its ready-to-serve tomato soup in resealable plastic containers and Campbell's Soup To Go in microwaveable single-serve bowls due to the change in consumer habits and need for convenient products.
The introduction of products has been considered as an important element of competition between food companies, and the successful management of new product development as a key
factor of business performance (Traill and Grunert, 1997). However in a study by Hughes (1994) it was estimated that the modern supermarket often carries a range of up to 15,000 products and that a leading UK retailer said to introduce around 1500 new private label products alone in 1993 while only 300 in 1987.
True product innovation is one of the strongest competitive weapons against private labels since a major innovation by the manufacturer leaves the private label in the unfortunate position of imitating yesterday‟s favourites. (Quelch and Harding, 1996). This is also due to the fact that compared to the national brand maker; the retailer operates on a thinner mark-up and many more goods than the national brand maker. Thus retailers cannot afford such a prime R&D staff. However although innovation seems to be very important several scientific papers (Hoch and Banerji, 1993; Krishnan and Soni, 1997; Steenkamp and Dekimpe, 1997; Mela et al., 1998) when explaining the success of private labels use factors such as decreased national brand innovation and advertising which means that although executives and industry experts believe it to be the best path it is at time disregarded while focusing on other elements such as price.
3.2. Dietary Habits, Diet and Trends
Nutrition during one‟s childhood and adolescence is crucial for growth and development, health and well-being. (Story 2002, Dietz, 1999) Further, eating behaviours and dietary patterns developed during childhood track into adulthood and consequently contribute to long-term health issues and perils (Anderson et al., 1994; Warwick et al., 1999; Caraher et al., 2004, Perry 1997).
A study by Seaman et al (1997) found that parents were the main source of information and hence main influence on children between the ages of 5 and 8 years old, but after the age of 8 although parents remain the main source of information, their influence decreases as new
influences, such as advertising, peer-pressure and formal nutrition education, becomes stronger. The influence of formal nutrition education as the most important influencing factor of food choice and meals patterns was found in a study by Thomas (1991). While a study by Donkin et al. (1993) found the exposure to the opinions of peers and advertising to be the factors that define children‟s eating habits.
A study done by Bartlam (1993) showed that consumers are increasingly aware of the relationship between what they eat and their health, and this trend is likely to continue to influence consumers‟ buying patterns. However parents also seem to use this trend more towards themselves than on their children as most parents seem to believe that a child is still growing.
Nevertheless, as said previously, children and adolescents are eating less at home, drinking more soft drinks, and snacking more frequently (Story and French, 2004) since the food provider responsibility isn‟t solely of the parents anymore but also other caregivers. According to a study by Crockett (1995) "Home eating" not "home cooking" is the trend, with 46% of family food expenditures for food and beverages served out of the home and 34% of the total food dollar spent on fast foods.
In addition, children are also the targets of advertising campaigns, especially since a new subcategory of foods has been developed and packaged just for them, most of which are in sugar and sodium (McNell, 1991). In 2004 the advertising and marketing expenditure on products‟ direct to children was estimated at $US15 billion, of which a significant share was food and beverage marketing (Schor, 2004).
American children main calorie sources are fat or added sugar (32% and 20%, respectively) (Gleason, 2001). Numerous studies have consistently documented that dietary
intake patterns of American children and adolescents are poor and do not meet national dietary goals. (Story and French 2004).
This change in what children eat lead to the growing epidemic of childhood overweight and obesity which is a major public health concern (Story M. and French S.,2004). For example,
obesity among children in the United Kingdom is now being termed an epidemic (Dietz 2001), a trend set by the United States and echoed in most parts of the world (Lobstein et al . 2004; Koplan et al . 2005). At the turn of the twenty-first century it was estimated that the number of overweight children and young people in the world were over 155 million (Lobstein et al., 2004).
The factors identified as contributors to childhood obesity include parental obesity and food provisioning practices, increasingly sedentary lifestyles, greater reliance on snacks and convenience foods, the rise of fast food culture, food promotion and advertising that encourages children to pester their parents to buy (Kline, 2004; Boynton- Jarrett et al., 2003; Hastings et al., 2003; Ayadi and Young, 2006).
3.3. Breakfast Consumption
People have always said that breakfast is the most important meal of the day yet it is the meal children skip the most (Singleton, 1982). A study by Nicklas et al. (2004) showed that a regular breakfast intake increases the possibility of a balanced diet and improves the overall nutritional status and the nutrient density, especially during growth stages. Additionally, skipping breakfast has also been associated with poorer eating habits and increased snacking during the remainder of the day but also higher health risks (specially obesity) not only as a child but well into adulthood (higher levels of cholesterol) (Berkey et al., 2003; Keski-Rahkonen et al., 2003, Reniscow 1991).
The importance of breakfast and cognitive performance and hence academic performance is not new since many studies have shown that children who skip breakfast find it more difficult to concentrate in class, detrimentally affects problem solving, short-term and episodic memory. Conversely, when children eat breakfast their performance is enhanced on measures like vigilance attention, arithmetic, problem solving tasks, and logical reasoning (Pollitt, et al., 1981, 1983, 1988; Vaisman 1996, Murphy et al, 1998, Marquez et al, 2001, Dye et al. 2000, 2002, Wesnes et al 2003, Conners et al. 1983).
There have been several studies done with children and adolescents breakfast habits yet most tend to focus on the frequency of breakfast and its implications on or academic performance or on nutritional value rather than what is exactly consumed at breakfast.
Studies have shown that breakfast consumption in the past 25 years has declined for children and adolescents in the United States, with a greater decline for the latter than for any other age group. (Siega-Riz et al., 1998; Nicklas et al.1998). More specifically, the study by Siega-Riz et al.(1998) estimated that between 1965 and 1991, breakfast consumption declined by 15% to 20%, resulting in as few as 64% of adolescents consuming breakfast.
In what concerns what children and adolescents eat a study by Box and Landman (1994) that focused on children aged 5 to 8 years found that 5 in every 100 children studied did not have breakfast. Children‟s favourite breakfast was cereal and milk, with 68 in every 100 children, six out of 100 of the children in the study had a cooked breakfast and even fewer – three out of 100 – had an egg. Other relatively high protein foods such as cheese and yogurt were eaten by only two out of 100.
Another study also found ready-to-eat (RTE) breakfast cereal to be the most popular choice of breakfast, consumed by over 60 per cent of British children today. This is followed by
bread or toast, tea or coffee, fruit juice, a milk drink, a cooked breakfast or a piece of fruit. (Ruxton et al. 1993).
A study conducted in Spain by Aranceta et al. (2001) on the children and young people showed that 6-9 year olds are the ones that have breakfast the most, while 8% of the sample did not eat breakfast. The typical breakfast was milk with cocoa powder or soluble chocolate and sugar, a choice of breakfast cereals (34%), biscuits (40%), bread (15%) or sponge, buns, or croissants (10%). In what concerns a fruit or vegetable intake around 10% of the group usually had orange juice for breakfast and 5% some kind of fruit or fruit salad.
3.4. Snacking Consumption
Descriptive studies have shown that snacking is currently an important component of the diet of Americans as measured by factors such as the snacking occasions per day and percent of snacks eaten outside the home. Snacking is therefore becoming an important source of calorie intake (Frazão, 1999).hence the importance to understand this behaviour.
Even though there are several studies on snacking most are associated with the effect of advertising on snacking whether actual consumption or purchase (Hastings et al. 2003; Sharaga, 1974; Ward and Wackman, 1972, 1977; Ferguson, 1975 Goldberg, Gorn, and Gibson 1978, Frazão 1999).
There are few studies focusing on what children eat as a mid-morning or mid-afternoon snack but rather on snacking as what people that is not a breakfast, lunch or supper. Also in the existing studies the definition of snack differs making comparisons more difficult. (Nicklas et al., 2004)
In a study by Cross et al. (1999) nearly all respondents snacked at least once a day; only 2% stated to never snack. The least popular snack time was mid-morning. Afternoons were the most popular time for snacking and respondents preferred to snack crunchy/salty like chips or popcorn. Also an evening snack was popular amongst children who ranked ice cream as their favourite snack. Another important number from this study is that almost 80% of snacking in children is done at home.
In another study by Jahns, Siega-Riz, and Popkin (2001) snacking was found to have increased from 77% in 1977 to 91% in 1996. The contribution of snacking to calorie intake also increased 30% during the period analyzed this is due to the greater amount of snacking times during a given day. The main increase in the amount of snacking times occurred between 1989 and 1996, with snacking now being an important source of vitamins and minerals.
4. Methodology
The methodology will be divided into the methodology used on the children and the methodology used on the parents as to get the most information and data from both.
The technique that will be used on the children is called the “draw-and-write” technique. This method was devised in 1978 by Wetton to investigate young children‟s use of the language of their feelings. It consists on asking a child to draw given a certain theme. This study will use the technique and research strategy as used in the Box and Landman (1994) study. This technique will consist in asking the children to put their name on a piece of paper (that is given) and divide it into four, and draw everything they did before coming to school for instance. For “draw and write” technique to be more effective depending on information needed the time that the research will be conducted will change. For example for breakfast it is best to do the research
between the beginning of morning school and break time, while the children can still remember what they had eaten before school.
All children will get an explanation before so they if any child does not want to participate he/she can feel comfortable not to. However the ultimate goal of the study has to be somewhat covered as children will tend to exaggerate, this meaning if asked to draw what they did before and cues are given to directly children will draw what they heard and think the researcher wants rather than what happened.
Parents will be informed of the study in writing and given an opportunity to refuse participation of their children, for an example of the authorization letter please see appendix 2.
Additionally children will also be interviewed on this topics as to get a better understanding of the information provided on the draw and write technique but also to further understand routines, needs, wants, likes and dislikes.
For the parents a questionnaire is going to provided information on several demographic and socio-economic indicators such as age, marital status, profession but also going to inquire about their children‟s eating habits and routine with questions regarding with what their children usually eat at breakfast and snack during the day, what are their extra-curricular activities, among others. Moreover there will be a part in the questionnaire entirely dedicated to parents‟ perceptions on certain concerns such as work/home balance, dietary habits, more specifically where eating habits are developed, how are they shaped. In the last mentioned section a Likert scale was used since this type of scale indicates the level of agreement with each statement and can avoid to a cetain degree social desirability; it was a 5 point scale with the extremes being strongly agree/disagree to assess parents‟ perceptions. (for sample questionnaire see appendix 3).
The questionnaire will not attempt to estimate calorie or nutrient intake since that is not the purpose of our study, but rather whether or not a certain food was consumed.
After the questionnaire was developed it was given to a small group of parents as to understand if there were any parts of the questionnaire that could be changed and also to understand how long it would take to fill out as to not be tedious. Finally the parents give me their honest opinions the scale used to understand what products were consumed at how frequently was modified by simplifying, the column called rarely was kept while the column monthly was removed as parents perceived monthly to be rarely.
The questionnaires will be given to the parents of whom the drawings will be done by and attached will be the authorization letter. Furthermore other forms are increasing the number of questionnaires will be used such as using supermarkets.
5. Findings
The finding will be divided in two, first the information provided by the children on their habits and routines, this given by the drawing and interviews3. And then the information provided by the parents through the questionnaire. Finally this information will be crossed to provide a clear insight into to a typical day of a child this age.
5.1. Children’s Findings
Firstly, a brief description on the sample and response rate used in this study.
3
The information presented in this finding was complemented with interviews but as no formal authorization was asked as to recording these interviews they were not recorded but rather notes were taken.
The number of children participating in the study changed depending on the drawing that was being done but in total three classes participated with a total of 76 students with 63 participating (a 83% response rate from the authorization letters). (See appendix 4 for a table with a complete description).
5.1.1. Before School Findings
The children4 did three different drawing for the different periods of the day, to analyse this data it was put onto SPSS and analyzed. Firstly we will analyze the morning drawing, then the mid-morning and finally the afternoon.
The average child doing the morning drawing was done by a child aged 7 and as a gender a boy. The total sample was of 43 students, most children that did not participate were mainly due to absence. More precisely in what regards the morning drawing firstly what activities were drawn the most and in which order there were drawn was analyzed, so a child‟s morning routine usually consists of and in this order: waking up (22%), having breakfast (22%), personal hygiene (18%), getting dressed (12%) and finally the ride to school (11%), please see picture 1 for an example of a drawing and refer to appendix 5 for more detailed information on the activities and examples of drawings, furthermore for information on the other elements drawn please refer to appendix 6.
Secondly and more important than understanding their routine, was understanding what the children actually eat. For this it is important to differentiate between food drawn and food mentioned in the interview (refer to appendix 7). In terms on what is eaten most regularly by children, breakfast cereals (56%), bread (13%), milk (28%). It is important to mention that children did not differentiate between breakfast cereal, cereal flakes (which is what Nestlé considers Nestum) or even porridge; so cereal flakes are included in cereals but taking into account the number of children that mentioned eating Nestum the percentage of cereal flake
4 The children that did the drawings the school allowed one class of each year excepting the second grade due to schedule conflicts. Picture 1: Example of a Before School Drawing (Girl, Grd 1)
eaters is around 5%. In the children in first grade Cerelac was more consumed while Nestum was more consumed in the 4th grade. In terms of brands, brands were never drawn but rather mentioned when asked what they ate; the most mentioned was Chocapic (40%) followed by Nestum and Cerelac both with 15%.
Moreover when drawing breakfast the children found it more important to draw where they ate and what it looked like rather than the food itself. Like this children tended to draw themselves sitting at table with chairs being small in comparison to their size, as this is how they see themselves; yet for 26% of children breakfast is considered a family activity with the family being drawn.
5.1.2. Mid-Morning Findings
The second drawing analyzed was that concerning the mid-morning snack. The sample of these drawings was also 43 like the previous section.
Firstly the activities most frequently
drawn and in which quarter will be analyzed. In this case the two activities most frequently drawn were in class and during recess with 38% and 42% respectively (see picture 2 above for an example of a drawing).
It is important to note that most children combine two activities during recess which are playing and eating their mid-morning snack. Which means that in some drawings one will have a child playing in one quarter and then eating in another but there are also drawings in which playing and eating are done at the same time. Also during the interviews it becomes ever clearer
that children take mid-morning snacks to school they do not eat them as it takes time away from playing.
During the mid-morning break the foods that are most consumed are bread (33%), milk (30%), biscuits (15%), fruit appears in last place with 11% (please refer to appendix 10. Brands were not analyzed as they did not seem relevant, because most children ate biscuits but did not exactly know the brand. As in the previous analysis on the before school drawing further information on the types of elements drawn is in appendixes 8 and 9.
5.1.3. After School Findings
Finally the afternoon drawing was analyzed using the same process as the above two, but the sample was smaller only 23 students. The activities most drawn were: ride home (87%), homework (65,2) and afternoon snack (47,8%) (for more information refer to appendix 11; for an example of a drawing refer to Picture 3).
In relation to dietary choices, milk (80%), bread (69%) and toast (26%) are the most popular choices with fruit being one of the least favourite with only 4%. Furthermore most children ate at school as the afternoon snack is provided by the school once classes finished between 4-5pm (more detailed information can be found in appendix 13).
Additionally to the dietary information, information regarding extra-curricular activities was also provided with swimming being the most practiced with 13%, followed by languages and karate both with 8,7%. Further information on extra-curricular activities and other elements drawn can be found in appendix 12.
4.2 Parents Questionnaire
The questionnaire was sent to 150 parents with 105 answering (response rate of 70%) however only 73 were considered valid, as not all questionnaires were filled fully and some were filled incorrectly. (See appendix 4 for a table with a complete description).
The parents‟ questionnaire, as mentioned previously, provided information on the different meals under study but also routines. The average parent was a mother (80%), aged between 35-40 years old (41%), married (86%) and with two children (51%). The average child was a boy (51%) aged 7,3 years (27% of the sample were age 6). For the detailed information on the respondent and the respondents children please refer to appendix 14)
In what concerns the breakfast, it is eaten by nearly all children only one not having it every day. In terms of food choices the most frequently answered were milk (31%), fruit (16%), breakfast cereals (13%), yogurt (12%) and finally bread (11%) as one can see in graph 1. So one can gather that most children will have cereals with milk and fruit, yet milk might be substituted by yogurt and cereals with bread. Cereal flakes, like Nestum, are only consumed everyday by 3% of children a percentage even lower than biscuits and cereal bars. However this percentage is much higher reaching 12% in occasional consumption. (Please refer to appendix 15 for more detailed information).
Further information provided by the questionnaire tells us that breakfast is usually consumed between 7-8am (89%) and it is mainly prepared by the mother (59%) and is consumed at home (96%). For more complete information refer to Appendix 15 also.
The mid-morning snack had an interesting result as 22% of children did not eat anything from breakfast until lunch. However of the children that did most was brought from home 57% yet the mid-morning snack given by the actual school was also high (32%). (See appendix 16 for the graphs on the information provided above)
In terms of what is eaten as the graph on the left shows, once again milk (20%), fruit (21%), bread (17%) and yogurt (14%) are the most consumed. Once again cereal flakes have a very low percentage this is mainly due to the fact that it is not a product that can be easily taken to school to snack on, due to is preparation requirements. This is not the case of cereals bars and biscuits which are easily transported and account for (9%). (See graph 2 presented above or appendix 16 table 1 for more information on what food was eaten and at what frequency)
Finally the other meal analyzed was the afternoon snack, which is mainly eaten at school (60%) as it is provided by the school since it is the school that at times organizes the further afternoon activities (as school finishes before parents can leave work); this can be seen as children eat their afternoon snack between 4-5pm (64%) and 29% before 4pm and working hours
are usually until 5:30pm.
Regarding what is eaten by the children as one can see in the graph below once again bread (25%), milk (24%), fruit (20%) had the higher percentages followed by yogurts (see graph 3).
Graph 2: Food Eaten Everyday for Mid-Morning Snack
This is to be expected as the afternoon snack is provided by the school, and the school offers bread, milk and fruit. In this meal cereal flakes only achieve a mentionable percentage in occasional use since in the other categories its percentage was usually around 1%. For the detailed table please see appendix 17 table 1.
Other information provided by the
questionnaire was on the routine of who takes and picks
up the child from school, with the mother playing an
important role 51% of the time the mother takes the
child to school (while the father 41%) and picking up the
child the percentage is one percent higher (52%) however the father‟s percentage is lower and there are many different people picking the child up including grandparents and transportation provided by the school (see graph 4 above).
Additionally most children do not receive pocket money only a smaller percentage (15%) and 51% of children watch between one to two hours of television daily (see appendix 18) In terms of extracurricular activities swimming and group sports5 have the higher percentage with 18,20% and 20,60% respectively. (See appendix 19 for more detailed information)
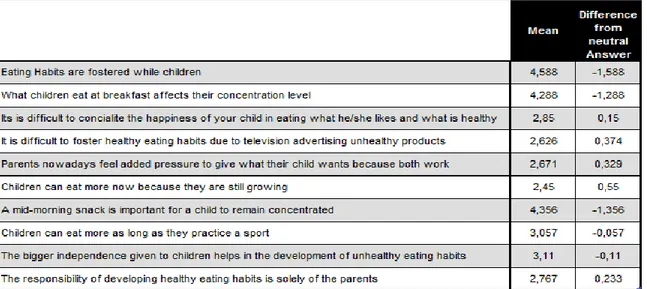
The part of the questionnaire that intended to better understand their perceptions on eating habits and how they are cultivated the impact of the changes of society among others did not provide as conclusive results as in most of the statements parents made seemed to be somewhat neutral or when a one side is stronger the other side is still relevant. This can be seen in the table below and in more detail in appendix 20.
Please see the table presented in the next page for a further understanding.
5
Groups sports include: soccer, volley, basketball, handball among others. These sports were grouped as such as most parents did not fully describe which sport rather just putting group sports.
Table 1: Parents Perceptions
4.3
Combined analysis
The information provided by both parents and children will be crossed analyzed while providing an improved understanding of the eating habits.
A child usually eats breakfast prepared by the mother. In what concerns what is eaten, firstly both parents and children agree on the most important elements of breakfast: milk, cereals, bread however children place a much greater importance of cereals than parents, this in part is related to the fact that in the questionnaire as parents had more options and parents divided bread and breakfast cereals as food eaten 3 times a week both with 17%. However these percentages were never as high as with the children. Secondly one of the main differences among parents and children is related to the daily intake of fruit, for parents this percentage is higher than 20% however for children fruit was only drawn fruit and very seldom mention eating fruit. Finally Nestum was mentioned by children as daily breakfast much more often than parents however children do not fully understand the difference between breakfast cereals and Nestum.
Now when comparing the mid-morning snack once again the most relevant food are the same bread and milk. However children place a bigger importance on biscuits 65% versus 9% of the parents. While parents had a higher percentage for fruit and yogurts than the children; which
could possibly be explained by the fact that the children might not eat these elements, preferring to eat the bread and/or biscuits.
The afternoon snack did not present much difference as bread and milk were once again the most popular however the parents tend to give more different options than the children did. As stated previously the main difference in dietary choices is regarding fruit which once again is more important to parents than to children.
Finally when comparing extra-curricular activities both agree on swimming being the most practiced activity but also languages has in both cases have a high percentage. However the information provided by the parents gives group sports more importance than given by the children this contradictory result can explained by the smaller sample of children versus adults, which may have created bias.
6. Conclusions
After analyzing the finding from both the children and parents a few main conclusions arose:
Food is not that important to children, even though children draw eating, what they eat is not as important. Especially, in what concerns the mid-morning snack, many children would eat while playing or maybe even skip it as it would take away from their recess time, albeit their parents sending them food to eat. The afternoon snack it is not like that as it is provided by the school and there is a bigger control on if the children eat.
Unlike studies made in English speaking countries, bread is a crucial element of the Portuguese diet with more than 10% of children eating bread during breakfast with this percentage increasing.
Breakfast cereals are increasingly becoming important as more and more children are brought up with them, for instance children mentioned breakfast cereals more often than parents. Breakfast cereals were introduced in Portugal during the 80‟s making it now a normal part of the diet. Besides children like to eat this types of cereal even without milk, making it more disposable and another option for children when choosing something to snack on.
Schools are having an ever increasing role in providing children with most of their daily meals, if one thinks that both parents are working it is at school that children eat, besides the morning and afternoon snack lunch is also eaten at school. This means that the dietary choices made by schools for their students are important in what children eat. This also presents a challenge for brands.
The difference in consumption of fruit is also relevant, as parents mentioned it as the second most consumed food of breakfast as it was barely mentioned by children. This could also be related to the first conclusion that children just did not find it important to mention, or then it can show a deep deficiency in children‟s dietary choices nowadays. Also it could possibly be related to a bias towards social desirability in answers from the parents.
As this work project is to seek new opportunities for Nestum to develop product innovation and based on the conclusions above, this next sections is dedicated to use the conclusions to create value to Nestum.
Nestum is a well known brand and very important to Nestlé, yet to continue being important to younger children (their main target) it is important to understand that children nowadays have very structured lives, since parents work, children spend most of their time at school or in other activities which make the consumption of a product like Nestum which is not
disposable much more difficult. It is difficult for a child to eat Nestum during recess as a liquid needs to be added. So in for instance the mid-morning snack, to consume Nestum is practically impossible.
Furthermore as the school provides the afternoon snack where Nestum could be consumed and as seen in previous Nestum advertising the child arriving home eats Nestum, this is not the reality and a potential occasion of consumption doesn‟t exist as such. This because schools do not provide such products but rather bread which is cheaper when bought in the large quantities bought by schools.
This means that as Nestum is not disposable and children don‟t go home until after extra-curricular activities, Nestum can basically only be consumed during breakfast.
Additionally as Nestum is regarded by children as a breakfast cereal and probably most likely also by parents if the two different categories were not shown, this can show that Nestum differentiating characteristics might not be fully understood by its consumers.
This means that Nestum should create a product that keeps its characteristics but is disposable more like biscuits and cereal bars. Create a product that is easily transported and will not spill out; since children did mention that at times liquid yogurts leaked into their school bags. In addition as Nestum faces only the competition of private labels maybe it should create a way to take advantage of the fact that schools are ever more important in providing food to schools, and might be interested in purchasing Nestum in bulk rather than the available packaging which is not cost effective. For this to be a reality it is important for parents to understand the benefits of such a product over its substitutes, so that parents are fully informed of the benefits of the choice made by schools.
7. Limitations and future research
Social desirable answers. One of the limitations is related to the fact as this has to do with behaviours people tend to give the answers they think society wants to hear rather than the truth. This is specially a problem when it comes to children as people think they will be judged if certain of their children‟s habits are not what society expects them to be.
The sample. The sample used was from specific area within Portugal therefore it might not truly represent the whole population. Also the sample size was small which can also lead to bias. Additionally as a private school was used in this study this too can lead to bias, as children in private schools tend to come from a higher income family.
Further Research. While analyzing the data provided by the parents in the questionnaire it became clear that in what concerns perceptions the answers were not as conclusive and further research can be done to better understand the origin of the answers.
8. References
Anderson, A.S., MacIntyre, S. and West, P. (1994), “Dietary patterns amongst adolescents in the west of Scotland”, British Journal of Nutrition, Vol. 71, pp. 111-22.
Ashley, S.R., 1998. How to effectively compete against private-label brands., Journal of Advertising Research 38 _1., 75–82.
Ayadi K, Young B. 2006. Community partnerships: preventing childhood obesity. Young Consumers 7(4): 35–40.
Bartlam, M. J. “Healthy and Light Foods – Understanding the consumer”, British Food Journal, Vol 95, No 3, 1993, pp 3-11.
Berlinski, P.,1997 „Wal-Mart Sets New Paradigm for Private Label Success‟, Private Label, July, August, 15–19.
Box v., Landman J., Children who have no breakfast, Health Education, No. 4, September 1994, pp. 10-13
Boynton-Jarrett R, Thomas TN, Peterson KE, Wiecha J, Sobol AM, Gortmaker SL. 2003. Impact of television viewing patterns on fruit and vegetable consumption among adolescents. Pediatrics 112(6): 1321–1326
Caraher, M., Baker, H. and Burns, M. (2004), “Children‟s views of cooking and food preparation”, British Food Journal, Vol. 106 No. 4, pp. 255-73.
Cavadini C, Siega-Riz AM, Popkin BM: US adolescent food intake trends from 1965 to 1996. West J Med 2000, 173:378-383.
Chan K., Prendergast G., Grønhøj A., Bech-Larsen T. (2009) “Communicating healthy eating to adolescents”, Journal of Consumer Marketing, Vol 26/1, pp. 6–14
Conners CK, Blouin AG. Nutritional effects on behavior of children. J Psychiatr Res 1983;17:193– 20 Singleton N, Rhoads DS. Meal and snacking patterns of students. J Sch Health 1982;529–34. Crockett SJ, Sims LS. Environmental influences on children's eating, J Nutr Educ 1995;27:235-249.
Cross A, Babicz D, Cushman LF. “Snacking patterns among 1,800 adults and children”, J Am Diet Assoc 1994; 94:1398-403.
Dhar, S.K., Hoch, S.J., 1997. Why store brand penetration varies by retailer. Marketing Science 16 _3., 208–227.
Dietz William H., (2001) The obesity epidemic in young children. British Medical Journal 322: 313–14. Dietz William H., Stern Loraine, American Academy of Pediatrics.: American Academy of Pediatrics
Guide to Your Child's Nutrition: Feeding Children of All Ages. 1stth edition. New York, Villard Books; 1999:xiii, 234
Donkin, A.J.M., Neale, R.J., Tilston, C. (1993), "Children's food purchase requests", Appetite, Vol. 21 No.3, pp.291-4.
Dye L, Blundell JE. Functional foods: psychological and behavioral functions. Br J Nutr 2002;88(Suppl 2):S187– 211.
Dye L, Lluch A, Blundell JE. Macronutrients and mental performance. Nutrition 2000;16(10):1021– 34 Ferguson CP: Pre-adolescent children‟s attitudes towards television commercials. Austin, Bureau of
Business Research, University of Texas at Austin, 1975
Frazao E, editor. American‟s eating habits: changes and consequences. Washington (DC): US Department of Agriculture Information Bulletin Number 750; 1999. 1-473
Frost-Anderson, L., Nes, M. and Bjorneboe, G.E. (1997), „„Food habits among 13-year-old Norwegian adolescents‟‟, Scand. J. Nutr., Vol. 41, pp. 150–4.
Gamble M., Cotugna N., “A Quarter Century of TV Food Advertising Targeted at Children”, American Journal of Health Behavior; Jul/Aug99, Vol. 23 Issue 4, p261, 7p
Gleason P, Suitor C: Food for thought: children's diets in the 1990s. Princeton, NJ, Mathematica Policy Research, Inc.; 2001.
Golldberg ME, Gorn GJ, Gibson W: TV messages for snack and breakfast foods. Do they influence children‟s preferences? Journal of Consumer Research 5: 73-81, 1978
Hastings G, Stead M, McDermott L, Forsyth A,MacKintosh A, Rayner M, Godfrey C, Caraher M, Angus K. 2003. Review of research on the effects of food promotion to children. Food Standards Agency, September, www..gov.uk/multimedia/pdfs/promofoodchildrenexec.pdf[7 October 2006].
Hoch, S.J., Banerji, S., 1993. When do private labels succeed?. Sloan Management Review 34, 57–67. Hughes, D. (ed.),1994, Breaking with Tradition: Building Successful Partnerships and Alliances in the
European Food Industry. Ashford, Kent: Wye College Press.
Jahns L., Siega-Riz A.,and Popkin B.M.,(2001); “The increasing prevalence of snacking among US children from 1977 to 1996”, The Journal of Pediatrics, Vol. 138,No. 4, April 2001
Keski-Rahkonen, A., Kaprio, J., Rissanen, A. and Virkkunen-Rose R. J. (2003), „„Breakfast skipping and health-compromising behaviors in adolescents and adults‟‟, Eur. J. Clin. Nutr., Vol. 57, pp. 842–53.
Kline S. 2004. Sedentary lifestyle or fast food culture? Lessons from the battle of the bulge, Umashankar hastri in fast food industry – issues and implications, Executive Reference Books, Institute of Chartered Financial Analysts of India (ICFAI University).
Kline S. 2005. Countering children‟s sedentary lifestyles: an evaluation study of a media risk education approach‟. Childhood 12(2): 239–258.
Koplan JP, Liverman CT & Kraak VA, eds (2005) Preventing Childhood Obesity: Health in the Balance. National Academies Press: Washington, DC.
Krishnan, T.V., Soni, H., 1997. Guaranteed profit margins: A demonstration of retailer power. International Journal of Research in Marketing 14 _1., 35–56.
Marquez Acosta M, Sutil de Naranjo R, Rivas de Yepez CE, Rincon Silva M, Torres M, Yepez RD, et al. Influence of breakfast on cognitive functions of children from an urban area in Valencia, Venezuela. Arch Latinoam Nutr 2001;51(1):57– 63
Martin, K., and K. Kubomura, 1999, "Top 100 Food Companies Worldwide." Food Engineering, Decem ber 1999, p. 26.
McNeal JU. Planning priorities for marketing to children. J Business Strat 1991;May/June:12-15.
Mela, C.F., Gupta, S., Jedidi, K., 1998. Assessing long-term promotional influences on market structure. International Journal of Research in Marketing 15 _2., 89–107.
Messinger, P.R. and Narasmihan, C.H., 1995, “has power shifted in the grocery channel?”, Marketing Science, Vol 14 No. 2, pp. 189-223
Morris, D., and Nightingale, J., 1980 “Why should firms manufacture retails brands?”, Managerial and Decision Economics, Vol 1, pp. 132-7
Moschis, G.P. (1987), Consumer Socialization: A Life-cycle Perspective, D.D. Heath and Company, Lexington, MA.
Munoz KA, Krebs-Smith SM, Ballard-Barbash R, Cleveland LE: Food intakes of US children and adolescents compared with recommendations. Pediatrics 1997, 100:323-329.
Murphy JM, Pagano ME, Machmani J, Sperling P, Kane S, Kleinman RE. The relationship of school breakfast and psychosocial and academic functioning. Arch Pediatr Adolesc Med 1998;152:899– 907.
Neumark-Sztainer D, Story M, Hannan PJ, Croll J: Overweight status and eating patterns among adolescents: where do youths stand in comparison with the healthy people 2010 objectives? Am J Public Health 2002, 92:844-851.
Nicklas TA, Elkasabany A, Srinivasan SR, Berenson G: Trends in nutrient intake of 10-year-old children over two decades (1973-1994): the Bogalusa Heart Study. Am J Epidemiol 2001, 153:969-977. Nicklas T., O‟Neil C., and Berenson G., (1998), Nutrient contribution of breakfast, secular trends, and
the role of ready-to-eat cereals: a review of data from the Bogalusa Heart Stud, Am J Clin Nutr 1998;67(suppl):757S–63S.
Nicklas, T.A., O‟Niel, C. and Meyers, L. (2004), „„The importance of breakfast consumption to nutrition of children, adolescents, and young adults‟‟, Nutr. Today, Vol. 39, pp. 30–9.
Nijssen, E.J., and H.C.M. Van Trijp, 1998, "Branding Fresh Food Products: Exploratory Empirical Evidence from the Netherlands." Eur. Rev. Agr. Econ. 25(2)(1998):228-42.
Perry CL, Story M, Lytle LA: Promoting healthy dietary behaviors. Healthy Children 2010: Enhancing Children's Wellness Volume 8. Edited by: Weissberg RP, Gullotta TP, Hampton RL, Ryan BA and Adams GR. Thousand Oaks, CA, Sage; 1997:214-249.
Pollitt, E. Leibel, R.L. and Greenfield, D., “BriefFasting Stress and Cognition in Children”, American Journal of Clinical Nutrition, Vol. 34 No. 8, 1981, pp 1526-33.
Pollitt E, Lewis NL, Garza C, Shulman RJ. Fasting and cognitive function. J Psychiatr Res 1983;17:169– 74.
Pollitt E, Mathews R. Breakfast and cognition: an integrative summary. Am J Clin Nutr 1988;67:804S– 13S.
Quelch, J.A. and Harding, D. 1996, ``Brands versus private labels: fighting to win'', Harvard Business Review, January-February, pp. 99-109.
Reniscow, K., “The Relationship between Breakfast Habits and Plasma Cholesterol Seaman, C., Woods, M. and Grosset, E. (1997), “Attitudes to healthy eating among Scottish school children”, Health Education, Vol. 1, pp. 19-22.
Ruxton C.H.S., Kirk T.R., Belton N.R. and. Holmes M.A.M, (1993), Breakfast Habits in Children, Nutrition & Food Science. No 4, July'August 1993, pp. 17-20
Sharaga SJ The effects of television advertising on children‟s nutrition attitude, nutrition knowledge, and eating habits. Dissertation Abstracts International 75 195, 1974
Siega-Riz A., Popkin B., and Carson T,. (1998), “Trends in breakfast consumption for children in the United States from 1965 to 1991”, Am J Clin Nutr 1998;67(suppl):748S–56S
Steenkamp, J.-B.E.M., Dekimpe, M.G., 1997. The increasing power of store brands: Building loyalty and market share. Long Range Planning 30 _6., 917–930.
Story M. and French S.,(2004), “Food Advertising and Marketing Directed at Children and Adolescents in the US”, International Journal of Behavioral Nutrition and Physical Activity 2004, 1:3
Story M, Holt K, Sofka D: Bright Futures in Practice: Nutrition. 2ndth edition. Arlington, VA, National Center for Education in Maternal and Child Health; 2002.
Thomas, J. (1991), “Food choices and preferences of schoolchildren”, Proceedings of the Nutrition Society, Vol. 50, pp. 49-57.
Traill B, Grunert KG, 1997 , Product and process innovation in the food industry, books.google.com Vaisman N, Voet H, Akivis A, Vakil E. The effects of breakfast timing on the cognitive function of
elementary school students. Arch Pediatr Adolesc Med 1996;150:1089 –92.
Ward S, Wackman DB. Children‟s purchase influence attempts and parental yielding. Journal of Marketing Research 9. 316-319, 1972
Ward, S, Wackman DB, Wartella E: How Children Learn to Buy. Beverly Hills, California, Sage Publications, 1977
Verhoef, P., Nijssen, E., Sloot L., 2002, “Strategic reactions of national brand manufacturers towards private labels. An empirical study in The Netherlands”, European Journal of Marketing, Vol. 36 No. 11/12, 2002, pp 1309-1326.
Warwick, J., Mcllveen, H. and Strugnell, C. (1999), “Food choices of 9-17-year olds in Northern Ireland – influences and challenges”, Nutrition & Food Science, Vol. 5, pp. 229-36.
Wesnes KA, Pincock C, Richardson D, Helm G, Hails S. Breakfast reduces declines in attention and memory over the morning in schoolchildren. Appetite 2003;41(3):329 –31.