UNIVERSIDADE TÉCNICA DE LISBOA
INSTITUTO SUPERIOR DE ECONOM IA E GESTÃO
MESTRADO EM MARKETING
CORPORATE BRAND AND FIRM V ALUE
JOSÉ MANUEL CAEIRO DO ROSÁRIO
ORIENTAÇÃO
Professor Doutor Miguel Luis Sousa Al meida Ferreira
JÚRI
Presidente: Professor Doutor João José Quelhas Mesq uita Mota Vogal: Professora Doutora Maria Mar-garida de Melo Duarte Vogal: Professor Doutor Miguel Luís Sousa Almeida Ferreira Vogal: Professora Doutora Cármen Helena Caldeira Freitas Lagcs
Corporate Brand and Firm Value
José Rosário'
Miguel A. Ferreira!
ISEG
ISCT E Business School-Lisbon
First Version: March 2007
Abstract
This dissertation a.ims to find if a strong Corporate Brami contributes positively to the market value of the firm. The sample in use corresponds to 362 US companies from
COr..·IPUSTAT database that were also considered by Fortune in 2002 to construct the
Amcrica's t-. lost Admired Companies index. The results obtained provide empírica! evidence supporting the main hypothesis of the study and are consistent with existing branding t heory, that brand activities create shareholders value by increasing thc future cash flows. The findings are robust after controlling for other variables that are known from financia.! thcory to irnpact the firm value and also after correcting the Fortune index for what is known to be the financial halo effect, i.e. by removiug Lhe effect created by the past financial pcrformance.
JEL classification: Gl4; M31
l<eywords: corporate brand, brand, firm value, social responsibility, Fortune a.nd
America's tvlost Admired Companies.
• Addrcss: Lisboa, Portugal. E-mail: [email protected]
1 Introduction
1
'Corpomte bmnding is moving beyond its concen'l. with consumers alone, to become increas~
ingly concemed with inspiring confidcnce among investors, creating a positive work
envinm-ment for employees, and protec.ting lhe communities and the envinmenvinm-ment within which an
enterprise opemtes. This shift to a bmnd stmtegy of socialt-esponsibility is a brond
manage-ment stmtegy for attmcting and retaining customers by building corpomte reputation through
lhe pmctice of cmpornte socialtY?.spon.sibility." in ](LM, Inc. Management Consultation
A significant numbcr of recent studies support the cxistence of a shift in markcting em-phasis from product branding to corporate branding (sec, for instancc, Aaker 1996, de
Cher-natony, 1999, Hatch and Schuli:G, 2001 , 2003, Keller, 2003). ln addiLion, issucs like corporate reput.ation and corporate social responsibility are gaining importance among inveslors and consumers, demanding a quick response [rom managers in what. conccrns lhe dcvelopment of these new dimensions of lhe corporate brand. lnvcst.ors and consumcrs around Lhe world,
parlicularly in Europe, are now paying addit.ional at.t.ent.ion to how a company manufacLures it.s product.s and managcs ils rcsourccs, demanding cont.inuing sust.ainabilit.y, Lhrough
atLen-tion lo cconomic, environmental, and social performancc. lf Lhe company fails lo satisfy thcse lat.est requirements its reputation can decline, anel wit.h il, a subscquenl dccrease in future salcs anel profits.
lL is thus widely acccpled lhal lhe corporatc brand is a source of compctili ve
advan-tage, by congrcgaling slrategic clemenLs like Lhe corporale mission, the internal valucs, lhe organisational culture and Lhe corporate systems and networks where it is involved (Knox,
~Iacklan and Tompson (2000)). ln this sense, the corporale brandis a multidimensional and complex construction that impact.s, and may be impact.ed by Lhe relalionship bcLwccn Lhe firm and some of its stakeholders, both internal anel externa!. Moreovcr, it is expected thal favourable associaLions with the company as a whole would reveal a more positive pcrception
as employer or iLs financial performance as observed by iLs cusLomers, iLs employees or iLs invesLors, respecLively (scc, for insLance, Aaker, (1996), Cohen (1963), Brown (1998), Berens,
van Riel and Bruggen (2002), de ChernaLony, L. and Harris (2001)).
When we lake Lhe managers perspective, Lhese issues are always seen in Lerms of an invesi-meni versus return relaLion. However, Lhe question "are brand-building acLivi Lies projecLs wiLh positi ve reLurns?'' seams, so far, unanswered. As a maLter of facL, Lhe funds for
brand-ing are increasbrand-ingly questioned by corporate boards as an anti-brand message gains power across markeLing professionals. Some authors are even supporting Lhe idea that Lhe brand is passing Lhrough a period of crisis ((Klein {2000) anel Schlosser (2001)}. BuL, may this be jusL a maLLer of uwhaL to brand'' anel noL of ''wheLher or noL Lo brand"? Should Lhe
com-panies consicler shifLing Lhe direction of its brancling activiLies from Lhe producL levei to Lhe corporatc levei? Does a sLrong corporate brand, as perccived by Lhe company stakcholders, have more than symbolic va lue? ln a time when companies like ArLhur Andersen, Enron
and WorldCom havc lcarned Lhe hard way the strategic impact of Lhe corporate brand, this paper adopts an em pi rica\ approach to ~"Plain the role of corporatc brand as a determinanL of the firm valuc.
The existing literaLure support.s that brand equity at the product levei, as well as some
particular attributes of Lhe corporate brand, have a posiLivc impact on firm value. However, there is Jack of evidcncc that brand-building activities at Lhe corporaic levei create value for shareholders. lu addition, the majority of studies Lhat focus on markcLing activi ties as determinants of financial pcrformance fail in conLrolling for other determinants of the financial variable. This sLudy aims to provide empirical evidence that corporate
brand-building investment makes sense, while it impacts first, on Lhe levei and risk of Lhe firrn cash flows and, consequcntly, on ils stock price. Therefore, corporate brand cquity is cxpecLed to provide addiiional information in explaining Lhe firm value, measured by the l bbin's Q1 ,
aflcr conirolling for other financial variables that are known as determinants or firm value.
1Tobin's Q ratio is calculatcd as thc thc markct valuc of a company, dividcd by thc rcplaccmcnt cost.s of
Thc empirical hypoLhcscs is LesLed using 362 US firms from Lhe CO!viPUSTAT database that
werc also lisLcd as "Amcrica's mosi admired" firms by Foriu nc in 2002.
This paper procccds as follows: secLion 2 reviews Lhe exist.ing liicrature; section 3 presents a conceptual framcwork and develops Lhe empirical hypothcsis; scdion 4 describes Lhe data and meLhodology in use and scction 5 tests for the relation between corporate brand and
firm value. Finally, scction 6 examines thc robustness of Lhe previous empirical findings and secLion 7 concludes.
2 Liter a ture R eview
2.1 T h e importance of Corporate Branding
Balmcr (2001) and Argenti and Druckenmiller (2003) focus their research work in defin-ing corporaLe branddefin-ing and differenLiatdefin-ing it from related concepts as corporate reputation
and corporaLe idenLiLy. Balmer (2001 ) aims in his paper to dcvclop explanaLions for Lhe confusion LhaL has been creatcd around Lhe recent domains of corporaLe idenLiLy and cor-porat.e markcLing. Namely, he enumeraLes 15 conLribuLory factors LhaL may be responsible
for Lhis puzzlcmenL. He also clarifies the relation betwccn corporaLe brand and corporaLe identiLy. Finally, he argues LhaL corporaLc branding involves Lhe conscious dccision by sc-nior managcment to distil and make known Lhe atLributes of Lhe organisaLion's identity in a clearly defined brand ing proposition. This proposiLion underpins organisaLional efforLs to
conununicate, diffcrentiate and cnhance Lhe brand to key stakeholder groups and networks. Argcnti and Druckenmiller (2003) also develop some e{forts to relate corporate branding and reputation. ln their view. corporate branding assumes prirnarily an internal dimension as being defined, build and communicated by managers to creatc cxpectations in stakehold-crs1 mineis of what Lhe company wi.ll deliver in Lenns of products, scrvices and costumer
cal-lective rcprescntation of multiple constituencies' images of a company, built up over time and based on a company's idcntity programs, its performance and how constituencies have perceived its behaviour.
ln addition to Lhe literature on the definition of corporate branding we find a set of studies on the impact of corporate branding in othcr marketing dimensions, as product evaluation, costumer behaviour or market strategies. For instance, Berens, Riel and Bruggen
(2002) find Lhat diffcrent types of associations regarding a company as a whole have different efrects on costumer's cvaluations of its products. More prccisely, thcy find that positive
associations related to Lhe company produce a positive influcnce in the qualiLy pcrception of products by its costumers, but do not inftuence their intenLions to actually buy those
products. Convcrsely, positive corporate social responsibility associations have a positive impact Lowards buying intentions but noL in Lhe perceivcd quality of Lhe producLs. Related empirical evidence may be found in a paper by Czcllar anel Pala.zzo (2004) that modcls Lhe
relationship between corporate brand values attractiveness and brand preferences. They argue that corporate brand values should positively impact product brand preferences but
that this link should bc stronger for low-self monitor costumers, than for high self-monitors. Finally, Tarnovskaya, Elg and Burt (2005) use the case of IKEA to illustrate a company's necd for a strong corporate brand in order to succecd while implementing a markeL driving sLrategy.
Among Lhe litcrature that focuses on Lhe corporate branding builcling process, Harris and de Chernatony (2001) defend Lhe need for a different management approach from Lhe
product branding, which relies much more on company's internal factors and thaL requires the involvemcnL of ali cmployces in the branding activities. They devclop a modcl Lo reduce
Lhe gap between Lhe corporate brand's identiiy and Lhe corporate rcputation and ieleniify Lhe mechanisms that facilitate a greater congruence of brand perceptions among Lhe brand team anel Lhe remaining employecs. ln Lhe same spirit of Lhe previous model , Urde (2001) develops
particular case of Volvo to illustraLe i L. HaLch and SchulLz (2001) develop a modcl to help managcrs to align the strategic vision, organizational culturc and corporatc brand image. They argue that corporate branding can be a useful organisational too! when correcUy used
in different strategic environments. Finally, they apply the model Lo the different stages of British Ainvays corporatc brand development and conclude for Lhe need of bringing the
whole organization into corporate branding.
2.2
Branding activities and financial performance
Thcrc is not much litcrature focuscd on Lhe relationship between marketing stratcgics or poli-cies and firm value, in particular, between brand stratcgies and Lhe creation of shareholders
value. Doyle (2001) develops a theory on how brand planning, in general, contributes to the company global stratcgy of crcating value for shareholders. He argues that strong brands
alfect positively the financial performance of a firm by increasing its cash flows levei and by reducing its risk. Moreover, he identifies three criticai factors determining whether a brand
will create valuc for shareholdcrs: the brand perccived quaüty, the market economics and the dcfinition of a brand straiegy to maximise cash flows . Kcrin and Sethuraman (1998) focus on the particular case of ihe US consumer goods companies while studying Lhe relationship
between brand value and shareholder value. They providc empirical evidence that consumer goods' firms with high brancl values have higher market-Lo-book ratios, arguing ihat finns'
accumulated brand valuc cxplain as much as 40 percent of ihe variation of iLs markei-io-book ratio. A Madden, Fehle and Fournier (2002) working papcr provides addiLional cmpirical evidence on this rclation by demonstrating the link between brand value ru1d financial per-formance as measured by stock returns. Thcy compare groups of companies aUending t,o its
brand building activities to see if compan.ies with strong brands outpcrfonn the benchmark.
This positive rclat.ionship bct.ween brand acLivity and valuc crcat.ion has also been demon-st.rat.ed for some particular aspecis t.hat. are pari of Lhe complex corporat.e brand concept,
such as innovat.ion, qualit.y percept.ion or consumer satisfaction. The mosi not.eworihy study is a paper by Aaker and .lacobson (1994) ihai finds thai cusiomers' perceived quality contains incremental information to ihat reflected in fmancial st.atements, in order Lo explain future
firm financial performance. They use an indicator of perccived produci qualiiy as a proxy for brand equity and stock price infonnation to mcasurc firms' value. The tesi uses a panei
of 34 publicly traded firms for 1991 and 1993. Pauwcls, Silva-Risso, Srinivasan and 1-Ianssens (2003), while studying Lhe innovation wiihin Lhe US automobile industry, conclude that Lhe
introduction of new products has a positive impact bot.h on Lhe top (sa\es) and bottom line (profit) of firms' financial performance.
Anderson, Fornell anel Lehmann (1994) also corroborate Lhe role of quality and customer satisfaction as detcrminanis of financial performance, by preseniing cvielence from Sweden .
Their findings supporL a positive impact of quality in customer satisfact.ion and, in t.urn, profitability as measurcd by Lhe rciurn on invcstment..
3 Conceptual Framework and Empirical Hypothesis
3.1 Corporate Branding
The American Marketing Association defmes brandas a "name, tenn sign, symbol , or design, or a combinat.ion of t.hem int.ended to ident.ify the goods or serviccs of onc seller· or group of
sellers and t.o different.iat.e Lhem from Lhose of t.he compet.it.ors" . ln analogy, a firm engages in corporate branding when it. markets Lhe company itsclf as a brand. Corporate Brand
of internal resources and Lhe interacLion with diffcrent stakeholders thai create a cohcrent
corporatc brand imagc (de Chern aiony (1999)).
Aaker (2004) defines corporaie brand as ihe brand ihat represents Lhe organization anel t.hat is built. primarily by organizat.ional associations. The corporate brand will t.hus define
t.he firm that will dclivcr, and st.and behind the offering that. t.hc customers will buy and use. Additionally, he identifies the following sei of characLeristics that are intrinsic t.o the
corporate brand:
(a) Heritage: corporatc brands can bencfit from going to iis roots ;.md identifying whai
madc them spccial anel successful in t.he first placc. Typically, corporatc brancls have roots t.hat are richer anel stronger than produci brancls.
(b) Assets and capabilities: by communicating its corporate brand, a firm brings lo t.he market Lhe perception of having assels and capabilities in terms of creating value for
customer and delivering innovative products.
(c) People: people in an organization, in particular for services companics, are t.he basis of
corporat.e brand image. The aLtitude anel culture t.hai is intrinsic to corporate brand
will be standing behind Lhe actions of the company's employees.
(d) Valu es and ]Jri07-ities: lhe very essence of a company is what ii considers importani, thai is to say, its valucs and priorities. Tnnovaiion, qualiLy and customer conccrn are
Lhe three values and prioriiies thai are most frequently adoptcd as dri vers of corporate
brand:
a. Jnnovation: a firm thai develops its reputation Lhrough innovativcness enhances
b. Per"Ceived quality: when we talk about perceived quality we are asking if the
finn delivcrs on iLs brand promise with reliability, if it stands behind its offer-ing. Perccivcd quality was already shown to have a positive impact on rcturn on
invcstmcnt.
c. Cu.stomer concer"Tt: ii is a valuc that lhe majority of finns expecL Lo achieve, by
treating costumers with Lhe highest respecL and defining cusLomer experience as
a top priori Ly.
(c) Local vs. global m·ientation: something that may strongly affect customer relationship
is whether lhe organization assumes a local or a global orientation. On one hand, by assmning a local oricntation lhe corporate brand can benefit mainly in two ways.
Firstly, becausc customers usually take pride in successfullocal companies and express that pride in a purchase patlern. Secondly, because customers can idcntify themselves with a company Lhai adopts a local culture. On lhe other hand, by assuming a global
orientation, and achicving a global visibiliiy, Lhe corporat.e brand will benefit from lhe prestigc and respecl thai ali the brands reach by having madc it globally.
(f) Citizenship: people and organizations prefer to do business with people and
organiza-tions they admire. What kind of people and values are behind lhe company? Does Lhe company have any sociaJ concern about Lheir employccs, thc communi ty or Lhe
en-vironment? This citizcnship dimcnsion is branded Lhrough Lhe corporatc brand itself and it is gaining importance in lhe minds of customcrs, suppliers, investors and lhe
community in general.
(g) Corpomte pe1jormance: the corporate performance, its size and Lhe quality of managc-menL is oftcn seen as a guaranty of competence and staying power. Large cornpanies
wilh a visible good performance are perceived by customers as being around to provide
Assuming Lhese muiLiplc dimcnsions, sLrong corporaLe brands are Lherefore important asseis to companics, providing cohesiveness and credibilit.y to new products and venLures in
an environmenL where consumers, invesiors and employees are overwhclmcd wit.h choices.
3.2 Corporate Brand and Shareholder Value
The modern fmance theory ag:rees Lhai Lhe financial market value of a firm arises from the net present value of its futures ca':ih flows, which are generated by its tangible and intangiblc
assets (Copeland, Keller, and Murrin 2000).
Brancls in general and cor porate brancls in particular, ru·e intangible assets, with economic
value, in Lhe sense thaL a firrn is worth more with brands than wiLhouL Lhem. Moreover, it is reasonable to assume then that firms with successful and established brand names
can gcnerate future earnings and cash flows over and above Lhe firms with unbranded and generic product.s or scrvices (see, for instance Simon and Sullivan (1993)). The value of a brand should be derived, therefore, as Lhe incremental cash Aows t.hat are gencratcd from
associat.ing a well cstablish and strong brand t.o a cCI·Lain product or service.
As any other intangible asset, the value of a corporate brru1d should manifest itself in
sha.reholder value, assuming tha.t capital markets assimilate the information contained in Lhe corporate brand . This assumption relies on the "efficient capital markets hypothcsis",
which defends that Lhe market value of a firm fully reflects ali availa.blc information that may impact on a firm's cash flow and so on shareholders' value.
Doylc (2001) develops a thcorctical model a.bouL how brands conLribute to a firm's sLrat-egy and how brand pla.nning needs to be geared to firm value. He argues Lhat value creation occurs mainly through two ways: by increasing t he levei of the company cash flows or by
reducing its risk. ln what conccrns to the corporate brand, we may cxpect Lhe firm cash
flows to be impacted in the following wa.ys:
(a) Di.f[erentiation: The corporate bra.nd can be more easily diffcrentiated from other
similar. This differentiation is achievcd through thc organizal.ional associations and bccome relcvant for customcrs and are Lranslatcd into a purchasing pattern, increasing
the firm's cash in flows.
(b) 01yanizational progmms: The corporate brand can draw on organizational programs that provido encrgy to product brands. Moreover, these corporate programs are often strongcr than product brands when we talk about ciLizcnship or sponsoring. These
kind of programs are known to be connccted to loyalty/retention and trust feelings from customcrs, which is in tum may not only positively impact Lhe levei of cash
flows, but also smooth thcm, decrcasing Lhe firm's risk.
(c) Positive association.s and cn~dibility: Corporate brand associations can providc organi-zational crcdibility. For instance, a trustworthy organization will be givcn Lhe benefit
of doubt, a company will bc particularly likcd for its citizcnship activities or social responsibility, and an expert company will be seen as competcnt in making and selling
its particular type of products. ln addition, trust is a quality that is easier to attach to an organization, which is made of people, than to a product. Purchasc dccisions but
also financing decisions to be takcn by creditors or investors, as well as Lhe launch of new projccts may be facilitated and positively influcnccd by organizational credibility.
(d) Bmnd management: ai the brand management levei, a company with a strong
corpo-rate brand may benefit from leveraging it across it.s products and markets. Thc brand management process bccomes casier, more effective anel more efficicnt, cnabling the
company to reduce some costs and therefore cash out flows.
(e) Pnxluct bmnding vs. corpomte bmnding: strateg1cally combining the corporate brand with the product brand companies may add value as well. The message provided by
thc corporate brand may be different frorn that of product brands, but it must still be coherent. This can be used, for example, by extremcly valued, established anel reliable
corporate brands that are also perceived as boring anel out to date. Thc solution is to
use Lhe cm·p01·ate brand Lo represent Lhe heritage and Lhe product brand to inject some energy. This strategic management of Lhe different brand leveis will add a degree of
freedom while deaüng with Lhe customer, maximizing t.he positive aspects of a firm's brand portfolio and minimizing Lhe negative ones.
The theoretical arguments present.ed abovc make us cxpect a positive relation between Lhe strength of acorporate brand and Lhe shareholders' value. ln particular, we c..xpcct a company
with a st.rong, successful and well estabüshed corporatc brand to cvidence incremental cash Oows through highcr Tobin 's Q anel result.ing greater shareholdcr valuc.
Finns with stmnger· cmporate bmnds (firms with high Fortune's index), should pn~sent
higher· Tobin's Q mtios than finns with weaker corporate brands (firms wilh low Fortunets
index): when contmlling fm· othe1· variables that are k-nown to irnpact firms' value.
4 Data and Methodology
Empirical testing of the above hypothesis is based on a sample of 362 US-bascd pubücly traded firms from thc COMPUSTAT Industrial Ammal database, that. were also considered
by the ~< fortun e" magazine to construct its 2002 ranking on Lhe "America's 't-.1lost Ad mired
Companics".
Fortunes' "America's Most Admi red Companiesn ranking is obt.ained from a survey of top managers at 582 companics with the largest. revenues in each sector. Exccutives,
di-rectors and securit.ies analysts, in a t.ot.al of 10,000, rate companies wit.hin their industry on eight different attribulcs: innovativeness, ernployee talent., use of corporatc asset.s, social
responsibility, quality of management, financial soundness, long-term investment value and quality of products and services. Participants are asked t.o rate the companies on a scale between zero (poor) and ten (excellent) on each of Lhe eight. attributes. Then, the eight
scores are averaged to arrive at. a final score.
4.1 Tobin's q
Tobin's q is Lhe dependent variablc used in Uüs study.
r
use Lhe markct.-to-book ratio as an approximation of 1bbin 's q , wltich in turn is a proxy for firm valuc. This proccd ure iscommon in Lhe liLeratme 2 . tvloreover, evidence provided by Allayan nis and \Vest.on (2001) shows t.hat. severa! measurcs uscd Lo proxy Tobin's q are highly correlat.ed wit.h each ot.her
and also highly correlat.ed wit.h Lhe market.-to-book rat.io used here. The markcL-Lo-book raLio is computcd as Lhe raLio bct.wcen Lhe market. value of asseis and Lhe book value of asseis. The market. value of asseis is det.ermined by Lhe book value of asseis, less Lhe book
val ue of equit.y, pl us Lhe markeL value of equity. I used Lhe markcL value of cquit.y ai Lhe end of Lhe calendar year. T his variablc is obscrved in Lhe year 2002.
4.2 D efinition of exogenous variables
\;ve use two types of exogenous variables: frrm specific financial variables and a corporate
brand strengt.h mcasure.
4.2. 1 F irm sp ecific financial variables
ln order to infcr if corpora.te brand strengt.h increases the firm valuc we nced to exclude Lhe cffect of all the other variables that may impact Tobi n's Q. The fmn specific financial
variables in use are, thercforc, t he ones considered by thc literature to be deLenninants of
the firm val ue and will have the role of controlling for the financial eiTccts. ln particular, I am using the variablcs proposed by Allayann.is and VVeston (2001) while studying the impact of the use of derivative<; in lirm value (Tobin's Q). Ali the finn spccific financial variables
presented below are computcd as the average of the years 2000, 2001 and 2002.
(a) Size: there is no consensual evidence for US fi.rms about the way in which size impacts
2Scc for instancc Ooidgc, Karolyi , and Stulz (2003) for a study on cross-listing, Lung and Stulz (1994)
and Scnacs (1996) for oorporatc divcrsification, (Servacs (1991) for takcovcrs and Allayannis and Wcston (2001) for risk managcmcnt.
fi.rms ' profitability3 . 1-Lowever, sincc that in many studies ii scems to have asignificant. impact on finns' val uc, l'm including Lhe firm's size, calculated as Lhe nat.urallogarithm
of Lhe book value of total asscts and accounting for inflation by using 2002 priccs.
(b) Profitability: a more profitable firm is considered to be traded ai a premium in
corn-parison to a less profit.ablc onc. ln this sense, I expect this variablc Lo havc a positive impact. in Tobin's Q. Ret.urn on asseis (ROA) is Lhe measure chosen for profiiabiliiy
and is comput.ed as EDITA over total asseis.
(c) Levemge: Lhis variablc is used Lo account for difrercnces in Lhe capital structurc of
firms, which is known, sincc Lhe seminal work of Modigliani and tvliller {1958), Lo irnpact. Lhe Hrrns' value. Leverage hcrc is cornput.ed as total dcbt. over total asset.s.
(d) Investment qrowth: Myers {1977) argued, and ii is until now well acccptcd, ihat. firms' value also depeneis on its future invest.ment opport.unities. ln this study l'rn considering
iwo variables to proxy invest.ment. growt.h. The first. variable is capilal c.xpenditures {CAPEX). This variable is measured using the rat.io of capital expenditurcs over net.
asseis. Research and developrnent spending (R&D) is Lhe oihcr variable uscd to proxy future invest.rnent. opport.unit.ies, but. it also proxies a firm's int.angible asscts as
t.ech-nological know-how and expert.ise. This is an imporiant control in ihis study in the sense t.hai it. allows conirolling for the effect. of intangiblc asseis ot.her than corporate
brand. Given ihat a considering pari of firms in Lhe sample did not. report t.his item the missi ng values were treated as zero investmeni in R.&D. This proccdurc is common
to ot.her studies that. use Lhe CO!viPUSTAT data.
(e) Access to financing: Lhe abilit.y of a firm to access to financial markcls may impact.
its Tobin's Q in the sense that. if a frrm has limitcd access to financing, rnanagers will have to choose which project.s to finance and t.hus will undert.akc only profit.able
project.s. Therefore, we expect t.hat. access to finaucing leads to a decrease in Tobin's
3Mucllcr (1987) providcs a summary of thc litcraturc on this issuc.
Q, since othcrwise finns will geL funds only for projects with unquestionable positive
net present value (NPV). ln order Lo mcasure thc r1rms' access to externa! financing I use a dividend dummy, which is a variable scL to one if the firm paid a dividend in any of thc years 2000, 2001 or 2002 and set Lo zero if it did not. If a firm has paid dividend
in one of these years, it is less likely to be capital constrained during this pcriod and may therefore have a lower Tobin's Q. Conscquent.ly, it is expcctcd a negative relation between Tobin's Q and Lhe dividend dununy.
4.2.2 Cor porate bran d strengt h va.riable
Corporate brand strength is mea.':iured using the ovcrall sc01·e obtained by each company on Fortunes' "America's Most Admired Companies" ranking. This score is thc avcrage of the
scores on ali cight individual attributes: innovativeness, employee t.alent, use of corporate assets, social responsibility, quality of management, financial soundness, long-term
invest-ment value and quality of products and services, as perccived by participants in the survey. These attributes are repeatedly referred in Lhe literaturc to constitute different dimensions
of the corporate brand concept.
4.3 Descriptive statistics and univariate tests
Table 1 reports thc summary statistics for the variables in use in this study for the full
sample of firms, in a total of 362 observations. Firms in this sample have a mean size of 8.56 (median of 8.46) in tenns of Lhe normalized variable, what corresponds to approximately
$5,225 million. On average, the return on assets is 12.8% and the lcverage ratio 67%. lnvestment growth is measured by R&D expenses with a mean of 1.5% and CA.PEX with a mcan value of 12. 7%, with both measures computed as a percentage of firms' assets. The
mean Tobin's Q is 1.53 (median of 1.27) which is similar to other studies such as, for example, Allayannis and WesLon (2001). The mcasure of corporate bnmd strength (CBS) given by
Fortune's America's most admired companies ranking varies in Lhis sample belween 1.1 and
8. 7 points with an average value of 6.1.
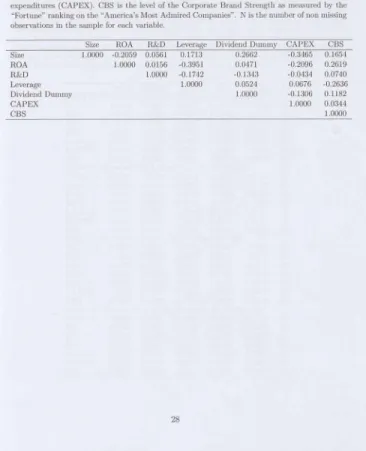
Table 2 shows Lhe corrclation bctwecn indcpcndcnt variables. The corrclation coefficients
are, in general, low and Lhe highest correlation, in absolute value, occurs bctween Lhe vari-ables return on asseis and leverage, but does not cxceed 0.4. Considering the most innovativc variable in this study, corporate brand strength, the highest correlations with this variable
are no greater than 0.26 in absoluto value and occur with respect to Leverage and ROA. This is rathcr important for Lhe robustness of our regression results on thc significance of Lhe cor-porate brand strength cocfficient. H is also shown that corcor-porate brand strcngth is positively
correlated with a!! Lhe rcmaining indcpendent variables, with exception for leverage. Table 3 presents univuriate tcsts of Lhe hypothesis that corporate brancl strength is
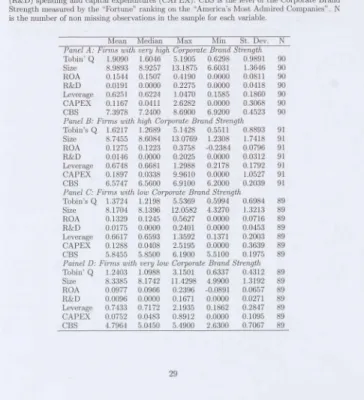
pos-itively related to firm value. First, 1 split the sample into quarters accordi ng to Lhe levei of corporate brand strcngth. Thc companies considered to have a very strong (weak) corporate
brand strcngth are Lhe one; iu Lhe top {bottom) quarter of Lhe sample (Panei A and D, respectively). The companies considered to have strong (weak) corporate brand are the ones i.n the second (third) quarter of the sample (Paneis B and C, respectively). Thcn, I compute
the descriptive statistics of Lhe following variables across firm groups: Tobin's Q, Size, ROA, R&D, CAPEX, Levcrage and CBS. Co.nsistent with this study's hypothesis, firms with Lhe
strongest corporate brand, in the top quarter, are also the ones with thc highc.'st Tobin's
Q value (both speaking in tcrms of mcan and median). MoreOVCl\ the average Tobin's Q increases monotonically across quarters: finns in the fi.rst quartcr have the lowest Tobin's Q mean (1.24), firms in the second quarter have Lhe second lowest Tobin's Q mcan {1.37), in Lhe third quarter firms have the sccond highcst mean (1.62) and finally, in the last quarter,
firms have the highcst Tobin's Q (1.91). The sarne pattern occurs when we compute Tobin's Q median across the quarters.
Analysing now the remaining variables across paneis, we can sce that, on averagc, firms with stronger corporate brand are bigger, have higher Return on Asscts and higher CAPEX,
and i.nvest more in R.&D. Although, there is not a monotonic incrcasc of these variables
across quarLers , as for Tobin 's Q, a similar paLLern can be infcrrcd from Lhe comparison beLween Lhe firsL and Lhe fourLh quarLers. The firms in Panei D (firsL quarLer) have, on
average, a size of 8.34, a ROA of 9.8%, R&D e.xpenses of 0.1% and CAPEX of 7.5%, while Lhe firms in Panei A (fourLh quartcr) have, on average a size of 8.99, a ROA of 15.4%, R&D expenses of 1.9% and CAPEX of 11.7%. Finally, Lhe only variable wiLh a negative relation
wiLh CBS is leveragc, and we may verify Lhat firms wiLh very high CBS are Lhe ones with Lhe lowest leverage ratio (62.5%, on average) and that firms with very weak corporate brands are the ones wiLh highest levcragc ratio (74.3%, on avcrage).
Overall, Lhese univariatc Lests provide first evidence supporLing Lhe main hypothesis thaL a strong corporatc brand conLributes positively Lo Lhe creaLion of value for shareholdcrs.
Moreover, iL provided useful infonnation on the characterization of finns wiLh different lev-eis of corporaLe brancl st.rength, in t.errns of size, profit.abilit.y, growt.h anel risk, which are
characteristics that. are also known Lo be relaLed t.o Tobin's
Q.
ln this sense, thc multivariate t.ests to be performed in the next scct.ion will be deLenninant to understand if there is a true and robust relaLion between corporat.c branding and t.he value of t.he firm.5 Empirical R esults
ln order to t.est. the impact of corporat.e brand strcngth in t.hc valuc of a firm I ran a sct of
regressions using firms' Tobin's Q as Lhe dependent variable anel corporate brand strengt.h as one of t.he e.xplanaLory variables, cont.rolling for additional itcms LhaL are known Lo be
determinants of firms' valuc, as suggested by previous LheoreLical and em pi rica\ work in Lhis are..'\. Namely, anel following Allayrumis ru1el \Vest.on (2001), I am cont.rolling for t.he following factors: (1) size, by using t.he log of total asseLs as a proxy; (2) profit.ability, by using ROA as
a proxy; (3) invest.ment growth and intangible asseis, by using as proxies t.he ratio of capital expeudit.ures to asset.s (CAPEX) aud the raLio of R&D to asseLs; (4) lcveragc, by using t.he
ratio of total debt. Lo total assets; and (5) access to financial markcts, by using a dividend
dummy as a measure of Lhe fi rm's abiliLy Lo obLain and acccss ext.crnal financing. The dependenL variable used in ali Lhe regressions is Lhe naLural logariLhm of Tobin's
Q raLio observed in Lhe ycar 2002. The logariLhm is t.aken herc in order t.o normalize t.he dependcnt. variablc. Thc remaining accounting variables described above are comput.ed as
t.he average for t.hc years of 2000, 2001 and 2002.
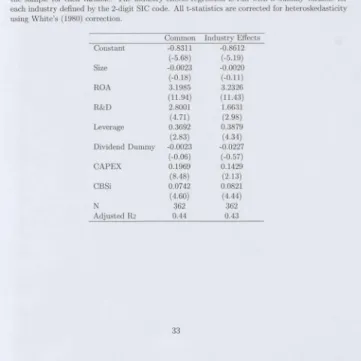
Table 4 report.s on t.he rcgrcssion rcsults for t.he full sample of firms using ordinary least. squares (common) and indust.ry effect.s regression met.hods. To run t.he indust.ry effect.s
regression met.hod I includcd a dummy variable for each indust.ry, defined by Lhe 2-digit. SIC code. This part.icular procedure aims to control for industry specific effects on finn's Tobin's
Q not bc add ressed by any of the other explanatory va.riables as they are firm specific. On bot.h regressions t.he findings support t.he hypothesis that a st.rong corporat.e brand contributes posit.ively Lo firms' v-alue. ln fact, t.he CBS variable has a positive anel st.atistically
significant cocfncient of 0.07 in thc conunon regression anel 0.08 in the indust.ry cffccts one. This is consist.cnt with the theoret.ical model proposed by Doyle {2001), in which a strong
brand may add valuc for thc shareholders in the sense t.hat it impacts positively thc cash flows of a firm. The rcsult. is also in line with t.he previous empirical resull.s obtained by I<crin
and Sethuraman (1998) and Madden ct ai. (2002) whilc linking branding value with financial performance. ln addition, both models have a very good explanat.ory power of 1bbin's Q, as report.cd by thc adjusted R squared t.hat. t.akes the valuc of 44% in thc common regression
and 43% in the inelustry effects one.
For most of thc cont.rolling variablcs I find statistically significant. rcsults as well as
the sign predicted, with exception for sizc and dividend dummy. As explained before, the
size effect on firms' value is rathcr ambiguous, which may explain the negative and non significant coefficient values found for both regressions. Moreover, this negative rclat.ionship between size and Tobin's Q, suggests that small finns deliver highcr shareholder values,
which is consistent with the results found by Allayannis and West.on (2001) and by Lang and Stulz (1994) in a paper that looks at Tobin's Q and diversification at the firm levei. ln
what conccrns t he dividcnd dummy, the sign of its coefficient is negative, as prcdictcd, but
not staList.ically significant.. This supporLs lhe hypothesis that firms wiLh beLter access to financial markets, i.c. wit.hout financing constrainLs, have lower Tobin's Q and so the variable is only econornically significant. The remaining variables, as said, are both statistically and
economically siguificant.. Similarly to Lang and Stulz (1994) and Allayannis and \tVcston (2001), we find Lhat more profitable firms, as captured by ROA, are more valuable; finns with more leverage havc highcr Q values a<:> well, which is consistent with t.he theories defending
the monitoring benefits of dcbt; and finally, tbat there is a positive relaLionship between a strong invcstment growth, as proxicd by CAPEX and R&D expcnses, and the market va\ue
of a firm as mcasured by iL's Tobin 's Q.
The result on R&D variable is particularly relevant in order lo conclude that the corporatc brand mat.tcrs to value creation for shareholders. This isso, because this variable is supposed
to capture lhe effect of other intangible asseis in the value of Lhe firm, and by including it, we are contro!Ung for thosc and thcrefore guarantying that the corporaLe brand strength variable is capturing it.s own effect and not the effect of any other intangible asseis.
Table 5 reports Lhe regression results using two sub samples of firms dividcd by corporate brand strength levei. More precisely, a finn is set to have high (low) corporate brami strength
if it is ranked abovc (bclow) thc mcdian. The most relevant result obtalned here is that for low CBS firms, the CBS variablc is positive but has no statistical significance. For the high
CBS firms, however, the CBS coefficient is sti\1 positive and significant. Thc main conclusion from this result is that CBS is more rclevant as a firm value predictor, for fmns wiLh stronger corporate brands. Regarding the rcmain.ing independent variables, only the variables with ambiguous predicted coefficient signs, such as size and dividend dummy, have diffcrent signs
across the sub samples. The coefficient.s for these variables on both paneis and models are noi statistically significant.
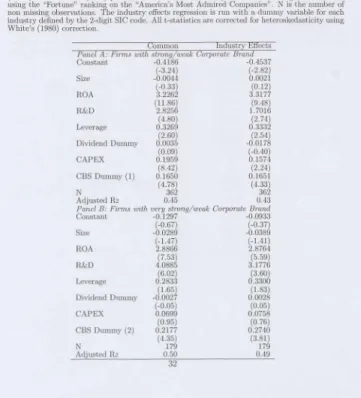
Table 6 shows the regressions resulls predicting fums' value on different leveis of corporate brand strengt.h. Both the ordinary leasi squares and the industry effects regression contain
t.he sarne dependent. anel independent. controlling variablcs uscd in t.he prcvious regrcssions. ln order to measure thc diffcrences bet.ween finns wit.h st.rong and weak corporale brand,
while ex plain ing lhe firm value, I const.rucled lwo corporalc brand slrength dummy variables (CBS Dununy (! ) and CBS Dummy (2)) . The CBS Dummy (I ) is a variable sei to one if a firm is considered l.o have high corporale brand strengt.h and zero if nol. More precisely, a
fum bas high (Jow) corporalc brand st.renglh if il has a levei of CBS highcr (lower) t.han the median. The CBS Dummy (2) is a variable set to one if a firm is considercd lo have very high corporat.e brand st.rcngth anel zero if il is considered to have very low corporate brand
st.rength. ln t.his case, a finn has very high (low) corporate brand strength if it. has a levei of CBS higher (lower) t.han lhe 75th (25t.h) percentile.
ln t.he first. panei I use Lhe first CBS dummy to distinguish firms with diffcrent leveis of CBS. Bot.h the common and the industry effect regressions have st.rong results supporting that firms with differcnt leveis of CBS have, ali else constant, different leveis of firm value.
ln fact, for firms with high levei of corporate brand strength this variablc explains 16.5% more of the value of the firm than for firms with low corporat.e brancl strength, whcn we
split the sample using thc median.
\hfhen we consider just the companies in the boLLom f.md lop quarters of Lhe sample
(panei B) t.his difference is even stronger, and the coefficient for the CBS dummy assumes the value of 22% in the common regression and 27% in the industry effects rcgrcssion. This result provldes further evldence in favour of the argument that firms wiLh a st.rong strengLh
of its corporate brancl are able to create adclitional va1ue to Lheir shareholders, since t.his suggests that. Lhe cffcct of corporate branding is self reinforcing.
Regarding Lhe conLrol.ling variables, in general, I obtain similar results to Lhe full sample ones. ln the first panei, and accorcling to the results predicted, I find significant evidence that more profiLable firms wi.th grmvlng investments and lower lcverage are thc ones with higher Tobin's Q. More preciscly, ROA, R&D and CAPEX have positive and statistically
significant coefficients while explaining firms' value. Leverage has a negative significant
coefficient., suggest.ing t.hat. firms wit.h higher debt. t.o asseis rat.io are less valuable. Again, size and dividends payment. are not. significant. and surprisingly bot.h variablcs have opposit.e
sig:ns i:n t.he commo:n and indust.ry cffect.s regrcssions.
ln panei B, when wc use jusi fim1s 'vit.h extreme valucs of CBS we st.ill obt.ain similar result.s on controlüng variablcs. Alt.hough not. stat.ist.ically significant., t.hc size coefficient.
is, as in t.he full sample t.cst.s, negative suggest.i:ng t.hat. small firms havc higher Tobin Qs. The leveragc and profit.abilit.y vm·iablcs rcmain economically and st.at.ist.ically significant. in bot.h regressions, while one of t.he proxies for invest.me:nt. growt.h , CAPEX loses it.s
statis-t.ical significance. Thc H.&D expenses coefficient ha':i the same predicted sign and remains
st.atistically significant.
ln what concems to thc explanatory power of t.bc models uscd, I can sce that all the models have strong adjustcd R squares. The regression modcls in Panei A are able to explain 43% of firms' value, considering indusiry effects and 45%, in the common regression.
The modcls in Panei B are even more powerful, being able to cxplain 50% of Tobin's q, in the co1mnon regrcssion and 49% in the industry effect.s rcgression.
6 Robustn ess
Brown and Perry (1994) and Fryxell and Wang (1994} argue that Fortune's annual rati:ngs of
America's most admired companies are hcavily influenced by the previous financial results. They suggcst. that research using t.his data is affect.ed by a halo effect that. should be removed
bcfore any mcasure can be appropriat.ely used to proxy corporat.e brand strength. Howcvcr, evidence agains t. ihis vicw is providcd by Cordeiro and Sambharya (1997), who found that
a non-financial componcnt. of Fortunc's index obtained after partialling-out ihc financial halo from scores significantly and positively influcnced sccurity analyst forecasts of future carnings. Also Dunbar and Schwalbach (2000) in a study of Gennan companies find no
evidence of t.he exisicnce of a financial halo efTect.
ln Lhis seclion and in order Lo test for Lhe robustncss of rny previous rcsu!Ls I follow a proccdure in Lhe samc spiril Lo Lhe one suggested by Brown and Perry and used by Cordeiro
and Sambharya (1997) and Cordeiro and Schwalbach (2000).
ln these additional regressions lo predicl lhe finn value I use an adjusled measure of corporale brand st.rength correcled for Lhe financial halo effecl. f\ lore precisely, lhe adjusled corporatc brand strength is obtained by using an instrumental variable and a two stage
least-squares methodology. ln ordcr to obtain a consistent estimator for corporate brand strength and overcome the eventual endogeneity of the model, I use thc participation of the
firms in thc index S&P 500 as an instrument.
By usi ng the ins trumental variable methodology, I expect to capture Lhe isolated con-Lri bution of oorporate brand Lo fi nn value, since this new measurc cxpurgates any financial
effect that could be contained in the Fortunes' global index.
Table 7 shows the rcsulls for thc full sample, predicting firms' value on corporate brand
strength, using Lhe instrumental variables methodology in a two slages least-squares re-gression. The results using Lhis methodology Lhat accounts for Lhe endogeneiLy of Lhe model
strongly sustain the results previously obtained by simply regressing the firm value on corpo-rate brand sLrength. ln fact, Lhe positive and significant coefficient on the corrccted measure for corporate brand strength provides additional evidence supporting Lhe hypoLhesis that firms wiLh strongcr corporate braJl(ls evidence highcr shareholders' value, measured by their
Tobin's Q.
The instrumental variable I use is a dummy variable set to one of Lhe firm is par t of
S&P 500 in 2002 and zero oLhenvise. This variable is used in an auxiliary regression LhaL has corporaie brand strengLh as indepcndenL variable and S&P parLicipation and al1 lhe
ad-ditional firm specific attributes (size, leverage, profiLability, access lo markets and growLh) as independent variables. ln a second stage Lhe fitLed values obtained in this rcgrcssion are
used in substiLution of the corporate brand sLrength measured used in the previous regres-sions. As I already said Lhe oocfficient on oorporate brand sLrength is positive and significant
and presents no difference for common regression ru1d industry effecLs meLhodology. \ViLh
respecL to controlling variables I obtain similar coefficients to the ones obtained before, with Lhe unadjusLed global ForLune's index. Both size and dividend dummy remain negative and non-significant. Ali Lhe other controlling variables present Lhe expected sign wiLh sLatistically
significant coefficients thaL are similar to Lhe ones obLained before. Thcsc results sustain Lhe robustness of our previous conclusions to an eventual cndogenciLy of Lhe model generated by
Lhe variablcs firm valuc and corporate brand strength .
7 Conclusion
This paper tests empirically if a strong Corporate Brand contributes positively to the market value of a firm. Previous studies relating marketing activities with the crcation of
share-holder valuc had focused primarily in product brands and fail to contrai for other financial variables. The main contribution of ihis paper to Lhe exisLing literature is precisely the
focus on corporate brand and Lhe use of financial controls whilc tcsLing the hypot.hesized relationship.
Using a sample of 362 US firms, I find strong cvidencc that firms with superior corporate
brands create additional sharcholders' value. This result is consistcnt with cxisting branding theory, which argues that brru1d activities at thc product levei add valuc to the fi nn by
increasing the levei of cash Oows and rcducing their future risk. The findi ngs rcmain robust after correcting the Fortune index for Lhe financial halo effect, using an instrumental variable.
References
[1] Aaker, David A., (1996), Building sl.rong brands, New York: Frce Press.
[2] Aaker, D. A., and R. Jacobson , 1994 , The financial information of perceived quality,
Jounwl oj Mmketing Research, 31 , 191-201.
[3] Allayannis, G. , and J. Weston J, 2001, The Use of Foreign Currency Derivatives and
Firm Markei Valuc, The Review of Financial Studies, 14, 243-276.
[4] Andersen, E. W. , C. Fornell, and D. R. Lehmann , 1994 , Costumcr satisfaction, markei share and profitabiliiy: findings from Sweden, Journal o[ Mwketing, 58, 53-66.
[5] Argenti, P. A. and B. Druckcmnillcr, 2003, Reputation and lhe corporate brand, working
paper, Tuck School of Business ai Dartmouth.
[6] Belmer, J. M. T. , 2001, Corporate identity, corporate branding and corporate marketing,
Eu1'0pean Jountal of Mm·keting, 35, 248-291.
[7J Bercns, G., B. M. vru1 Ricl B. M. and G. Bruggcn, 2002, Thc addcd value of corporate brands: whcn do organisational association affect product evaluation, working papcr,
Erasmus Rcsearcb lnstitute of Management.
[SJ Brown, T.J. 1998, CorporaLe associations in marketing: anteccdcnts and consequences,
Corporate Reputation Review, 3, 215-33.
[9J Brown, B. , and Perry, S. 1994, Removing the financial performance halo from Fmtune's
"!\IIost Admired" Companics, Academy of Management Joumal, 37(5): 1347-59.
[IOJ Cohen, R. , 1963, The measurement of corporate images, in The corporation anel its
publics, John J.\V. Riley, ed. New York, Loudon: John Vliley & Sons, 48-63.
!llJ
Copeland, T., T. Keller, and J. Murrin, 2000, Valuation: Mcasuring anel Managing the Value of Companies, 3rd Edition, \Viley New York[12) Cordeiro J. anel R. Sambharya, 1997, Do corporate repuLaLions innucnce security
ana-lystearnings forecasLs? Corporate Reputation Review, 1, 94-98.
(13] Cordeiro J. anel R. Sambharya, 2000, Preliminary evidcncc on Lhe sLrucLure anel de-ierminants of global corporaLe reputaiions, Submission l.o LnLernaLional ManagemenL
Division of Lhe Academy of Managemeni for 2000 meeLings.
[14) Czellar, S. anel G. Palazzo, 2004, The impact of perceived corporate branel values on brand prcfcrcncc: an exploraLory empirical study, working paper, UniversiLé de Lausane École eles 1-Lautcs ELudes Commerciales.
[15] de Chernatony, L., 1999, Brand managemenL ihrough narrowing Lhe gap beLwccn brand idenLiiy anel brand reputaLion, Journal of Marketing Management, 15, 157-79.
[16] de Chcrnatony, L. anel F. Harris, 2001, CorporaLe branding anel corporaie branel
per-formance, Eumpean Jounwl of Marketing, 35, 441.
[17] Doidge, C., Karolyi , G.A., and Stulz, R., 2004, Why are foreign firms listed in thc U.S.
worih more? Jountal of Financial Economics, 71 , 205-238.
[18] Doyle P. , 2001, Sharcholder value brand sLraiegies, Jomnal of Bmnd Management, 9,
20-30.
[19) Dunbar, R. anel J. Schwalbach, 2000, Corporaie RepuLation anel Performance in
Ger-mauy."Working paper, NYU anel HumboldL U-Berlin.
(20] Duncau, T. anel tvloriariiy, 1997, Driving brand Value. New York: McGraw-Hill
[21] Fryxell, G.E. , anel J. Wang, 1994, The ForLune Corporate ''RcpuLaLion" Index: Repu-iaLion for \Vhat? Journal of Management, 20(1), 1-14.
(22J HaLch, 11. anel M. Schullz 2001 , A.J.·e the sLratcgic stars aligned for your corporal.e brand?, Harvard. Business Review, February, 129-34.
[23] Hatch, M. and M. SchuJtz, 2003, Bringing the corporation into corporate branding,
European Joumal of Marketing, 34, 1041-1064.
[24] Keller, K L., 1998, Strategic brand management: building mcasuring and managing brand equity, Upper Saddle lU ver, NJ: PrenLice Hall.
[25] Keller, K. L. , 2003, Brand synthesis: Lhe mu!Liclimensionality of brancl knowledge,
Jour-nal of Consumer Resear-ch, 29, 595-600.
[26] I<erin, R. A. and R . ScLburaman , 1998, Exploring the brancl value-shareholder value ncxus for consumcr goods companics, Joumal of the Academy of Mmketing Science, 26,
260-273
[27] Klein, N., 2000, No Logo, Canad" Alfred A. Knopf.
[28] Kuox , S., S. Maklau aud K. Thompson, 2000, Building Lhe Unique OrganisaLion Value
Proposition, in Shu!Lz, M., Hatch, M., and Larsen, M., The Expressive OrganisaLion. Linking ldent.ity, RepuLaLion, and Lhe Corporate Brand, Oxford UniversiLy Press,
Ox-ford , NY.
[29] Lang, L. and R. SLulz, 1994, Tobin's Q, Corporate diversification and finn performance,
Journal of Political Economy, 102, 1248-1280.
[30) Maddcn , T. J., F. Fehlc and S. M. Fournier, 2002, Brands maLLcr: a n empirical in-vcsLigaLion of brand-building acLivitics and the creation of shareholder value, working
paper.
[31] ~Iodigliani, F. and M. H. Miller, 1958, The cost of capital, corporaLion financc, and Lhe theory of investment, American Economic Review 48, 261-297.
[32] ~ l ueller, D. 1987, The corporation: growt.h, cliversificaLion and mergcrs, Harwood: Chur
Switzerland.
[33] Pauwels, K , J. Silva-Riso, S. Srinivasan, and D. Hanssens, 2003, The Long-Term Impact
of New Product lntroductions and Promotions on Financial Performance and Firm Value, Working paper.
[34] Schlosser, E., 2001, The fast food nation: the dark side of the all-american meal, Boston: Houghton Mifflin.
[35] Servaes, H., 1991, 1bbin's Q and t.he gains from t.akeovers, Journal oj Finance, 46,
409-419.
[36] Servacs, I-1. , 1996, Thc value of diversification during the conglomcrate merger wave,
Joumal oj Finance 51, 1201-1225.
[37] Simon, C. and M. Sullivan, 1993, The measurement.s and determinanls of brand equity:
a fmancial approach, MaTketing Science 12, 28-52
[38] Tarnovskaya V., U. Elg and S. Burt., 2005, The role of corporatc branding in a market driving strategy, Lund Institute of Economic Research, Working paper series.
[39] Urde, M., 2001, Core-value based corporate branding building, Eumpean Journal oj
Mar·keting, 37, 1017-1040.
Tablc 1: Sununary st a tistics of firm variables
TThe table presents t he dcscriptive statistics for our sample of firms. The sample includes 362 US-ba.sed publicly tradcd firms. Ali the accounting variablcs, cxccpt for thc Tobin 's q ratio that is observed in thc ycar 2002, are computed as the average of the years 2000, 2001 and 2002. The Tobin's q ratio is measured as the book value of assets, less the book value of equity, plus the market vaJue of equil.y, divided by assets. Si?..e is dcfincd as thc natural logarithm of total assets. ROA is computed as EB1TA over total assets. Leverage is total debt over total assets. Other firm variables displayed include measures of research and development (R&D) spending and capital expcnditures (CAPEX). CBS is the levei of the Corporate Brand Strength measured by the "F'ortune" ranking on the "America's Most Admired Companics'" N is the number of non missing observations in the sample for each variable.
Mean rvledian Max Min St. Deviation N
Tobin' Q 1.5349 1.2657 5.5369 0.5511 0.8183 362
Size 8.56 13 8.11614 13.1875 1.2308 1.4779 362
ROA 0.1280 0.1237 0.5627 -0.2384 0.0771 362
R&D 0.0151 0.0000 0.2401 0.0000 0.0370 362
Leve r age 0.6766 0.6669 2.1935 0.1371 0.2205 362
Dividend Dummy 0.6796 1.0000 1.0000 0.0000 0.4673 362 C APEX 0.1274 0.0409 9.9610 0.0000 0.5801 362 CBS 6.1481 6.1950 8.6900 2.6300 1.0581 362
Table 2: Correlation Matrix
The table presents the correlations between independent variables, for our sample of 362 US-based publicly traded firms. Ali the acCOWlting variables are computed as lhe averagc of the years 2000, 2001 and 2002. Size is defined as the natural logarithm of total asscts. ROA is computed as EBITA over total assets. Leverage is total debt over total asscts. ÜLher firm variables displayed include mea<>w·es of research and development (H.&D) spcnding and capital expenditures (CA PEX ). CBS is thc leve] of the Corporale Brand Strength as measured by the "loOrtune" ranking on Lhe '~Amcrica's Most Admired Compa.nies". N is lhe number of non missing observations in the samplc for each variable.
Size ROA ll&D Leverage Dividend Dummy CAP EX CBS
Size 1.0000 -0.2059 0.0561 0.1713 0.2662 -0.3<165 0.1654
ROA 1.0000 0.0156 -0.3951 0.0471 -0.2096 0.2619
R.&D 1.0000 -0.1742 -0.1343 -0.0434 0.0740
Lcverage 1.0000 0.0524 0.0676 -0.2636
Dividend Dummy 1.0000 -0.1306 0.1182
CAP EX 1.0000 0.0344
CBS 1.0000
Table 3: D escriptive stat is tics of companies with hig h, very high, low and very low corporate brand st re ngt h
Thc table presents thc dcscriptive statistics for four sub-samples of firms. A firm is considered to have a strong (weak) Corporate Brand Strength if it has a CBS value on the 3rd (2nd) quarter of the distribution. A firm is considered to have very strong (wcak) Corporatc Brand if it. has a CBS value on the 4th {1st) quarter of the distribution. Ali the accounting variables, except for thc Tobin 's q ratio that is observed in the year 2002, are computed as the average of the years 2000, 2001 and 2002. Thc Tobin 's q ratio is measured as the book value of assets, lcss the book valuc of cquity, plus the market value of equity, divided by asset.s. Size is defined as the natural logarithm of total as.<;Cts. ROA is computed as EBITA over total assets. Leverage is total debt over total assets. Other firm variables displaycd includc mcasures of research nnd development (R&O) spending and capital cxpcnditures (CA PEX). CBS is t.he levei of the Corporate Brand Strength mea.surcd by Lhe "Fortune" ranking ou the "America's tvlost Admired Companies" . N is t.he numbcr of non missing observations in the sample for each variable.
!vlean Median Max rvlin St. Dev. N
Panel A: Finn$ wilh ve111 high C01pomte Bmnd Str-ength
Tob;n' Q 1.9090 1.6046 5.1905 0.6298 0.9891 90 s;ze 8.9893 8.9257 13.1875 6.6031 1.3646 90 ROA 0.1544 0.1507 0.4190 0.0000 0.0811 90 R&D 0.0191 0.0000 0.2275 0.0000 0.0418 90 Lcvcmge 0.6251 0.6224 1.0470 0.1585 0.1860 90
CA PE:X 0.1167 0.0411 2.6282 0.0000 0.3068 90
CBS 7.3978 7.2400 8.6900 6.9200 0.4523 90 Panei B: Finns with high Corpornte Bmnd Strength Tob;n's Q 1.6217 1.2689 5.1428 0.5511 0.8893 91 s;ze 8.7455 8.6084 13.0769 1.2308 1.7418 91 ROA 0.1275 0.1223 0.3758 -0.2384 0.0796 91 R&D 0.0146 0.0000 0.2025 0.0000 0.0312 91 Leverage 0.6748 0.6681 1.2988 0.2178 0.1792 91
CAPEX 0.1897 0.0338 9.9610 0.0000 1.0527 91
CBS 6.5747 6.5600 6.9100 6.2000 0.2039 91 Panel C: Fi7m.s with low Corpomte Bmnd Stnmgth Tobin 's Q 1.3724 1.2198 5.5369 0.5994 0.6984 89 s;zc 8.1704 8.1396 12.0582 4.3270 1.3213 89 ROA 0.1329 0.1245 0.5627 0.0000 0.0716 89 R&D 0.0175 0.0000 O 2401 0.0000 0.0453 89 Levecage 0.6617 0.6593 1.3592 0.1371 0.2003 89
CAPE:X 0.1288 0.0408 2.5195 0.0000 0.3639 89
CBS 5.8455 5.8500 6.1900 5.5100 0. 1975 89 Painel D: Firms with VeT1Jlow Corpomte Bmnd Stnmgth Tobhr' Q 1.2403 1.0988 3.1501 0.6337 0.43 12 89 s;ze 8.3385 8.17<12 11.4298 4.9900 1.3192 89 ROA 0.0977 0.0966 0.2396 -0.0891 0.0657 89 R&D 0.0096 0.0000 0.1671 0.0000 0.0271 89 Leverage 0.7433 0.7172 2.1935 0.1862 0.2847 89
CAPEX 0.0752 0.0483 0.8912 0.0000 0.1095 89
CBS 4.7964 5.0450 5.4900 2.6300 0.7067 89
Table 4: FuJI Sample Reg ressions Preclictin g t h e F irm Value o n the Levei of C orporate Brand Strengt h
The dependcnt variable on both thc regressions is the natural logarithm of Tobin's q ratio obscrved in 2002 and computed as the book value of assets, less thc book value of equit.y, plus the market va1ue of equity, divided by assets. Ali the accounting variables are computcd as the average of thc years 2000, 2001 and 2002. Sir..c is defined as the natural logarithm of total assets. ROA is computed as EBITA over total assets. Leverage is total debt over total assets. Dividend dummy is a variable set to onc if the firm paid a dividend in one of the years 2000, 200 1 or 2002 and set to zero if it did not.. OLher fi rm variables displayed include measures of research anel development (R&D) spendi ng and capital expenditures (CAPEX) . CBS is the levei of the Corporate Brand Strength measurcd by thc "l:àrtune" ranking on the "America's Most Admired Companies". N is t he numbcr of non missing observations in thc sample fo r each variable. The industry cffects regression is run wit h a dummy variable for each industry defined by the 2·digit SJC code. Ali t·statistics are corrccted fo r heteroskcdasticity using Vlhite's (1980) correction.
Common Industry Effects
Constant -0.8311 -0.8612
(-5.68) {-5.45)
Sizc -0.0023 -0.0020
(-0.18) (-O. ll ) ROA 3. 1985 3.2326 {11.94) (9.36)
H&D 2.8001 1.6631
(4.71) {2.69)
Leverage 0.3692 0.3879
(2.83) {4.60)
Dividend Dummy -0.0023 -0.0227 (-0.06) (-0.49)
CAP EX 0.1969 0.11129
{8.48) {1.96)
CBS 0.0742 0.0821
{4 .60) (2.85)
N 362 362
Adjusted R2 0.44 0.43
Table 5: Sub-sample Regressio ns Predict ing the Firm Value on t he Levei of Corpo ra t e Brand S t r en gt h for F irms
The dependent variablc on ai ILhe regressions is the naturallogaril.hm of Tobin's q ratio observed in 2002 and computcd as the book value of assets, Jess thc book valuc of equity, plus thc market value of equity, d ivided by assets. Ali the accounting variables are computed as the average of the ycars 2000, 2001 and 2002. Size is defined as the natural logarithm of total assets. ROA is computcd as EBITA over total assets. Leverage is total debt over total assets. Dividend dununy is a va.riable set to one if the firm paid a dividend in one of the yeans 2000, 2001 or 2002 and set (fl&eó)
i!,~~~~~f~~~o;;~J~~~
..~ín;x;;l~~}~~~~~s(ÓÁ~E~
1f
1C1~S~~~h~ie~cÍ~Í~~~
ê~~~,~~~~~o~~:~J
Strength measured by the "F'ortune" ranking on the "America's Most Admired Companies". The sub-samples are defined using CBS. A firm is considered to havc strong (weak) Corporate Brand Strength if its CBS valuc is higher (lower) than the median. Thc levei of the Corporate Brand Strength is measured using thc "Fortune" ranking on the "America's Most Admired Companies" . N is the number of non missing observations in the sample for cach variable. The industry effects regression is run with a dummy variablc for each industry defined by the 2-digit SJC code. Ali t-statistics are corrected for hcteroskedasticity using White's ( 1980) corrcction.
Common Industry EHccts
Panei A: hnns unth stnmg Cmpomte Bmnd
Constant -0.8328 -1.1168 (-2.24) (-2.74)
Size 0.0094 0.030•1
ROA 3.6093 (0.49) 4.146•1 (1.02) (8.63) (6.21)
R&D 2.8601 0.8214
(4.07) (0.84) Leverage 0.0028 0.1908 (0.02) (0.95) Dividend Dummy 0.0397 -0.0677 (0.57) (-0.75)
CAP EX 0.2433 0.0857
(7.31) (1.07)
CBS 0.0830 0.0881
(1.85) (1.82)
N 181 181
Adjusted ll2 0.45 0.32
Panel B: Fi7ms with weak Corpomte Bnmd
Constant -0.4778 -0.5784
Si'e
-b~5Jl
_\;7ifll6
ROA
~~ggj
~~m
(6.54) (5.51)
R&D 2.4121 2.1465
(3.35) (2.72) Leverage 0.4612 0.5<187 Dividcnd Dummy
_J1frJ
-d~]~Ó
C APEX
li~lgl
k~W
CBS 0.0105 (2.18) 0.0227 (1.74) N
(0.45) (0.78)
181 181
Adjusted R2 0.38 0.37
• I
'#,
'r]Table 6: R egressio ns P red icting t he F irm V alue o n t he Levei of Corpo ra t e Brand Strength Test ing for Differ ences in t he Levei o f Corpora te Bra nd Str en gt h
The dependent variable is the naturallogarithm of Tobin's q r atia observcd in 2002 and computed as thc book value of assets, less tbe book value of equit.y, plus the market value of equity, divided by assets. T he account.ing variables are computed as the average of the years 2000, 2001 and 2002. Size is dcfined as the natural logarithm of total a<i.Sets. ROA is computcd as EBITA over total assets. Leverage is total debt over total assets. Dividend dummy is a variablc sct to onc if the firm paid a dividend in onc of the years 2000, 2001 or 2002 and set to zero if it did not. R&D stands for research and development spending and CA P EX for capit.al expenditures. CBS Dummy (1) is a variable set to one if a firm has a stroug corporate brand and zero if it has not. A finn has a strong corporate brand if it has a levei of CBS higher than the mcd ian. CBS Dummy (2) is
~o~~~~~!~
~~~!nt3.
o~efii 1~ n ~ 17~
11v~;;
~ ~:~~ {\~~~.3-í
~~~~~~
:.~~: ~~~~~
ft~ Ít~
0~f~!~~;~f
ê!;SYh;~r~~
{lower) t han Lhe 75th (25th) perceut ile. The levei of the Corporate Brand Strength is measured using t he "Fortune" rank ing on t he "America's Most Admired Companics". N is t hc number of non tn.issing obscrvations. T he industry effects regrcssion is run with a dummy variable fo r each industry dcfined by Lhe 2-digit SIC code. All t-statistics are corrected for hcteroskcdasticity using White's ( 1980) corrcction.
Size ROA
R&D
Leverage Dividend Dununy CAP EX 1nn -0.4537 (-2.82) 0.0021 (0.12) 3.3177 (9.48) 1.7016 (2.74) 0.3332
.J1r:á
k ~ t$J
(2.24)CBS Dummy (1) 0.1 65 1
N
0~
Adj usted R2 OA3
Panei 8 : Fimts 1uith very stmng/weak C01pomte Bmnd
Constant -0.1297 -0.0933
(-0.67) (-0.37)
Sizc -0.0289 -0.0389
ROA
Utü
~~:ciJ
(7.53) (5.59)
R&D 4.0885 3. 1776
(6.02) (3.60)
Leverage 0.2833 0.3300
Dividend Dummy
.J. h 8~f
J.~gá
(-0.05) (0.05)
CAP EX 0.0699 0.0758
(0.95) (0. 76)
0.2177 0.2740
(4.35) (3.81)
179 179
CBS Dummy (2)
N