RADIOMETRIC DATA FROM TM/Landsat 5
Ludmila Roque Ferraz Pacheco1, Flávio Jorge Ponzoni2, Sandra Benfi ca dos Santos3, Clódis de Oliveira Andrades Filho4, Márcio Pupin Mello5, Rogério Costa Campos6 (received: March 11, 2010; accepted: October 28, 2011)
ABSTRACT:Empirical approaches and, more recently, physical approaches, have grounded the establishment of logical connections between radiometric variables derived from remote data and biophysical variables derived from vegetation cover. This study was aimed at evaluating correlations of dendrometric and density data from canopies of Eucalyptus spp., as collected in Capão Bonito forest unit, with radiometric data from imagery acquired by the TM/Landsat-5 sensor on two orbital passages over the study site (dates close to fi eld data collection). Results indicate that stronger correlations were identifi ed between crown dimensions and canopy height with near-infrared spectral band data (ρs4), irrespective of the satellite passage date. Estimates of spatial distribution
of dendrometric data and canopy density (D) using spectral characterization were consistent with the spatial distribution of tree ages during the study period. Statistical tests were applied to evaluate performance disparities of empirical models depending on which date data were acquired. Results indicated a signifi cant difference between models based on distinct data acquisition dates.
Key words: Spectral characterization, estimate of biophysical data, refl ectância de dosséis.
CARACTERIZAÇÃO ESTRUTURAL DE DOSSÉIS DE Eucalyptus spp. MEDIANTE DADOS RADIOMÉTRICOS TM/Landsat 5
RESUMO: Abordagens empíricas e, mais recentemente, abordagens físicas têm fundamentado o estabelecimento de conexões lógicas entre variáveis radiométricas provenientes de dados remotamente coletados e outras de caráter biofísico provenientes da cobertura vegetal. Nesse sentido, foram avaliadas correlações entre dados dendrométricos e de densidade de dosséis de Eucalyptus spp. coletados na Unidade Florestal de Capão Bonito da empresa FIBRIA S/A e dados radiométricos extraídos de imagens do sensor TM/Landsat 5, provenientes de duas passagens (datas próximas à coleta de dados em campo) sobre a área de estudo. Os resultados indicaram que as maiores correlações foram identifi cadas nas relações estabelecidas entre as dimensões da copa e a altura dos dosséis com dados da banda espectral do infravermelho próximo (ρs4), independentemente da data de passagem do satélite. As estimativas da distribuição espacial de dados dendrométricos e de densidade do dossel (D) fundamentadas na caracterização espectral foram consistentes em relação à distribuição espacial das idades dos plantios para o período de realização do trabalho. Foram aplicados testes estatísticos para avaliar diferenças de desempenho de modelos empíricos defi nidos a partir de dados radiométricos de datas diferentes. Os resultados indicaram que houve diferença signifi cativa entre os modelos estabelecidos a partir de dados provenientes de datas diferentes.
Palavras-chave: Caracterização espectral, estimativa de dados biofísicos, canopy refl ectance.
1Environmental Engineer, MSc in Remote Sensing – Instituto Nacional de Pesquisas Espaciais – Av. dos Astronautas, 1758, Jd. Granja – 12227-010 –
São José dos Campos, SP, Brasil – [email protected]
2Forest Engineer, PhD in Forest Sciences – Instituto Nacional de Pesquisas Espaciais – Av. dos Astronautas, 1758, Jd. Granja – 12227-010 – São
José dos Campos, SP, Brasil – fl [email protected]
3Agronomic Engineer, MSc in Energy Engineering Sciences – Instituto Nacional de Pesquisas Espaciais – Av. dos Astronautas, 1758, Jd. Granja –
12227-010 - São José dos Campos, SP, Brasil – [email protected]
4Geographer, PhD candidate in Geosciences – Instituto Nacional de Pesquisas Espaciais – Av. dos Astronautas, 1758, Jd. Granja – 12227-010 – São
José dos Campos, SP, Brasil – [email protected]
5Land Survey Engineer, PhD candidate in Remote Sensing – Instituto Nacional de Pesquisas Espaciais – Av. dos Astronautas, 1758, Jd. Granja –
12227-010 – São José dos Campos, SP – [email protected]
6Agronomic Engineer, PhD in Remote Sensing – Departamento de Ciências Exatas, Escola Superior de Agricultura “Luiz de Queiroz“/ESALQ –
Universidade de São Paulo/USP – Av. Pádua Dias, 11 – Cx. P. 9 – 13418-260 – Piracicaba, SP, Brasil – [email protected]
1 INTRODUCTION
Establishing empirical relationships between biophysical variables and spectral variables derived from airborne or orbital sensors when studying vegetation has been the subject of investigation ever since remote sensing
Aragão et al. (2005) studied spatial variability of leaf area index (IAF) in the east portion of the Brazilian Amazonia. Foody et al. (2003) evaluated estimate possibilities for forest biomass in two parts of Amazonia by using data from the Thematic Mapper sensor aboard the Landsat 5 satellite (TM/Landsat 5). Steininger (2000) estimated biomass of secondary forest formations in forests of Brazil and Bolivia, establishing empirical relationships between forest biomass and radiometric data acquired by the CHRIS-PROBA sensor in Tapajós national forest.
The fragility of empirical relationships in studies of this kind is well acknowledged. Schlerf and Atzberger (2006) argued that, where quantitative approaches are used involving use of remote sensing data in vegetation studies, the application of empirical or physical models can be explored. Empirical models usually relate Bidirectional Refl ectance Factors (FRB) or Vegetation Indices (IVs) to one or more biophysical variables by defi ning statistical regression models. However, statistical relationships derived from such models are specifi c to each sensor, study region and sampling condition specifi ed, in addition to varying in time and space (COLOMBO et al., 2003), all of which validate the application of such models only under the local experimental or environmental conditions they were defi ned for (ASNER et al., 2003).
A physical approach is based on the application of models grounded on radiative transfer theory, assumed to describe spectral variations of plant canopies as a function of their structural characteristics and spectral properties of the leaves and the soil (GOEL, 1988). According to Houborg et al. (2007), radiative transfer models are useful for explaining the transfer and interactions of electromagnetic radiation in the interior of canopies. Grounded on physical laws, it is possible to establish correlations of biochemical and/or biophysical variables with canopy reflectance. These correlations are said to be ‘direct’ when spectral properties (for instance, FRB) are defi ned as a function of biochemical and/or biophysical parameters, and said to be ‘inverse’ when biophysical and/or biochemical parameters are defined as a function of observed spectral values (SCHLERF; ATZBERGER, 2006).
Despite there being arguments in favor of physical models, whether direct or inverse, the application of these models is not trivial and deserves different types of adaptation and consideration depending on the canopy being studied (CAMPOS, 2008). Therefore, empirical models are still being used, and their results have varying degrees of success and limitations on the scope of their application.
Canavesi and Ponzoni (2007) used empirical modeling to estimate spatial distribution of wood volume in stands of Eucalyptus spp. The authors evaluated the effect of topography on the values of bidirectional refl ectance factors extracted from TM/Landsat-5 imagery and concluded that, even empirically, it was possible to estimate wood volume in the eucalyptus stands based on spectral properties.
One of the most desirable applications of remote sensing techniques as far as vegetation studies are concerned is estimating dendrometric and structural data of forest canopies using radiometric data. Specialists in this fi eld, however, are for the most part unfamiliar with the potential and the limitations of quantitative approaches via remote sensing techniques, there being considerable uncertainty or even false expectations as to what is indeed possible and feasible.
The objective of this study is to evaluate the possibility of estimating dendrometric and canopy density parameters using empirical models that correlate them with radiometric data from TM/Landsat-5 imagery.
2 MATERIAL AND METHODS 2.1 Study site and fi eld data collection
The study site (located between latitudes 23º46’30’’ and 24º1’26’’ south and longitudes 48º15’4’’ and 48º30’2’’ west) consisted of eucalyptus stands owned by FIBRIA S/A, located in the municipality of Capão Bonito (Figure 1), São Paulo state. According to geomorphologic mapping of São Paulo state performed by the Instituto de Pesquisas Tecnológicas do Estado de São Paulo (1981), Capão Bonito sits in a region known as São Paulo Peripheral Depression, in Paranapanema Zone. The local relief consists of hills with convex and tabular tops, local altitude ranges between 600m and 700m and local declivity ranges between 10% and 20%.
Field data were collected between May 4 and May 8, 2009. During that period, 30 plots were visited at differing ages (1 to 9 years) and with differing spacing between trees (3 x 1.5m, 3 x 2m and 3 x 3m) in order to obtain canopy data with dissimilar structural characteristics. It should be noted that all plots differed as to clone origin so as to ensure specifi c biophysical uniformity at each age.
The fi rst tree to be measured in the plot was selected randomly and its exact location was recorded by a GPS (Global Positioning System). The spatial positioning of the fi rst tree served only as a reference for identifying that particular plot in orbital images, since the radiometric data were derived from the arithmetic average of data from a 3 x 3 pixel matrix about such coordinate. DAP and Rc were measured using a diameter tape, while H and Ht were measured using a Bitterlich hypsometer with a 20m-distance scale. Crown height (Hc) values were estimated using the differences between H and Ht values. All the above parameters were represented by average values computing the 10 trees. D values were estimated using a densitometer, as described by Souza (2009), and served to estimate the percentage of canopy cover in the plots. In each patch, the sampling procedure to estimate D consisted of doing a triangle-shaped circuit. Readings were taken every 3 meters, with the densitometer facing upward and reporting whether the sampling point intercepted the canopy or not. Around 100 meters were done on each side of the triangle circuit, to a total of 33 sampling points on two sides, and 34 points on the third side. Figure 2 illustrates the triangle-shaped circuits within each plot. The fi rst densitometer reading point coincided with the site where the fi rst tree was randomly selected for the sampling of biophysical parameters, in such way that the last reading would coincide with the starting point. The fi nal estimate of canopy density corresponds to the number of affi rmative points divided by the total
number of points being sampled. For instance, assuming that in one patch 75 points correspond to presence and 25 points correspond to absence of canopy elements, then the percentage of canopy density is 75%.
Figure 1 – Geographic location of Capão Bonito forest unit.
Figura 1 – Localização geográfi ca da Unidade Florestal de Capão Bonito.
Figure 2 – Shape of the circuit done within each plot and densitometer reading points.
Source: Adapted from Stumpf (1993).
Figura 2 – Formato do circuito percorrido dentro de cada talhão com as medidas do Densitômetro.
Fonte: Adaptado de Stumpf (1993).
2.2 Orbital imagery
The reason for selecting two satellite passage dates was to check the degree of consistency between the established correlations independently, in other words, correlations were established between fi eld data and radiometric data from satellite images on two occasions and the differences between the established correlations were then assessed. Additionally, a statistical procedure was adopted to assess the differences between the defi ned regression models relating dendrometric data and spectral data from images acquired on the two dates.
The digital numbers (NDs) of the images acquired on the two dates were converted to apparent refl ectance values by applying equations 1 and 2.
(1) where:
ρλ= Apparent refl ectance;
Lλ = Radiance at the top of the atmosphere in spectral band λ;
d = Earth-Sun distance in astronomic units;
Esunλ = Solar irradiance at the top of the atmosphere in spectral band λ;
ϴs = Solar elevation angle at the time of image acquisition.
Lλ values were determined by applying equation 2.
(2)
where:
Lλ = Radiance at the top of the atmosphere in spectral band λ;
Lmaxλ = Maximum radiance when QCAL = QCALMAX; Lminλ = Minimum radiance when QCAL = 0;
QCAL = Values of digital numbers referring to and proportional to Lλ;
QCALMAX = Maximum digital number when Lλ= Lmaxλ. Lmaxλ and Lminλ values were derived from Chander et al. (2009) according to each date of image acquisition.
Images converted to apparent refl ectance values were then subjected to an atmospheric correction procedure by applying the Second Simulation of the Satellite Signal in the Solar Spectrum (6S) code of radiative transfer (VERMOTE et al., 1997), converting them to surface refl ectance values (ρs). Images were then georeferenced based on an image from the ETM+/Landsat sensor, available on the ‘Global Land Cover Facility’ website (http://www.landcover.org/data/). A polynomial of
degree 1 was used for georeferencing, and pixel resampling was done by using the nearest neighbor method. Twelve visually distinguishable control points were selected in the two images, a total error of about 0.4 pixels being reached, or 12 m.
2.3 Defi nition of regression models
Surface refl ectance values were extracted from the images by computing the arithmetic average of a 3 x 3 pixel matrix about the fi eld coordinate, close to the 10 fi eld-measured trees. This procedure was adopted in all 30 plots visited in the fi eld and each spectral band of each image (on each date), excepting point no. 13 as in the image acquired on 24/May/2009 this point coincided with recently harvested areas, and values were then correlated to dendrometric and D data using the Pearson correlation coeffi cient (r), as suggested by Mello et al. (2008).
Investigations based on the correlation values found led to use of simple linear regression models, computing biophysical values (dendrometric variables and D) as dependent variables and computing refl ectance values associated to the near-infrared spectral band on each of the two acquisition dates as independent variables. For the determination of each model, 2/3 of the fi eld-visited points (20 out of 29) were randomly selected for use in the model fi tting procedures. Data from the 9 remaining plots were used later in the assessment of resulting models. Due to limited amount of data, this procedure was repeated 10,000 times, randomly and independently, using software R (R DEVELOPMENT CORE TEAM, 2009) as suggested by Peternelli and Mello (2007). It should be noted that the twenty randomly selected points for fi tting each model on one date were the same used for fi tting the models on the second date.
Among the 10,000 resulting models, for each dendrometric variable and D and for each date, the model having the highest R2 among the 10,000 fi tted equations was used for estimating the dendrometric variables and D and for generating the thematic maps for each date independently.
2.4 Assessment and comparison of regression models In order to statistically assess possible differences between the predictive capabilities of the models relating to the two image acquisition dates, a proportion hypothesis test was applied using a Gaussian distribution (represented by a standard z normal). An analysis was conducted of the coeffi cient of determination (R2) of all 10,000 fi tted models for each dendrometric variable and D and for each date.
) cos( . . . 2 s Esun d L θ π ρ λ λ λ = QCAL QCALMAX L L L ⎟⎟ ⎠ ⎞ ⎜⎜ ⎝ ⎛ −
= λ λ
λ
By counting the number of times the R2 obtained through regression fi tting for a given variable on the April date was higher than the R2 obtainedfor the May date, it was possible to conduct the test, based on the hypothesis that, if both models have the same predictive capability, then the proportion of times the R2 relating to the April image was higher than the R2 relating to the May image should be equal to 0.5. The proportion test with the respective hypotheses is given as follows:
1) Ho: p = 0.5 (50% of the times the R2 of the fi tted models using the April image was better and 50% of the times the R2 of the fi tted models using the May image was better, which means that the fi tted models for both images have the same predictive capability);
2) H1: p > 0.5 (a proportion higher than 50% indicates that the April image has greater predictive capability).
If a 0.05 significance level is adopted, the Ho hypothesis will be rejected whenever the test statistic (calculated z-value) is greater than the tabulated distribution value at the established signifi cance level (critical z-value = 1.645).
Another statistical procedure was applied to assess the regression models for the two dates as to their consistency in predictive capability. The values referring to the 9 points not used in the model fi tting process were then used so as to allow a direct comparison between estimated and observed values. According to Kutner et al. (2005), an excellent way of measuring the actual predictive capability of a regression model is to use it for predicting each new data set and then compute the Mean Square Prediction Error (MSPR). MSPR assessment is done through comparison with the Mean Square Error (MSE). The assessment consists of comparing the MSPR associated to predictions (using the 9 points) and the MSE associated to model fi tting (using the 20 points): if the obtained MSPR value is lower than the MSE value, then it is an indication that the predictive capability of the model is unsuitable. If the MSPR value is close to the MSE value, then the model is unbiased and fi ts well to new data. And lastly, if the MSPR value is higher than the MSE value, it is an indication that the model can make good future predictions when used, for instance, with a new data series (KUTNER et al., 2005).
The comparison of MSPR and MSE was done through the average percentage differences (Equation 3) for the 10,000 pairs of fi tted models, for each dendrometric variable and D.
(3)
If the relative difference results in a value close to 0 then it is an indication of similarity and that the model is unbiased, and if it results in a value greater than 1, MSPR is greater than MSE, indicating that the model has good future prediction capability (KUTNER et al., 2005).
3 RESULTS AND DISCUSSION
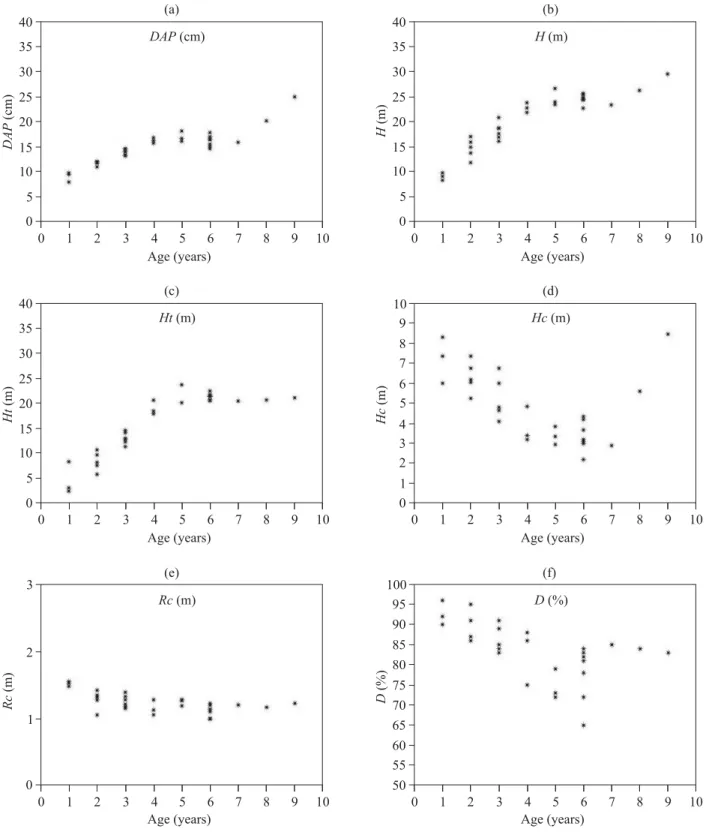
Correlation coefficients (r) were determined between the dendrometric (Figure 3) and structural variables and the ρs values, with results being provided in Table 1.
Table 1 shows that higher r values were found for ρs4 on both dates. The negative r values for the correlations of ρs4 with DAP, H and Ht were expected, inasmuch as older stands are expected to provide deeper shade at the top of the canopy and thus decrease the ρs values (CANAVESI; PONZONI, 2007). This relationship becomes direct when Hc, Rc and Densitometer readings are correlated to ρs, in other words, the greater the amount of leaves at the top of the canopy, the higher the expected ρs values (GOEL, 1988; KUMAR, 1974; PONZONI; SHIMABUKURO, 2007).
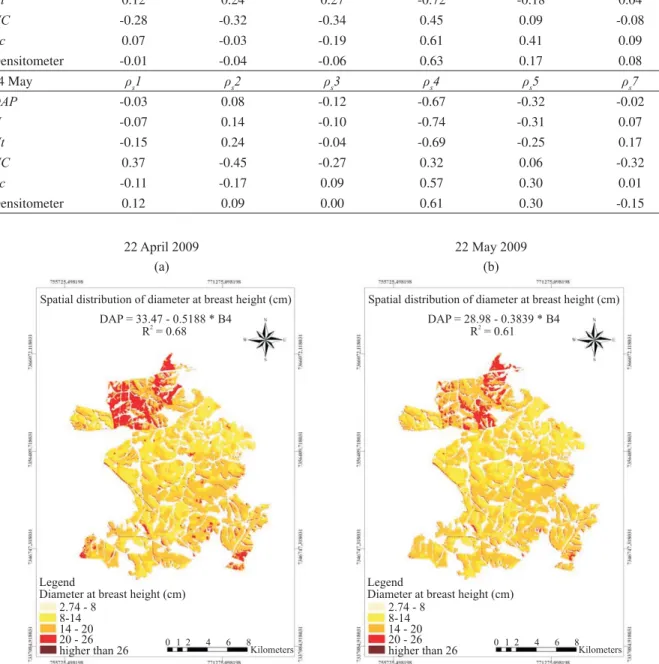
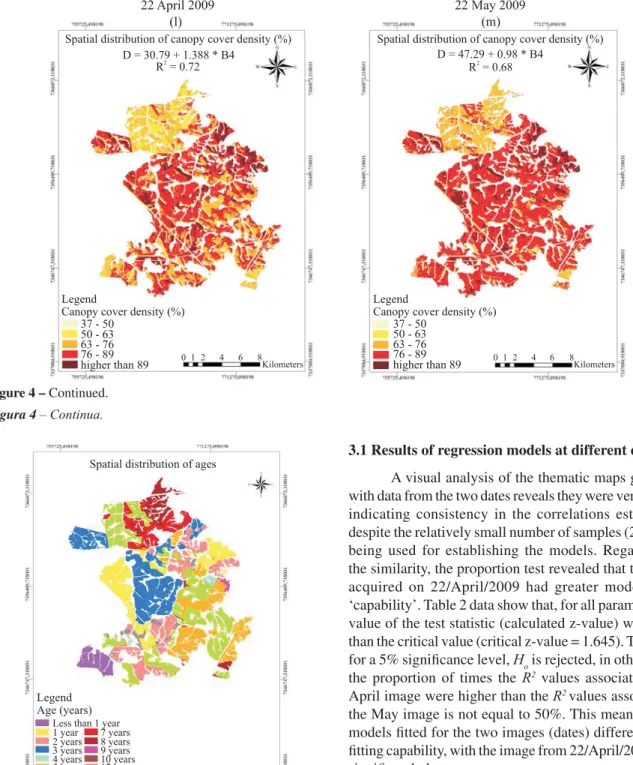
Linear regression models were established for the correlations with higher r values , using dendrometric variables and D as dependent variables and radiometric measurements as independent variables. For thematic maps, the model having the highest R2 value was selected, out of the 10,000 models generated for each date and for each dendrometric variable and D. Figure 4 provides the thematic maps developed for TM/Landsat-5 images (22/April and 24/May), referring to DAP, H and Ht.
To facilitate discussions on the thematic maps generated, another thematic map was developed using existing company data referring to spatial distribution of tree ages in the stands, as illustrated in Figure 5.
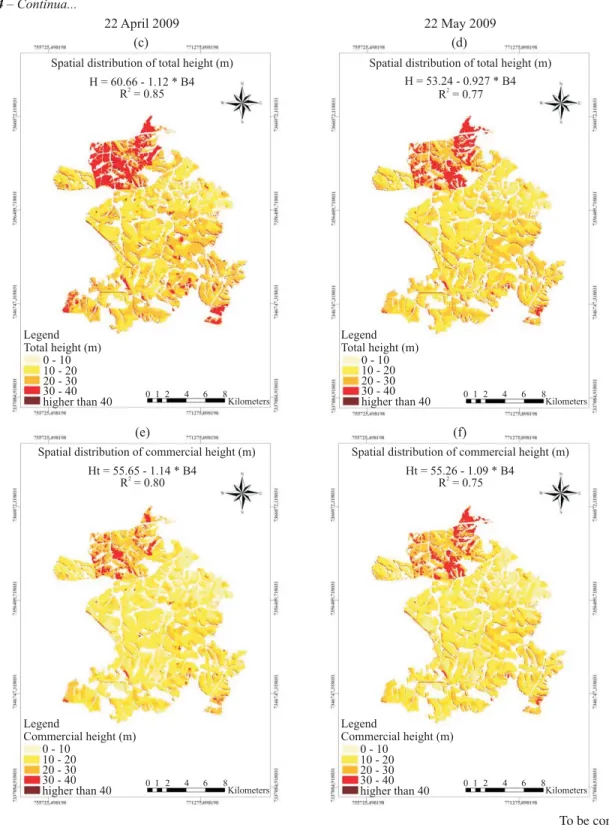
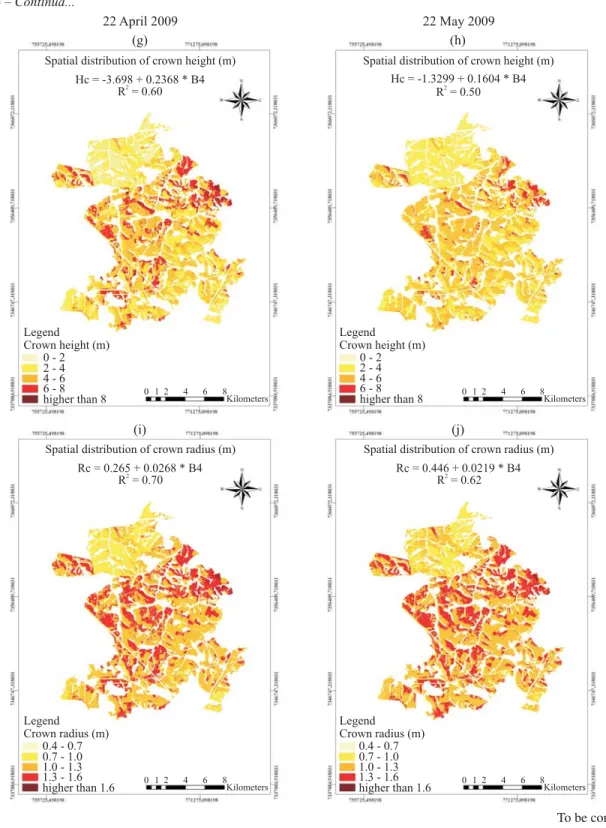
Through an analysis of the generated thematic maps and helped by the map of spatial distribution of ages across the eucalyptus stands at the time of fi eld data collection, it can be said that, overall, the mapping of dendrometric variables showed consistency. The variation of dendrometric parameters throughout mapping was found to agree with the ages of the stands. In other words, the lowest values of dendrometric parameters DAP, H, Ht occurred in areas where stands were younger (Figures 4a, 4b, 4c, 4d, 4e and 4f). Consistency was also observed in the other parameters, Hc, Rc and D, accordingly with lower values the older the stand was (Figures 4g, 4h, 4i, 4j, 4l and 4m), indicating that younger stands have more leaf biomass and thus higher Hc, Rc and D values.
(
MSPR MSE)
Difference
MSE
Figure 3 – Variation in biophysical parameters collected in the fi eld as a function of age, DAP (a), H (b), Ht (c), Hc (d), Rc (e) and D (f).
Table 1 – Correlation coeffi cients (r) between dendrometric variables and ρs.
Tabela 1 – Coefi cientes de correlação (r) entre variáveis dendrométricas e ρs.
Variables Correlation coeffi cients: signifi cant for p<0.05 highlighted (N=29)
22 April ρs1 ρs2 ρs3 ρs4 ρs5 ρs7
DAP 0.03 0.13 0.13 -0.70 -0.28 0.00
H 0.06 0.18 0.21 -0.79 -0.28 -0.01
Ht 0.12 0.24 0.27 -0.72 -0.18 0.04
HC -0.28 -0.32 -0.34 0.45 0.09 -0.08
Rc 0.07 -0.03 -0.19 0.61 0.41 0.09
Densitometer -0.01 -0.04 -0.06 0.63 0.17 0.08
24 May ρs1 ρs2 ρs3 ρs4 ρs5 ρs7
DAP -0.03 0.08 -0.12 -0.67 -0.32 -0.02
H -0.07 0.14 -0.10 -0.74 -0.31 0.07
Ht -0.15 0.24 -0.04 -0.69 -0.25 0.17
HC 0.37 -0.45 -0.27 0.32 0.06 -0.32
Rc -0.11 -0.17 0.09 0.57 0.30 0.01
Densitometer 0.12 0.09 0.00 0.61 0.30 -0.15
Figure 4 – Thematic maps referring to the spatial distribution of dendrometric and structural parameters.
Figura 4 – Mapas temáticos relativos à distribuição espacial de parâmetros dendrométricos e estruturais.
Figure 4 – Continued...
Figura 4 – Continua...
Figure 4 – Continued...
Figura 4 – Continua...
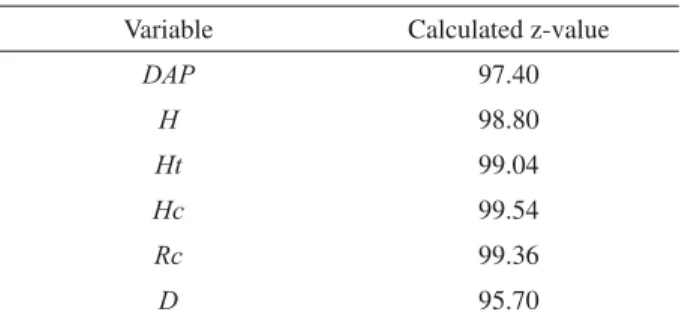
3.1 Results of regression models at different dates A visual analysis of the thematic maps generated with data from the two dates reveals they were very similar, indicating consistency in the correlations established, despite the relatively small number of samples (20 points) being used for establishing the models. Regardless of the similarity, the proportion test revealed that the image acquired on 22/April/2009 had greater model fitting ‘capability’. Table 2 data show that, for all parameters, the value of the test statistic (calculated z-value) was higher than the critical value (critical z-value = 1.645). Therefore, for a 5% signifi cance level, Ho is rejected, in other words, the proportion of times the R2 values associated to the April image were higher than the R2 values associated to the May image is not equal to 50%. This means that the models fi tted for the two images (dates) differed in their fi tting capability, with the image from 22/April/2009 being signifi cantly better.
Following a comparative assessment of the fi tted models, an assessment was made of their predictive capability, using the 9 points that had been left unused.
The computed average percentage differences between MSPR and MSE (Table 3) indicated that they Figure 4 – Continued.
Figura 4 – Continua.
Figure 5 – Spatial distribution of age in eucalyptus stands at the time the fi eld trial was conducted (May 2009).
empirically it would be possible to estimate dendrometric data and D consistently, based on radiometric orbital data.
Despite the consistency, differences found in estimates (two dates) reinforce the fragility of this type of approach, which is often assumed to be discrete and absolute. Selecting an image acquisition date from which to extract radiometric data for model definition is a critical aspect of model performance, since in this study a signifi cant performance difference was identifi ed between them, depending on which date data were acquired.
5 REFERENCES
ARAGÃO, L. E. O. C.; SHIMABUKURO, Y. E.; ESPÍRITO SANTO, F. D. B.; WILLIAMS, M. Landscape pattern and spatial variability of leaf area index in Eastern Amazonia. Forest Ecology and Management, Amsterdam, v. 211, n. 3, p. 240-256, June 2005.
ASNER, G. P.; BUSTAMANTE, M. M. C.; TOWNSEND, A. R. Scale dependence of biophysical structure in deforested areas bordering the Tapajós National Forest, Central Amazon. Remote Sensing of Environment, New York, v. 87, n. 4, p. 507-520, Nov. 2003.
CAMPOS, R. C. Modelo de transferência radiativa para dosséis descontínuos regulares (GRART): aplicações para dosséis de café. 2008. 157 p. Tese (Doutorado em Sensoriamento Remoto) - Instituto Nacional de Pesquisas Espaciais, São José dos Campos, 2008.
CANAVESI, V.; PONZONI, F. J. Relações entre variáveis dendrométricas de plantios de Eucalyptus spp. e valores de FRB de superfície de imagens do sensor TM/Landsat 5. In: SIMPÓSIO BRASILEIRO DE SENSORIAMENTO REMOTO, 13., 2007, Florianópolis. Anais... Florianópolis: SBSR, 2007. p. 1619-1625.
CHANDER, G.; MARKHAM, B. L.; HELDER, D. L. Summary of current radiometric calibration coeffi cients for Landsat MSS, TM, ETM+, and EO-1 ALI sensors. Remote Sensing of Environment, New York, v. 113, n. 5, p. 893-903, May 2009.
COLOMBO, R.; BELLINGERI, D.; FASOLINI, D.; MARINO, C. M. Retrieval of leaf area index in different vegetation types using high resolution satellite data. Remote Sensing of Environment, New York, v. 86, n. 1, p. 120-131, June 2003.
Table 2 – Calculated values for the z-test.
Tabela 2 – Valores calculados para o teste z.
Variable Calculated z-value
DAP 97.40 H 98.80 Ht 99.04 Hc 99.54 Rc 99.36 D 95.70
were relatively similar and, consequently, the fi tted models (for the two dates and each variable) had good predictive capability. For the variables H, Ht and Hc, the similarity of MSPR and MSE values was greater.
Overall, it was observed in this empirical approach that the selection/adoption, spontaneous or not, of a specific date for collecting orbital data would entail establishment of specifi c models, with greater or lesser fi t capability, and yet with similar prediction capabilities to estimate structural variables of canopies.
4 CONCLUSIONS
The most significant correlations between radiometric and biophysical data in this study were observed for the near-infrared region (Band 4, TM/ Landsat-5 sensor).
The spatial distribution of dendrometric data and canopy density (D) was consistent, at least visually, with the age distribution across the stands, indicating that even Table 3 – Average percentage differences between MSPR and MSE values as calculated for the10,000 models for each variable on each image acquisition date.
Tabela 3 – Média das diferenças percentuais entre os valores MSPR e MSE calculados para os 10.000 ajustes para cada variável em cada data de imageamento.
Variable Difference 22 April Difference 24 May
DAP 0.45 0.40
H 0.21 0.23
Ht 0.21 0.23
Hc 0.24 0.22
Rc 0.28 0.25
FOODY, G. M.; BOYD, D. S.; CUTLER, M. E. J. Predictive relations of tropical forest biomass from Landsat TM data and their transferability between regions. Remote Sensing of Environment, New York, v. 85, n. 4, p. 463-474, June 2003.
GOEL, N. S. Models of vegetation canopy refl ectance and their use in estimation of biophisical parameters from refl ectance data. Remote Sensing Reviews, Florence, v. 4, n. 1, p. 1-21, Jan. 1988.
HOUBORG, R.; SOEGAARD, H.; BOEGH, E. Combining vegetation index and model inversion methods for the extraction of key vegetation biophysical parameters using Terra and Aqua MODIS refl ectance data. Remote Sensing of Environment, New York, v. 106, n. 1, p. 39-58, Jan. 2007.
KUMAR, R. Radiation from plants-refl ection and emission: a review. Lafayette: Purdue Research Foundation, 1974. 88 p. (Research project, 5543).
KUTNER, M. H.; NACHTSHEIM, C. J.; NETER, J.; LI, W. Applied linear statistical models. New York: McGraw-Hill, 2005. 1396 p.
MELLO, M. P.; LIMA, F. B.; SILVA, G. B.; VIANA, D. R. Estudo de correlações entre dados radiométricos coletados em campo e em nível orbital. Geografi a, Ensino & Pesquisa, Santa Maria, v. 12, n. 1, p. 3948-3960, 2008.
PETERNELLI, L. A.; MELLO, M. P. de. Conhecendo o R: uma visão estatística. Viçosa, MG: UVF, 2007. 182 p.
PONZONI, F. J.; SHIMABUKURO, Y. E. Sensoriamento remoto aplicado ao estudo da vegetação. São José dos Campos: Parêntese, 2007. 135 p.
R DEVELOPMENT CORE TEAM. R: a language and environment for statistical computing. Vienna: R Foundation for Statistical Computing, 2009.
SCHLERF, M.; ATZBERGER, C. Inversion of a forest refl ectance model to estimate structural canopy variables from hyperspectral remote sensing data. Remote Sensing of Environment, New York, v. 100, n. 3, p. 281-294, Feb. 2006.
SOUZA, A. A. Estudo de fitofisionomias de Cerrado com dados do sensor Hyperion/EO-1. 2009. 120 p. Dissertação (Mestrado em Sensoriamento Remoto) - Instituto Nacional de Pesquisas Espaciais, São José dos Campos, 2009.
STEININGER, M. K. Satellite estimation of tropical secondary forest above ground biomass: data from Brazil and Bolivia. International Journal of Remote Sensing, Basingstoke, v. 21, n. 6/7, p. 1139-1157, Apr. 2000.