Printed version ISSN 0001-3765 / Online version ISSN 1678-2690 http://dx.doi.org/10.1590/0001-3765201620160173
www.scielo.br/aabc
Iron restriction increases myoglobin gene and protein expression in Soleus muscle of rats
JANAINA S. DE SOUZA1,2
, ERIKA L. BRUNETTO1
and MARIA TEREZA NUNES1
1
Instituto de Ciências Biomédicas/ICB, Universidade de São Paulo, Departamento de Fisiologia e Biofísica, Laboratório 129, Avenida Professor Lineu Prestes, 1524, Butantan, 05508-900 São Paulo, SP, Brazil
2
Universidade Federal de São Paulo, Escola Paulista de Medicina, Departamento de Medicina, Laboratório Endocrinologia Molecular e Translacional, Divisão de Endocrinologia, Rua Pedro
de Toledo, 669, 11º andar, Vila Clementino, 04039-032 São Paulo, SP, Brazil
Manuscript received on March 31, 2016; accepted for publication on July 12, 2016
ABSTRACT
Iron is an important trace element for proper cell functioning. It is present in cytochromes, hemoglobin and myoglobin (Mb), where it binds to oxygen. It is also an electron acceptor in the respiratory chain. Mb is an 18 kDa heme-protein, highly expressed in skeletal muscle and heart. The expression of several genes involved in the metabolism of iron is post-transcriptionally regulated by this element. Iron was shown to interfere with the polyadenylation step, modifying their poly (A) tail length and, as a consequence, their stability and translation rate. The aim of this study was to investigate whether iron supplementation or long and short-term restriction affects Mb gene and protein expression, as well as Mb mRNA poly(A) tail length, in cardiac and skeletal muscles of rats. Long-term iron restriction caused an increase in Mb gene and protein expression in Soleus muscle. No changes were observed in extensor digitorum longus muscle and heart. Short-term iron supplementation after iron deprivation did not alter Mb gene expression and mRNA poly(A) tail length in all tissues studied. These results indicate that Mb gene and protein expression is upregulated in response to iron deprivation, an effect that is tissue-specific and seems to occur at transcriptional level.
Key words: cardiac muscle, iron, Myoglobin, skeletal muscle.
Correspondence to: Janaina Sena de Souza E-mail: [email protected]
INTRODUCTION
Iron is a trace element that accepts and donates
electrons. This property makes it extremely useful
in several important reactions that are necessary for
the appropriate functioning of the whole body. It is
present in cytochromes, hemoglobin (Hb) which
binds and transports O2 to tissues, myoglobin
(Mb), which functions as a storage of O2 in cardiac
and skeletal muscles, where it also delivers O2 to mitochondria, and in a wide variety of enzymes (Anderson et al. 2007, Andrews 2000, Li and Stocker 2009, Conrad and Umbreit 2000, Núñez et al. 2012).
have been shown, both in humans and experimental animals (Beard et al. 1998, Gera and Sachdev 2002, Hass and Brownlie 2001, He et al. 2008, Hegde et al. 2006, Moy and Early 1999, Paiva et al. 2000, Zimmermann et al. 2005, Ebner and von Haehling 2013).
Iron is acquired in diet, through animal foods (heme) and vegetables. The process of regulation of intestinal absorption of iron by enterocytes has fundamental importance for iron homeostasis and maintenance. Iron absorption is very well controlled by mechanisms that are triggered in response to iron content of diet and stock of iron in the body (Andrews 2000), thus preventing excess and deficiency of iron (Anderson et al. 2009). Iron homeostasis is very important and it is shown during intense exercise in which the level of iron decreases significantly right after it and the parameters of blood cells do not change (Skarpanska-Stejnborn et al. 2015). There are several proteins involved in the homeostasis of iron, which participates in a number of steps from its absorption to its storage. Increase and decrease of cellular iron content can regulate the expression of mRNAs and proteins responsible for its homeostasis. The regulation of expression of some genes responsible for iron metabolism occurs at post-transcriptional level and involves the untranslated regions of mRNAs that they encode, resulting in alterations in their stability and, as a consequence, in expression of related proteins (Butt et al. 1996, Hentze and Kühn 1996).
Surprisingly, skeletal muscle, which corresponds to about 40% of body weight and contains 10 to 15% of iron from the body (present in the heme portion of Mb and cytochrome c) has received little attention about their involvement in metabolism of iron, which is a key component of recognized roles that Mb and cytochromes play in the processes of storage, transport and use of O2 (Robach et al. 2007, 2009).
Mb is a heme-protein of 18 kDa, highly expressed in skeletal muscle (especially in
slow-twitch, oxidative) and heart, and belongs to the same family of Hb (Hass and Brownlie 2001, Ordway and Garry 2004, Shikama 2005). Mb is localized at myocytes near to contractile proteins, acting as a protective molecule (Sher et al. 2014). It is believed that iron and/or heme participates meaningfully in transcriptional and/or post-transcriptional control of the expression of genes related to proteins that carry out functions related to it, which, directly or indirectly assist in the maintenance of homeostasis. Thus, based on (a) the high expression of Mb, which is essential for the maintenance of intracellular O2 storage and transportation to the mitochondria, (b) the role of Mb as an acceptor of reactive O2 and N2 species and (c) that about 15% of iron in the body is in part stored in Mb, this study aimed at investigating whether alterations in iron supply could affect Mb gene expression, which would place the iron as an important element involved in the regulation of the expression of this protein.
MATERIALS AND METHODS
ANIMALS AND TREATMENTS
Male Wistar rats (Rattus norvergicus) weighting approximately 250 g were obtained from Institute of Biomedical Sciences, University of São Paulo. They were housed in collective cages (5 animals per cage) in a room kept at constant temperature (23 ± 1°C) and on a 12-hour-light/12-hour-dark schedule, and subjected to long or short-term iron treatment, as follows. Long Term Treatment:
fed ad libitum. After thirty days these animals were anaesthetized (Sodium Thiopental, 9 mg/100 g) and euthanized by decapitation. Blood was collected from the trunk, for analysis of different hematimetric parameters: hematocrit, red blood cell count, mean corpuscular volume (MCV), mean corpuscular hemoglobin (MCH), mean corpuscular hemoglobin concentration (MCHC), Hb and serum iron concentration. Short Term
Treatment: Initially, animals were divided into
two groups: I. Control group: animals kept in collective cages with food and water ad libitum. II. Iron Restriction group: animals kept in collective cages treated with tannic acid (0.5 g/100 ml) in drinking water (Onodera et al. 1994) and fed ad libitum for 30 d. After this period, animals treated with tannic acid were divided in two subgroups: (a) Iron restriction, and (b) Acute iron treatment, in which the animals received intraperitoneal (ip) iron saccharate hydroxide solution (6 mg/100 g body weight - NYCOMED) and were euthanized by decapitation after 30 min, 1 h, 2 h, 12 h and 24 h. Blood was collected for analysis of serum iron concentration. After the specific periods of treatments Soleus (slow oxidative), Extensor Digitorum Longus (EDL, fast glycolytic) and heart (LV, left ventricle) muscles were removed and subjected to: (a) Total RNA extraction to assess Mb mRNA content and poly(A) tail length and, (b) Total protein extraction and specific fractionation to obtain cytosolic fraction, in order to evaluate Mb protein content.
The experimental protocol conformed with the ethical principles in animal research adopted by the Brazilian College of Animal Experimentation and was approved by the Institute of Biomedical Sciences/University of São Paulo-Ethical Committee for Animal Research (no. 94/2007).
PROCEDURES
Northern blot analysis. Total RNA was isolated using the acid guanidinium
thiocyanate-phenol-chloroform extraction method and quantified by absorbance at 260 nm (Chomczynski and Sacchi 1987). Total RNA samples were denatured with formaldehyde-formamide, electrophoresed in 1% agarose gels containing 2.2 M formaldehyde in 1X 3-N-morpholino-propanesulfonic acid buffer and blotted to a nylon membrane (Nylon-1 membrane, Gibco BRL, Rockville, MD) by neutral capillary transfer. The membrane was baked at 80°C for 1 h in a vacuum oven and prehybridized in 50% formamide hybridization solution and 100 mg/ mL denatured salmon sperm DNA at 42°C for 4 h. Subsequently, the membrane was probed with a 32P-labeled rat Mb cDNA (GenBank AF197916; online: http://www.ncbi.nlm.nih.gov/ [November 3 1999]) by random priming (Random Primers DNA Labeling System Kit, Gibco BRL) for 16 h at 42°C. The membrane was washed under high stringency conditions and subjected to autoradiography and quantified by phosphorimaging, using ImageJ software. All blots were stripped and rehybridized with a 32P-labeled RNA probe specific for 18S
ribosomal RNA (18S c-rRNA), synthesized by in vitro transcription (Maxi Script In vitro transcription kit, Ambion, Austin, TX), to correct for the variability in RNA loading. The results were expressed as mean ± s.e.m. of Mb mRNA/18S c-rRNA ratio.
Race-Pat (Rapid amplification of cDNA
µl of standard PCR reaction containing 25 pmol of each primer; anchor primer (5’- GCG AGC TCC GCG GCC GCGT – 3’) and Mb sense primer (5’ – ATT TGA CCC CAA ATG CAA GT – 3’). The PCR conditions were established for a reaction, as follows: 1 hold of 5 min at 95°C; 30 cycles: i) 30 sec at 95°C, ii) 1 min at 60.1°C, iii) 1 min at 72°C; then one hold of 10 min at 72°C. Thereafter, the PCR products were subjected to electrophoresis on 2.5% agarose gel containing ethidium bromide, to enable the verification of the amplicon size, which was estimated from the bottom to the top edge of the smear formed.
Western blot analysis. Soleus, EDL muscles and heart were homogenized in Polytron (Polytron Aggregate – PT 2100 – Kinematica – Swiss) using protein extraction buffer (0.3 M Sucrose; 0.1 M KCl; 20 mM Tris-HCl, pH 7.0). The homogenate was centrifuged for 40 min at 12,000 g (Eppendorf Centrifuge – 5415R – Hamburg - Germany) and the protein content of the supernatant (cytosolic fraction) was determined by Bradford method (Ausubel et al. 1995). Cytosolic protein samples (15 µg) were treated with Laemmli sample buffer (Laemmli 1970), heated in a boiling water bath for 10 min and resolved by sodium dodecyl sulfate-polyacrylamide gel electrophoresis (SDS PAGE) using a 4% acrylamide stacking gel and a 18% acrylamide resolving gel. Electrotransfer of proteins from the gel to nitrocellulose membrane was performed for 90 min at 300 mA. After transfer protein from gel to membrane, nonspecific protein binding to the nitrocellulose membrane was reduced by preincubating the membrane 2 h at room temperature in blocking buffer (1% nonfat dry milk, 137 mM NaCl, 2.7 mM KCl, 8 mM NaHPO4, 1.4 mM KH2PO4, and 0.02% Tween 20). The nitrocellulose membrane was incubated with human anti myoglobin antiserum (1/5000; Sigma. Modified from Giannocco et al. 2004 and Sertié et al. 2014), diluted in blocking buffer overnight at 4°C and washed for 30 min with the blocking buffer
without milk. The membranes were, then, incubated with secondary antibody in blocking buffer (137 mM NaCl, 2.7 mM KCl, 8 mM NaHPO4, 1.4 mM KH2PO4, and 0.02% Tween 20) for 1 h at room temperature and then washed again for 30 min as described above (Maniatis et al. 1989).
The bands were detected by chemiluminescence using the home made ECL solution, consisting of solution A (1 M Tris - pH 8.5; Pecumaric; Luminol and ultra-pure water) and solution B (1 M Tris - pH 8.5; hydrogen peroxide 30% and ultra-pure water), which were mixed at the time of use. The nitrocellulose membranes were Ponceau stained for a better analyses of the equal loading of the gels (Romero-Calvo et al. 2010, Tang et al. 2011, Vitzel et al. 2013, Fortes et al. 2016). Blot densitometry was evaluated using Image J Software (National Institutes of Health, Bethesda, MD, USA). Results were expressed as arbitrary units (AU).
HEMATIMETRIC PARAMETERS
Hematocrit: Capillary tubes were filled with samples of heparinized blood, sealed with Bunsen burner and placed in a micro centrifuge specific to it, at 12,000 g for 7 min. The hematocrit was read in a hematocrit reader.
Red Blood Cell (RBC) count: A sample containing 20 µl of heparinized blood was added to 4.0 ml of a solution containing sodium citrate 3.8 g, formaldehyde 2.0 ml distilled water 100.0 ml (dilution 1:200). Cells were counted in a Neubauer chamber using an optical microscope. The count was made at the central reticulum of the chamber, and the following calculation was made: Red blood cells per mm3 of blood = Hc x 5 x 10 x 200 (where
5 is the conversion factor for 1 mm2, 10 to 1 mm3 and 200 is the dilution factor).
was converted to cyanide Hb by reaction with sodium cyanide at pH 7.2. The samples were read on a spectrophotometer at 540 nm.
Serum iron levels: Serum iron was assessed by a specific dosage kit (Serum Iron LABTEST), based on the method of Goodwin (1966), modified. Mean corpuscular volume (MCV), mean cor-puscular Hb (MCH) and mean corcor-puscular Hb con-centration (MCHC) calculations:These parameters were calculated by using the following formulas:• MCV (fentoliter) = hematocrit (%) x 10/red blood cells (millions); • HCM (picogram) = Hb (g/dL) x 10/red blood cells (millions); • MCHC (%) = Hb (g/dL) x 100/hematocrit (%) (Failace 2011).
STATISTICAL ANALYSIS OF THE DATA
Kolmorogov-Smirnov test was used to determine the normality of the distributions. As the data showed a normal distribution, statistical procedures were per-formed by analysis of variance (ANOVA one way), followed by post-test Student-Newman-Keul. When only two groups were compared, we used the un-paired T test. All values were expressed as mean ± standard error of the mean (X ± s.e.m.) and signifi -cance was defined by the values of P <0.05.
RESULTS
LONG-TERM STUDY
As observed in Table I, the animals that received iron supplementation or restriction had no significant
differences in the serum iron concentration, hematocrit and MCH compared with the control group. However, the number of red blood cell was increased in the iron supplementation group (IS - 8.838.000 ±206.574) and in the iron restriction group (IR - 8.680.000 ±95.917) compared to control group (7.524.000 ±322.810). Since hematocrit of both treatment groups, IS (53.5% ±0.5) and IR (52.4% ±0.6), was not different compared to control (49.4% ±2.3), when we calculated MCV in IS (60.63 fL ±1.42) and IR (60.38 fL ±0.62) presented decreased compared to control (65.72 fL ±1.67), which means that even presenting a higher number of cells in both treatments compared to control, in a small hematocrit, this means that the volume of the cells are reduced. In addition, IR group showed a significant increase in the Hb (16.19 g/dL ±0.26) content and MCHC (30.89% ±0.24) compared to control (14.30 g/dL ± 0.37 Hb, 29.08% ±0.92 MCHC) and IS (15.15 g/dL ±0.40 Hb, 28.30% ±0.50 MCHC).
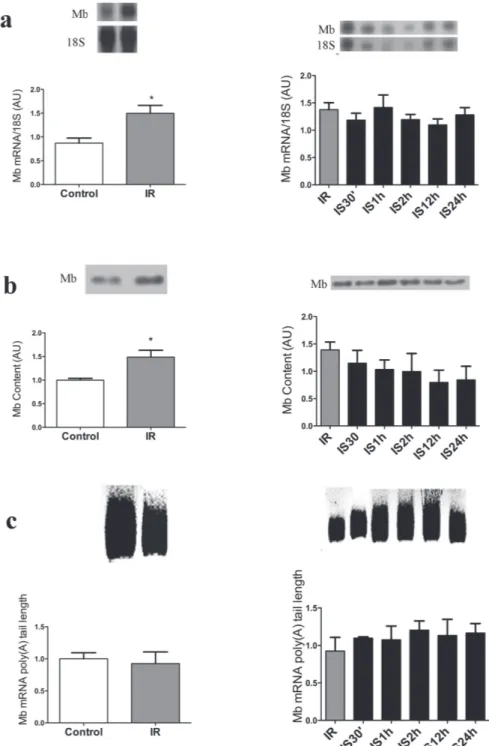
The data of Mb mRNA and protein expression, as well as of Mb mRNA poly(A) tail length in soleus, EDL and heart muscle are shown in the figures 1, 2 (a-c) and 2 (d-f) respectively. Figure 1a shows that Mb gene expression is increased 1.9 X in IR group (1.928 ±0.394) compared to control (1.000 ±0.093) and 2.2X compared to IS (0.876 ±0.095) groups. Figure 1b presents Mb protein content, and the IR group (1.528 ±0.1736) Mb content is increased 1.5X compared to control (1.000 ±0.057) and 1.4X
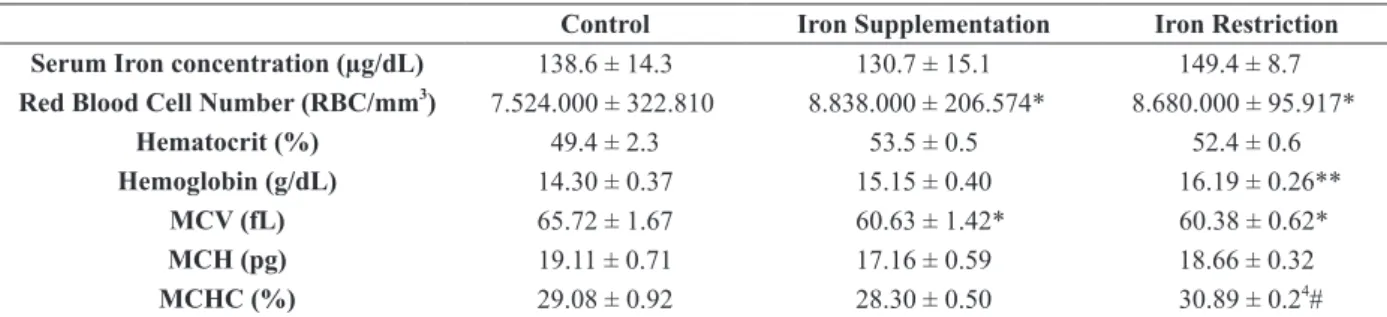
TABLE I
Effect of iron supplementation or restriction on serum iron concentration and blood cells parameters in rats. Control Iron Supplementation Iron Restriction Serum Iron concentration (µg/dL) 138.6 ± 14.3 130.7 ± 15.1 149.4 ± 8.7
Red Blood Cell Number (RBC/mm3
) 7.524.000 ± 322.810 8.838.000 ± 206.574* 8.680.000 ± 95.917*
Hematocrit (%) 49.4 ± 2.3 53.5 ± 0.5 52.4 ± 0.6
Hemoglobin (g/dL) 14.30 ± 0.37 15.15 ± 0.40 16.19 ± 0.26**
MCV (fL) 65.72 ± 1.67 60.63 ± 1.42* 60.38 ± 0.62*
MCH (pg) 19.11 ± 0.71 17.16 ± 0.59 18.66 ± 0.32
MCHC (%) 29.08 ± 0.92 28.30 ± 0.50 30.89 ± 0.24
# Data are reported as means ± s.e.m of 3 independent experiments. MCV: mean corpuscular volume; MCH: mean corpuscular
hemoglobin; MCHC: mean corpuscular hemoglobin concentration. * P <0.05 vs control, # P <0.05
compared to IS (1.084 ±0.126) groups. However, when we evaluated poly(A) tail in Soleus muscle the length of this tail was not altered in IS (1.154 ±0.142) and IR (1.319 ±0.212) groups compared
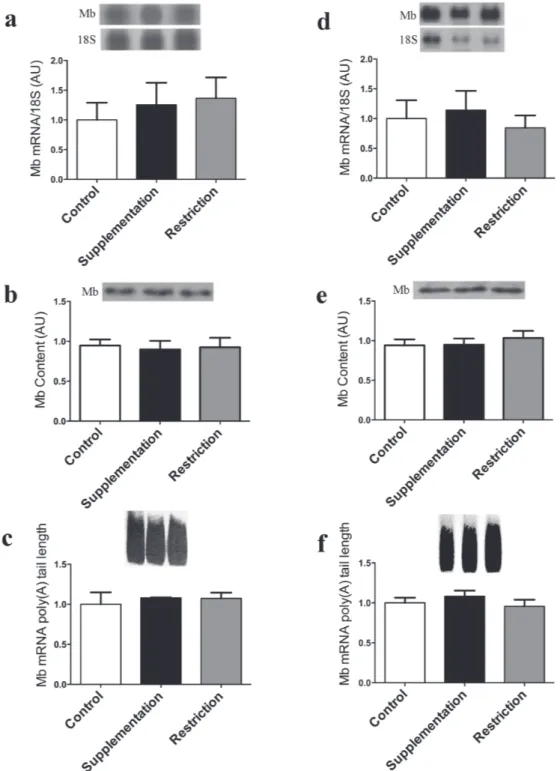
to control (1.000 ±0.084). No significant changes were observed in all studied parameters in EDL and heart muscles in the different treatment conditions studied (Figure 2 a-c and Figure 2 d-f, respectively).
Figure 1 - Iron Restriction increased myoglobin gene and protein expression in Soleus muscle. a – Northern blot analysis of Soleus muscle Mb mRNA and 18S ribosomal subunit expression of control, iron-supplemented (30 days) and iron-restricted (30 days) rats is shown at the top, and the graphic representation of the ratio of Mb and 18S mRNA blots densitometry in
shown at the bottom of the figure in arbitrary units (AU); b - Western blot analysis of the Soleus muscle Mb content (at the top) and the graphic representation of the blots densitometry (at the bottom); c – At the top, the amplicon sizes are represented by the smear formed after PCR; at the bottom, the graphical representation of Mb mRNA poly(A) tail length based on of the amplicon sizes estimated from the bottom to the top of the smear formed. Data are reported as means ± s.e.m of 3
Figure 2 - Iron restriction or supplementation do not affect Myoglobin gene and protein expression in Extensor Digitorum
Longus and Cardiac Muscle. Northern blot analysis of EDL Muscle (a) and Cardiac Muscle (d) Mb mRNA and 18S ribosomal subunit expression in control, iron-supplemented (30 days) and iron-restricted (30 days) rats is shown at the top, and the graphic
representation of the ratio of Mb and 18S mRNA blots densitometry is shown at the bottom of the figure in arbitrary units (AU);
SHORT-TERM STUDY
As already pointed out, iron restriction did not change serum iron concentration (173.2 ±10.76), which remained similar to that of the control group (172.8 ±24.85). When IR animals were subjected to acute iron treatment, a significant increase in serum iron was observed, at all times studied: 30’ (289.4 ±50.32); 1h (287.3 ±16.73); 2 h (257.5 ±25.18); 12h (298.1 ±21.63) compared to control, however at 24 h (124.3 ±13.99) serum iron concentration
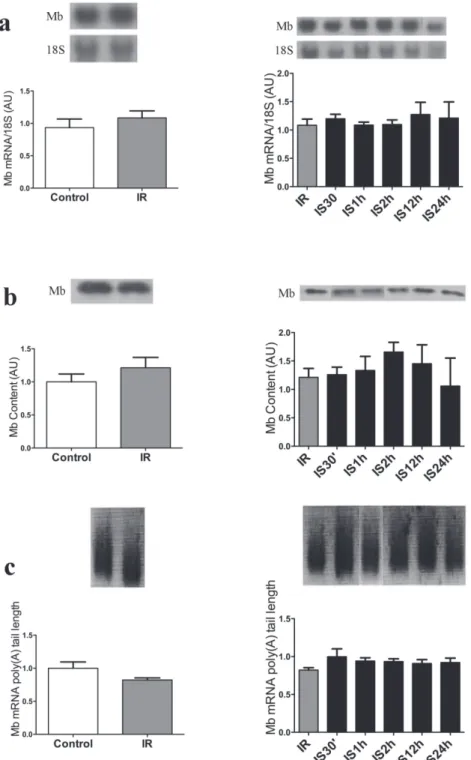
presented significantly decreased compared to 30’, 1 h, 2 h, and 12 h and was similar to control and IR groups (Table II). Mb gene and protein expression was not significantly altered in the three tissues and all times studied (Figures 3 to 5). The same occurred with the Mb mRNA poly (A) tail length, as shown in Figures 3c to 5c. The left side of Figures 3, 4 and 5 presents the results of iron-restricted compared to control animals before the acute iron supplementation.
Table II
Serum iron concentration of rats subjected to iron restriction (IR) and iron restriction followed by iron supplementation for 30’ (IS30’), 1 (IS1h), 2 (IS2h), 12 (IS12h) and 24 h (IS24h).
Treatment Control IR IS30’ IS1h IS2h IS12h IS24h
Serum Iron concentration (µg/dL) 172.8 ± 24.85 173.2 ± 10.76 289.4 ±
50.32*$ 287.3 ±
16.73**$$ 257.5 ±
25.18*$ 298.1 ±
21.63*$$ 124.3± 13.99## ###
Data are reported as means ± s.e.m. of 3 independent experiments * P <0.05,** P <0.01 vs control; $ P <0.05, $$ P <0.01
vs IR (Iron Restriction); ## P <0.01 vs IS30’ and IS2h (Iron restriction followed by Iron supplementation for 30’ and 2h); ### P <0.001
vs IS1h and IS12h (iron restriction followed by Iron supplementation for 1h and 12h. One-way ANOVA. The number of animals used per group varied from 6 to 8.
DISCUSSION AND CONCLUSIONS
Mb plays a central role in muscle cells functions, such as storage and transport of oxygen to the mitochondria, these processes are dependent on the presence of iron in the heme group of this protein (Andrews 2000, Hentze and Kühn 1996, Niederkofler et al. 2005). Besides these, some proteins involved with iron metabolism are regulated by very specific mechanisms that are triggered by the intracellular level of iron, a trace element that leads to alterations in the half-life of the messenger RNAs that encode them (Hentze and Kühn 1996). Taking into account these considerations, in this study we evaluated the repercussions of iron supplementation and restriction, as well as iron restriction followed by an iron short-term treatment (30 min to 24 h) on Mb mRNA content and poly(A) tail length and Mb expression in skeletal (Soleus and EDL) and cardiac muscle.
Our results showed that iron supplementation for 30 days does not affect Mb mRNA and protein
expression, as well the poly(A) tail length of this transcript, data that suggest that Mb does not seem to have a role in iron homeostasis. Dallman and Schwartz (1965) showed that during iron anemia the content of Mb decreases to a very low level, and also showed that after oral iron supplementation, Mb take longer than other proteins, such as Hb, to recover the normal state.
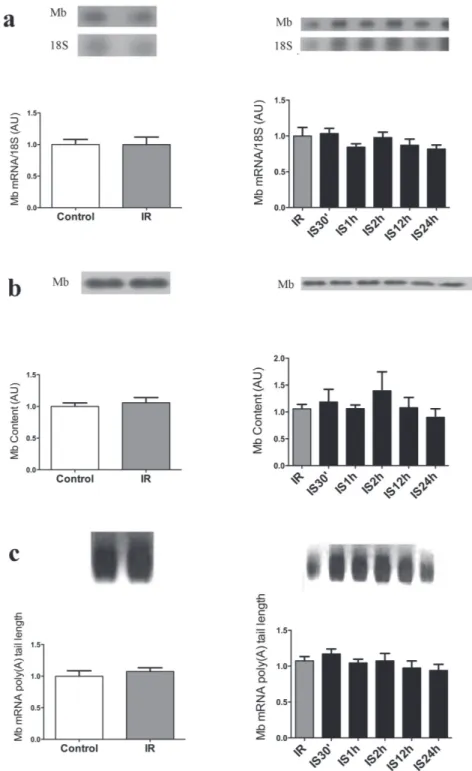
Figure 3 - Acute iron supplementation following iron restriction does not change myoglobin gene and protein expression in Soleus muscle. a - Northern blot of Soleus muscle Mb mRNA and 18S ribosomal subunit expression of control, iron restricted (30 days - IR), and after restriction rats received by I.p. Injection of iron within 30 min to 24 h (IS30’, IS1h, IS2h, IS12h, IS24h), is shown at
the top, and the graphic representation of the ration of Mb and 18S mRNA blots densitometry is shown at the bottom of the figure
in arbitrary units (AU). b - Westhern blot analysis of the Soleus muscle Mb content (at the top) and graphic representation of the blots densitometry (at the bottom). c - At the top, the amplicom sizes are represented by the smear formed after PCR; at the bottom, the graphical representation of Mb mRNA poly(A) tail length based on of the amplicon sizes estimated from the bottom to the top of the smear formed. The left side of a, b and c presents the results of iron-restricted vs control animals before the acute iron
Figure 4 - Acute iron supplementation following iron restriction does not change myoglobin gene and protein expression in EDL muscle. a - Northern blot of EDL muscle Mb mRNA and 18S ribosomal subunit expression of control, iron restricted (30 days - IR), and after restriction rats received by I.p. Injection of iron within 30 min to 24 h (IS30’, IS1h, IS2h, IS12h, IS24h), is shown at the
top, and the graphic representation of the ration of Mb and 18S mRNA blots densitometry is shown at the bottom of the figure in
Figure 5 - Acute iron supplementation following iron restriction does not change myoglobin gene and protein expression in Cardiac muscle. a - Northern blot of cardiac muscle Mb mRNA and 18S ribosomal subunit expression of control, iron restricted (30 days - IR), and after restriction rats received by I.p. Injection of iron within 30 min to 24 h (IS30’, IS1h, IS2h, IS12h, IS24h), is shown at the top, and the graphic representation of the ration of Mb and 18S mRNA blots densitometry is shown at the bottom of the
Serum iron and Hb concentrations also remained unaltered in iron supplementation condition. It is known that under iron loading, hepcidin production increases, leading to the reduction of iron export into plasma from enterocytes and macrophages, and the contrary occurs in iron deprivation states. By these mechanisms, this protein regulates plasma iron concentration according to the need of the body (Knutson 2010, Anderson et al. 2007, Ganz and Nemeth 2012), and this could explain why serum iron concentration was kept similar to the control group levels. Our data on Hb content in this condition is also consistent with those of Blayney et al. (1976) study, in which no significant difference in Hb concentration was observed in rats receiving oral iron supplementation. Interestingly, the rats subjected to iron supplementation and iron restriction showed a significant increase in red blood cell quantity, but a reduction of their mean corpuscular volume, which could explain why the hematocrit remained similar to the control group.
On the other hand, long-term iron restriction (30 days) led to an increase on Mb gene and protein expression, and this effect was tissue-specific, since it was restricted to the soleus muscle. In parallel, there was an increase in the Hb concentration, as compared to control, showing that the 30-day treatment with tannic acid may lead to an increase in protein, prior to installing an anemia that would take longer to occur with such treatment (Afsana et al. 2004). This might suggest that when the supply of iron is reduced, responses are triggered leading to increased synthesis of this protein, which could represent a mechanism to facilitate the storage of iron in an attempt to keep their essential functions for O2 transport through the tissues. The use of tannic acid as iron chelator is due its capacity to decrease iron bioavailability to the organism forming a tannin-iron complex (Disler et al. 1975, Andrews et al. 2014, Jamarillo et al. 2015, Oh et al. 2015). Just as occurred with the soleus muscle, which had an increase of Mb expression in the
iron-restricted rat. The HIF alpha 1 mRNA expression in the iron-restricted group was shown to be decreased, however, the difference failed to reach statistical significance (data not shown). Thus, it seems that in this situation the supply of O2 to the tissues is being maintained within the normal range. It is known that HIF 1 alpha is upregulated by hypoxia and by iron chelators. Thus, reduced iron availability could be one factor that, by enhancing HIF alpha, could lead to the increase in the Mb content in iron-restricted groups. Also, regarding hematology evaluation conducted on the long-term study, it was found that the observed increase in the number of red blood cells in the treated groups, although significant, does not represent abnormality. These results are in accordance with the data observed by Akase et al. (2004) and Cerven et al. (2008), that is, in our data (number of red blood cells, hematocrit, hemoglobin, MCV, MCH and MCHC) have values that are between the reference data, concerning the animals that received no treatment, and are within a reference range considered normal. That is, the significant increase in red blood cells observed in the groups submitted to the treatments described, without increasing of the hematocrit, indicates that the mean corpuscular volume of them is less than the control group, but this information does not indicate that these cells are microcytic.
The iron supplementation for short periods of time after rats have been iron-restricted for 30 days did not promote any alteration in the poly(A) tail length nor in the Mb mRNA content. This data further support the point we have raised, that Mb does not seem to have a role in iron homeostasis when iron is in abundance. This seems not to be true in iron restricted-conditions, when rapid responses were elicited on Hb, as well as on Mb expression.
ACKNOWLEDGMENTS
M.T. Nunes is the recipient of fellowship from the Conselho Nacional de Desenvolvimento Científico e Tecnológico (CNPq - 305659/2009-0). Leonice L. Poyares for excellent technical assistance during this study. Ted Buras for English revision.
REFERENCES
AFSANA K, SHIGA K, ISHIZUKA S AND HARA H. 2004. Reducing effect of ingesting tannic acid on the absorption of iron, but not of zinc, copper and manganese by rats. Biosci Biotechnol Biochem 68(3): 584-592.
AKASE T, ONODERA S, MATSUSHITA R, AKASE T AND TASHIRO S. 2004. A comparative study of laboratory parameters and symptoms effected by Toki-shakuyaku-san and an iron preparation in rats with irons-deficiency anemia. Biol Pharm Bull 27(6): 871-878.
ANDERSON GJ, DARSHAN D, WILKINS SJ AND FRAZER DM. 2007. Regulation of systemic iron homeostasis: how the body responds to changes in irons demand. Biometals 20: 665-674.
ANDERSON GJ, FRAZER DM AND MCLAREN GD. 2009.
Iron absorption and metabolism. Curr Opin Gastroenterol 25: 129-135.
ANDREWS M, BRIONES L, JARAMILLO A, PIZARRO F AND ARREDONDO M. 2014. Effect of calcium, tannic acid, phytic acid and pectin over iron uptake in an in vivo
Caco-2 cell model. Biol Trace Elem Res 158(1): 122-127. ANDREWS N. 2000. Iron metabolism: Iron deficiency and
iron overload. Annu Rev Genomics Hum Genet 01: 75-98. AUSUBEL FM, BRENT R, KINGSTON RE, MOORE DP,
SEIDMAN JG, SMITH JA AND STRUHL K. 1995. Current protocols in molecular biology. Greene Publishing Associates and Wiley-Interscience, New York.
BEARD JL, BRIGHAM DE, KELLEY SK AND GREEN MH. 1998. Plasma Thyroid Hormone Kinetics are Alteres in Iron-Deficient Rats.J Nutr 128(8): 1401-1408.
BLAYNEY L, BAILEY-WOOD R, JACOBS A, HENDERSON A AND MUIR J. 1976. The effects of iron deficiency on the respiratory function and cytochrome content of rat heart mitochondria. Circ Res 39: 744-748.
BUTT J, KIM HY, BASILION JP, COHEN S, IWAI K, PHILPOTT CC, ALTSCHUL S, KLAUSNER RD AND ROUAULT TA. 1996. Differences in the RNA binding sites of iron regulatory proteins and potential target diversity. Proc Natl Acad SciUSA 93: 4345-4349. CERVEN D, DEGEORGE G AND BETHELL D. 2008.
28-Day repeated dose oral toxicity of recombinant human holo-lactoferrin in rats. Regul Toxicol Pharmacol 52: 174-179.
CHOMCZYNSKI P AND SACCHI N. 1987. Single-step method of RNA isolation by acid guanidinium
thiocya-nate-phenol chloroform extraction. Anal Biochem162: 156-159.
CONRAD ME AND UMBREIT JN. 2000. Iron absorption and transport – An update. Am J Hematol 64: 287-298. DALLMAN PR AND SCHWARTZ HC. 1965. Myoglobin and
cytochrome response during repair of iron deficiency in the rat. J Clin Invest 44(10): 1631-1638.
DISLER PB, LYNCH SR, TORRANCE JD, SAYERS MH, BOTHWELL TH AND CHARLTON RW. 1975. The mechanism of the inhibition of iron absorption by tea. S Afr J Med Sci 40(4): 109-116.
EBNER N AND VON HAEHLING S. 2013. Iron deficiency in heart failure: a practical guide. Nutrients 5(9): 3730-3739.
FAILACE R. 2011. Hemograma: Manual de interpretação. ArtMed, Porto Alegre, 424 p.
FORTES MAS, MARZUCA-NASSR GN, VITZEL KF, PINHEIRO CHJ, NEWSHOLME AND CURI R. 2016. Housekeeping proteins: how useful are they in skeletal muscle diabetes studies and muscle hypertrophy models? Anal Biochem 504: 38-40.
GANZ T AND NEMETH E. 2012. Hepcidin iron homeostasis. Bioch Biopys Acta1823(9): 1434-1443.
GERA T AND SACHDEV HPS. 2002. Effect of iron supple-mentation on incidence of infectious illness in children: systematic review. BMJ 325: 1142-1152.
GIANNOCCO G, DOS SANTOS RA AND NUNES MT. 2004. Thyroid hormone stimulates myoglobin gene expression in rat cardiac muscle. Mol Cell Endocrinol 226(1-2): 19-26.
HASS JD AND BROWNLIE T. 2001. Iron deficiency and reduced work capacity: A critical review of the research to determine a casual relationship. J Nutr, p. 676-690. HE WL, FENG Y, LI XL AND YANG XE. 2008. Comparison
of iron uptake from reduced iron powder and FeSO4 using the Caco-2 cell model: effects of ascorbic acid, phytic acid, and pH. J Agric Food Chem 56: 2637-2642.
HEGDE N, RICH MW AND GAYOMALI C. 2006. The cardiomyopathy of iron deficiency. Tex Heart Inst J 33: 340-344.
HENTZE MW AND KÜHN LC. 1996. Molecular control of vertebrate iron metabolism: mRNA-based regulatory circuits operated by iron, nitric oxide, and oxidative stress. Proc Natl Acad SciUSA 93: 8175-8182.
JAMARILLO A, BRIONES L, ANDREWS M, ARREDONDO M, OLIVARES M, BRITO A AND PIZARRO F. 2015. Effect of phytic acid, tannic acid and pectin on fasting iron bioavailability both in the presence and absence of calcium. J Trace Elem Med Biol 30: 112-127.
LAEMMLI UK. 1970. Cleavage of structural proteins during the assembly of the head of bacteriophage T4. Nature 227: 680-685.
LI C AND STOCKER R. 2009. Heme oxygenase and iron: from bacteria to humans. Redox Rep 14(3): 95-101. MANIATIS T, FRITSCH EF AND SAMBROOK J. 1989.
Molecular cloning - a laboratory manual. Vol 1, 2 and 3. 2nd
ed., Cold Spring Harbor Laboratory Press, New York. MOY RJD AND EARLY AR. 1999. Iron deficiency in
childhood. J R Soc Med 92: 234-236.
NIEDERKOFLER V, SALIE R AND ARBER S. 2005. Hemojuvelin is essential for dietary iron sensing, and its mutation leads to severe iron overload. J Clin Invest 115 (8): 2180-2186.
NÚÑEZ MT, URRUTIA P, MENA N, AGUIRRE P, TAPIA V AND SALAZAR J. 2012. Iron toxicity in neurodegeneration. Biometals 24: 761-776.
OH DX, PRAJATELISTIA E, JU AW, JEONG KIM H, BAEK SJ, JOON CHA H, HO JUN S, AHN JS AND SOO HWANG D. 2015. A rapid, efficient, and facile solution for dental hypersensitivity: The tannin-iron complex. Sci Rep 5: 10884.
ONODERA H, KITAURA K, MITSUMORI K, YOSHIDA J, YASUHARA K, SHIMO T, TAKAHASHI M AND HAYASHI Y. 1994. Study on the carcinogenicity of tannic acid F344 rats. Food Chem Toxicol 32(12): 1101-1106. ORDWAY GA AND GARRY DJ. 2004. Myoglobin: an
essential hemoprotein in striated muscle.J Exp Biol 207: 3441-3446.
PAIVA AA, RONDÓ PHC AND GUERRA-SHINOHARA EM. 2000. Parâmetros para avaliação do estado nutricional de ferro. Rev Saúde Pública 34(4): 421-426.
REARDON TF AND ALLEN DG. 2009. Iron injections in mice increase skeletal muscle iron content, induce oxidative stress and reduce exercise performance.Exp Physiol 94(6): 720-730.
ROBACH P ET AL. 2007. Strong iron demand during hypoxia-induced erythropoiesis is associated with down-regulation of iron-related proteins and myoglobin in human skeletal muscle. Blood 109: 4724-4731.
ROBACH P ET AL. 2009. Alterations of systemic and muscle iron metabolism in humans subjects treated with low-dose recombinant erythropoietin. Blood 113: 6707-6715.
RODRIGUEZ A, HILVO M, KYTÖMÄKI L, FLEMING RE, BRITTON RS, BACON BR AND PARKKILA S. 2007. Effects of iron loading on muscle: genome-wide mRNA expression profiling in the mouse. BMC Genomics 8: 379-394.
ROMERO-CALVO I, OCÓN B, MARTÍNEZ-MOYA P, SUÁREZ MD, ZARZUELO A, MARTÍNEZ-AUGUSTIN O AND DE MEDINA FS. 2010. Reversible Ponceau staining as a loading control alternative to actin in Western blots. Anal Biochem 401: 318-320.
SALLÉS FJ, RICHARDS WG AND STRICKLAND S. 1999. Assaying the polyadenylation state of mRNAs. Methods 17(1): 38-45.
SERTIÉ RAL, SERTIÉ AL, GIANNOCCO G, POYARES LL AND NUNES MT. 2014. Acute growth hormone administration increases myoglobin expression and Glut4 translocation in rat cardiac muscle cells. Metabolism 63(12): 1499-1502.
SHER EA, SHOLTO AY, SHAKLAI M AND SHAKLAI N. 2014. Can gas replace protein function? CO abrogates the oxidative toxicity of myoglobin. PLoS One 9(8): e104075. SHIKAMA K. 2005. Nature of the FeO2 bonding in myoglobin end hemoglobin: A new molecular paradigm. Prog Biophys Mol Biol 91(1-2): 83-162.
SKARPANSKA-STEJNBORN A, BASTA P, TRZECIAK J AND SZCZESNIAK-PILACZYNSKA L. 2015. Effect of intense physical exercise on hepcidin levels and selected parameters of iron metabolism in rowing athletes. Eur J Appl Physiol 115(2): 345-351.
TANG W ET AL. 2011. PP2A activates brassinosteroid-responsive gene expression and plant growth by dephosphorylating BZR1. Nat Cell Biol 13: 124-131. VITZEL KF, BIKOPOULOS G, HUNG S, PISTOR KE,
PATTERSON JD, CURI R AND CEDDIA RB. 2013. Chronic treatment with the AMP-kinase activator AICAR increases glycogen storage and fatty acid oxidation in skeletal muscles but does not reduce hyperglucagonemia and hyperglycemia in insulin deficient rats. PLoS One 8(4): e62190.