FUNDAÇÃO GETULIO VARGAS
ESCOLA BRASILEIRA DE ADMINISTRAÇÃO PÚBLICA E DE EMPRESAS MESTRADO EXECUTIVO EM GESTÃO EMPRESARIAL
HYDRAULIC FRACKING: A MARKET FORECAST - COLOMBIA
DISSERTAÇÃO APRESENTADA À ESCOLA BRASILEIRA DE ADMINISTRAÇÃO
PÚBLICA E DE EMPRESAS PARA OBTENÇÃO DO GRAU DE MESTRE
FABIAN MENDOZA VARELA Rio de Janeiro – 2016
FABIAN MENDOZA VARELA
HYDRAULIC FRACKING: A MARKET FORECAST - COLOMBIA
Master`s thesis presented to Corporate International Master`s program, Escola brasileira de Administracao Publica, Fundacao Getulio Vargas, as a requirement for obtaining the title of Master of Business Management.
DSc. MARCOS LOPEZ REGO
I dedicate this work to my family: my wife, daughters and parents, who always supported me even during those difficult times. Thank you.
Ficha catalográfica elaborada pela Biblioteca Mario Henrique Simonsen/FGV
Mendoza Varela, Fabian
Hydraulic fracking : a market forecast : Colombia/ Fabian Mendoza Varela. – 2016.
86 f.
Dissertação (mestrado) - Escola Brasileira de Administração Pública e de Empresas, Centro de Formação Acadêmica e Pesquisa.
Orientador: Marcos Lopez Rego. Inclui bibliografia.
1.Administração de projetos - Colômbia. 2. Indústria petrolífera - Política governamental. 3. Indústria petrolífera - Capacidade industrial. 4. Gás
natural - Indústria. I. Rego, Marcos Lopez. II. Escola Brasileira de Administração Pública e de Empresas. Centro de Formação Acadêmica e Pesquisa. III. Título. CDD – 658.404
ACKNOWLEDGMENTS
I would like to express my gratitude to my advisor, Professor Marcos Lopez Rego for his useful comments, remarks and commitment throughout the learning process of this master´s thesis. Furthermore, I would like to thank those people who provided guidance and insight during the whole process: new friends, professors, support staff, and last but not least, thanks to my amazing friend Leonardo, who encouraged me to take on this challenge as well as for his support along this journey.
TABLE OF CONTENTS
ABSTRACT ... 11
INTRODUCTION ... 12
I. COLOMBIA´S OIL HISTORY ... 13
1.1. A Brief Introduction ... 13
1.2. Contract Models ... 13
1.3. The National Hydrocarbons Agency – (ANH) ... 15
1.4. Thesis Justification & Objectives ... 17
1.5 Theoretical Framework ... 18
1.5.1 What is a Business Plan? ... 18
1.5.2 Strategic Planning ... 20
1.5.3 Situational Analysis – SWOT ... 21
1.5.4 Model of Michael Porter's 5 Forces ... 23
1.5.5 Generic Strategies ... 26
1.5.6 Business System ... 30
II. THE CURRENT OIL MARKET SITUATION ... 34
2.1. Oil Production ... 36
2.2. Unconventional Resources in Colombia ... 38
2.3. Literature and Study Review ... 40
2.4. Unconventional Extractive Technology ... 43
III COLOMBIA’S FRACTURING MARKET ... 46
IV BUSINESS INTRODUCTION STRATEGY ... 49
4.1. SWOT Analysis ... 50
4.2 PORTER´S FIVE FORCES ... 50
4.2.1 Competitor Power ... 51
4.2.2 New Entrance Threat ... 54
4.2.3 Substitution ... 56
4.2.4 Buyer Power ... 56
V BUSINESS PLAN ... 58
5.1 STRATEGIC PLAN ... 60
5.1.1 Purchasing & Supply ... 60
5.1.2 Equipment... 61
5.1.3 Organization ... 62
5.1.4 Marketing ... 63
5.1.5 Pricing ... 67
5.2 FINANCIAL PLAN ... 67
5.2.1 Methodology and Data Collection ... 68
5.2.2 Risk Analysis ... 70
5.2.3 Risk Mitigation Strategy ... 71
VI. CONCLUSIONS ... 73
REFERENCES ... 75
ANNEX 1. HYDRAULIC FRACTURING TREATMENT PROCESS ... 79
ANNEX 2. RESOURCES REQUIRED TO PERFORM HYDRAULIC FRACTURING ... 83
LIST OF FIGURES
FIGURE 1. DIRECT FOREIGN INVESTMENT IN COLOMBIA. ... 16
FIGURE 2. PORTER’S FIVE FORCES INTERACTION ... 25
FIGURE 3. PORTER´S GENERIC STRATEGIES ... 27
FIGURE 4. OIL RESERVES TO PRODUCTION RATIO ... 34
FIGURE 5. OIL SECTOR ACTIVITY ... 35
FIGURE 6. COLOMBIA´S OIL PRODUCTION ... 37
FIGURE 7. UNCONVENTIONAL OIL & GAS RESOURCE ALLOCATION ... 39
FIGURE 8. RESERVES INCORPORATION SCENARIO ... 44
FIGURE 9. OIL PRODUCTION FORECAST, BASE RESERVOIR INCORPORATION CASE ... 44
FIGURE 10. OIL PRODUCTION FORECAST, ARGENTINA ... 45
FIGURE 11. COMPANIES WITH ACTIVITY IN UNCONVENTIONAL PLAYS ... 46
FIGURE 12. SWOT ANALYSIS ... 49
FIGURE 13. HYDRAULIC FRACTURE MARKET SHARE... 54
FIGURE 14. BRENT AND WTI OIL PRICE EVOLUTION ... 59
FIGURE 15. OPTIMIZED ORGANIZATIONAL STRUCTURE ... 62
LIST OF TABLES
TABLE 1. PRODUCTION DISTRIBUTION RATE ACCORDING TO THE R FACTOR (%) ... 14
TABLE 2-7. UNCONVENTIONAL OIL & GAS POTENTIAL RESERVES ... 41
TABLE 8. WELLS TO FRACTURE FORECAST ... 47
TABLE 9. MAIN OIL AND GAS SERVICE COMPANIES’ FINANCIAL RESULTS ... 53
TABLE 10. HYDRAULIC FRACTURING PRICE PER STAGE ... 56
TABLE 11. POSITION INVESTMENT MARKETING ... 65
TABLE 12. INITIAL EQUIPMENT REQUIRED – CAPEX ... 68
TABLE 13. MARKET SHARE SCENARIOS ... 68
TABLE 14. PROBABILITY OF OCCURRENCE ... 69
TABLE 15 SENSITIVITY ANALYSIS FINANCIAL PLAN.. ... 69
ABSTRACT
The oil and gas exploration and production industry normally has three major actors, the first one being the governments, who dictate the “game” rules and provide the framework for attracting investors to this sector. The second one consists of operators, large companies and joint ventures between experienced operators and investment funds who are seeking attractive returns on investments, and the third actor is service companies who provide all services required to extract oil and gas from the subsurface and send them to refineries.
The oil and gas service market moves according to international oil prices. High prices mean more exploration, which in turn mean more investment and opportunities for service companies. After more than five marvelous years of a boom in oil prices, a contraction is severely affecting the oil and gas industry. An option for international or multinational oil and gas service companies is to diversify their geographic areas of influence and expand their presence in countries where oil and gas investors are moving resources, especially in countries where oil and gas represent a significant percentage of its Gross Domestic Product (GDP) and government rules are more flexible, which increases the possibility to maximize returns.
The purpose of this paper is to understand if it is possible to introduce a specific service from a Chinese oil and gas service company in Colombia under the current economic situation: hydraulic fracturing services for unconventional resources. By using data from previous studies that estimate the unconventional resources potential in Colombia, current and potential customers, service and price benchmarking, some market positioning strategies as well a risk mitigation plan that could reduce exposure, it will be possible to ascertain whether it applies to this new service or not, and if possible, to determine what barriers could this company face to obtain its goal.
INTRODUCTION
This document comprises six chapters. The first chapter briefly introduces Colombia`s oil history and the evolution of government contracts; furthermore, it specifies the main and secondary objectives of this document and what tools from economic theories will be useful to reach them. The second begins with an introduction of the current situation of the Colombian oil and gas market. It shows the key indicators that reflect the country’s trend, beginning in some cases fifteen years ago to analyze with a clear view of the domestic oil and gas context. The review of studies, just a few that focus on Colombia´s unconventional reservoirs, will give us the possibility to determine if this could be a promissory market, analyzing the volume of those resources and the current offer of services, a simple offer-demand overview, those studies, also, will give us support to formulate a probabilistic analysis, which is a must to introduce readers to the basics of unconventional resources exploitation, and which is why a brief overview of this theme is included in this chapter.
Chapter three includes information about the potential market for unconventional reservoirs, moving forward, and includes figures obtained from operator companies, some of which even already have contracts signed and who are interested in obtaining those resources in Colombia.
Chapter four explains the methodology used, including some economic theories which can be put into practice, and the basic principles for companies’ evaluation with some essential assumptions that must be taken into account in order to provide consistent recommendations. At the end of chapter, the five project evaluation from a financial perspective will show final results and how those will be compared to each other. It describes the methodology used, limitations, analysis of collected and compared data and how they relate to the main objective, as well as risk mitigation plans. Chapter six collects conclusion closing out this document.
I. COLOMBIA´S OIL HISTORY
1.1. A Brief IntroductionThe existence of oil in Colombia dates back to the period of the conquest of the Americas, when Gonzalo Jiménez de Quesada, founder of Santa Fé de Bogotá, was the first one to report the presence of “black gold” in oil outcrops near the middle of the Magdalena river valley, which were called “Las Infantas” in honor of two princesses of Spain.
Before that age, in the XVI century, indigenous people used oil for different purposes, including medicinal ones. At the end of the XIX century, the first oil well was drilled near Barranquilla in 1883. It was called Tubará by the two lead explorers Manuel María Palacio and Diego López, advised by Luis Stiffler, a recognized geologist. That well produced up to fifty barrels per day of valuable liquid. The first refinery Cartagena Oil Refining Co. was built and began to operate in 1909. It imported oil at a capacity of four hundred barrels per day (Villegas, 1982).
1.2. Contract Models
Contrary to the United States, all mining resources on the ground surface and in the subsurface belong to the nation, and not the landowner. However, there were specific cases that by Royal Decree of the Spanish Crown were the exception to the rule. Consequently, just the State could authorize mining resources contracts for exploration and exploitation. The first of those contracts was called a Concession. The first one was granted at the end of XIX century, to Jorge Isaacs (Villegas, 1982), a renowned writer who discovered oil while looking for coal. However, in 1905, the first contract for exploitation was signed with De Mares Concession, awarded to Mr. Roberto de Mares who represented a branch of the Standard Oil Company, in the middle of the Magdalena River valley known today as Barrancabermeja City. In 1924, seventeen producing wells were drilled in the Infantas oil field, and at the same time the geological structure called La Cira was discovered, in which the first well was drilled in 1926.
The first model of an official contract was the Concession Contract, and the main characteristic of this type of contract was its duration of fifty years, at the end of which all assets and facilities would be returned by the concessionaire to the State. All expenses were covered and investments were made at the concessionaire’s own risk, and the country received a royalty of 11% of the total oil production. As a consequence of this asset return, the Government established in 1951 the Colombian Petroleum Company, in order to operate those oilfields (ECOPETROL, 2015).
A new agreement model called the Association Contract was introduced in September, 1969. The Colombian Government issued the Law 20 of 1969, which replaced the Concessions Contracts with Association Contracts. In 1955, ECOPETROL granted Cities Service Petroleum Corp. a contract as an operator in the form of Joint Venture Contract with De Mares Concession, with a production distribution of 50-50% after royalties. ECOPETROL would participate in the operation after the oilfield was declared commercial, and would contribute 50% of the investment for oilfield development (Echeverry, Navas, Navas and Gomez, 2008).
Since 1970, all contracts signed by ECOPETROL in the areas assigned by the Ministry of Mines and Petroleum, were Association Contracts, and covered by the Law 20 of 1969. The terms of this contract were: duration of 27 years with an option to extend five years more in the exploration phase, and 22 years in the production stage. The royalties increased from 11.5% to 20%, the production distribution (20% in royalties, 40% to the partner, and 40% to ECOPETROL), and the contract was managed between parties, the partner and ECOPETROL (ECOPETROL, 2011).
Those conditions generated positive results such as a high level of exploratory activity and the discovery of giant oil fields such as Caño Limón in 1983, Cusiana-Cupiagua in 1990, and the Chuchupa-Ballena gas and oil fields in the Caribbean
Sea. However, some later modifications such as escalated royalties according to production levels and the “R” factor, the steep natural decline in production of those reservoirs, and the absence of discoveries of new oil fields discouraged investments and took exploration to the lowest levels in 1993, which shortly after brought about the end of the country´s self-sufficiency.
R factor was introduced as a way to generate a fairer distribution of the profits between ECOPETROL and the foreign company. Therefore, once again, the participation rate increased when the production surpassed 60 million barrels; however, the rate depended on the company’s revenues and costs, according to the R factor. The R factor was defined as follows:
𝑅 = 𝐴𝑅
𝐼𝐷 + 𝐺𝑂 + 𝐴 − 𝐵
Were:
AR: Associate’s accumulated revenues (volume x price) ID: Accumulated investment
GO: Accumulated operational costs
A: Direct exploration costs financed entirely by the associate B: Accumulated costs’ refund
R Factor Ecopetrol Participation Associate’s Participation < 1.0 50 50 1.0-2.0 100-50/R 50/R > 2.0 75 25
Table 1. Production distribution rate according to the R factor (%) Source: Barrios A. E. (2003)
As a consequence of the aforementioned circumstances, in 2003 the Colombian oil and gas industry changed dramatically with the establishment of the National Hydrocarbons Agency (ANH) under Decree 1760 of 2003. With the issuance of this law, ECOPETROL became a commercial State-owned company exclusively dedicated to operation activities related to the oil and gas industry (exploration, drilling, production, transport, refining and commercialization), which allowed it to compete under the same conditions as that of other local and foreign companies (Echeverry, et al., 2008). This decision made it more competitive by separating the role of a regulatory entity from that of an operator company; thereby leaving to the new government agency the management and regulation of the nation’s hydrocarbons. It was a new beginning for the oil and gas industry in Colombia, which became again an attractive prospect to foreign and local investors. Another important change was the modification of the Association Contract that offered more flexible conditions, allowing different proponents to participate in open rounds such as big players bidding against medium and small companies, and with royalties, taxes and rights that replaced those included in the Association Contact. The new financial conditions of those contracts allowed Colombia to reposition itself in the world market as one of the most attractive countries for investments in the oil and gas sector.
The results were immediate. The number of contracts signed increased significantly, and seismic, exploratory and drilling activity surpassed expectations through 2013. However, the current situation is different as many other countries opened their doors with similar contract models with better tax benefits for Foreign Direct Investment (FDI), better infrastructure conditions, a more educated population that is more capable, and fewer or no security risks. Furthermore, the recent reduction in international oil prices as of October 2014 and its apparent instability has made it more difficult to retain FDI in Colombia (see Figure 1), particularly in Oil and Gas industry, instead the government efforts in other industrial sectors such as agriculture and infrastructure has been helping the country to close the gap leaved by Oil and Gas industry in terms of FDI.
Anyway oil self-sufficiency continues being a concern. The government needs to make efforts to recover interest in the country’s oil and gas industry and come up with new strategies, such as a free open market to international operators and service companies, thereby promoting competition, cost reduction, the diversification of oil production resources including unconventional resources.
Figure 1. Foreign Direct Investment in Colombia. Source: ACP, IEP May 2015.
1.4. Thesis Justification & Objectives
Considering that the proven oil reserves have steadily increased worldwide, thanks to the discovery of new extraction technologies, particularly in shale, thigh sands and coal bed methane deposits (unconventional reservoirs), that several countries around the world are in the process of developing environmental and legal regulations to exploit those resources, and taking into account that one of the strategies of Colombia´s government to reduce the risk of importing oil derivatives in the short term due to the reduction of oil and gas reserves is to promote the
30.4 25.9 26.2 31.1 41.5 56.6 66.0 72.2 100.1 61.9 79.5 95.0 94.1 98.0 93.3 -2,000 -2,000 4,000 6,000 8,000 10,000 12,000 14,000 16,000 18,000 -20.0 40.0 60.0 80.0 100.0 120.0 2000 2001 2002 2003 2004 2005 2006 2007 2008 2009 2010 2011 2012 2013 2014 M ill io n U S D o lla rs U S D o lla rs p e r B ar re l Colombia FDI
unconventional oil and gas exploration and exploitation, market for companies that provides services in unconventional reservoirs that are now relevant.
Main objective:
To determine the feasibility of introducing the hydraulic fracturing business in Colombia from a Chinese provider, through the development of a business plan and the evaluation of the project using IRR and NPV methodologies for the following three years’ cash flow.
Secondary Objectives:
To review Colombia´s current oil market´s situation by collecting all statistical data related to the oil industry and to show how this industrial sector has developed in at least the last five years.
To identify how the current situation, international oil prices behavior, positively or negatively impact the Colombian government’s intentions to diversify oil and gas resources and explore and exploit unconventional reservoirs.
1.5 Theoretical Framework
1.5.1 What is a Business Plan?
A business plan is basically a well-organized and detailed document, or roadmap, in which the operational and finance trajectory of a company or a business is described based on three elements: the past as an introduction, the present as the context and current structure or business situation, and finally, the future outlook in terms of objectives and goals.
“Investors and managers use business plans to better understand a certain business, the product or service that is offered, the nature of the market as well the entrepreneur or managing team´s characteristics.” (Longenecker J. et al., 2000)
The objective of a business plan is to facilitate and try to make the achievement of objectives viable, particularly those that are more important for an organization or a business. For this very reason, it is necessary to maintain a structure that will allow one to organize information and facilitate its analysis so that the specified objectives can be reached.
A business plan is not only important for entrepreneurs, it is equally relevant to existing businesses that want to grow or expand. Sahlman W. (1997) states, “A business plan should be simple, clear, concrete and informative, and should include risk identification to perform it successfully, specifying variables which could significantly impact the expected results.”
A well developed and presented business plan is an excellent informative resource to find support and to motivate the team to achieve its goals, and it conveys enthusiasm and optimism even to those involved in funding it internally or externally.
The plans must consider all necessary actions to reach the expected results, and those will be only reached if trust is generated in order to incentivize investment. It is possible to say that the most important product of the planning process is not the plan per se, but the clear vision of the planning and execution teams when questions arise and answers for those questions are the result of agreements which everyone is convinced of. The next bullet points show some things to take into consideration in a business plan according to Sahlman W. (1997):
Who are the customers?
What does it cost in resources and time to have a client?
How does the customer decide to buy the product or service?
When must the customer pay the business?
How do you put a price on the product or service?
What does it cost to produce and deliver the product or service?
What aids customer retention?
How easy or difficult is it to retain a customer?
How short is the life cycle of the product or service?
Is there enough competition?
Who are the competitors and which resources do they control?
What are your strengths and weaknesses?
Who else can see and exploit the same opportunity?
How can investors eventually make money?
Is there a possibility that the company will become public and how beneficial would it be?
How does the strategy reach identified market segments?
How does the strategy work to stay ahead of the competition? Is there a way to collaborate with competitors through an alliance?
What are your strengths and weaknesses?
These questions help one understand the elements that comprise a business plan and to gain a perspective that will allow the development of the necessary steps for the development of a business plan.
1.5.2 Strategic Planning
Strategic planning provides the direction that guides a business’s mission, objectives and organization or provides business strategies that enable the development of plans for its functional areas. Strategy according to Ghemwat P. and Rivkin J. (1999) could be defined as follows:
“Is the establishment of basic mid- and long-term goals as well the company objectives, the adoption of courses of action and the allocation of necessary resources to attain with the objectives?”
However, in this particular case a strategic plan will be related to the main and secondary goals that have been set and how they must be achieved, which could be considered as the strategies to follow in order to reach the targets.
1.5.3 Situational Analysis – SWOT
SWOT, which stands for strengths, weaknesses, opportunities and threats, is an analytical framework that can help a company face its greatest challenges and find its most promising new markets. The method was created in the 1960s by business gurus Edmund P. Learned, C. Roland Christensen, Kenneth Andrews and William D. Book in their book "Business Policy, Text and Cases" (R.D. Irwin, 1969). In the early 70s this model gained high acceptance due to the benefits in planning and setting guidelines for the use of resources. In the mid-90s, the model was restructured to tie resources to a sustainable competitive advantage. The model is still valid today and is recommended to perform strategic, administrative and marketing analysis. A recent modification done by Miloard M. et al. (2004) states:
“Successful strategies come from a systemic internal and external evaluation, which includes auditing the day-to-day operations as well as planning factors, with the objective of implementing adjustments that will maximize capabilities and future opportunities.”
In a business context, the SWOT analysis enables organizations to identify both internal and external influences. SWOT's primary objective is to help organizations develop a full awareness of all the factors involved in a decision, also the SWOT model helps to tie the strategy selection process and joint research to their implementation. It is a tool that helps to maintain a realistic perspective of the current corporate situation and works as a foundation for a precise diagnostic, which allows organizations and managers to make decisions according to set objectives.
Of these four variables, strengths and weaknesses are internal to the organization, so it is possible to act directly on them. On the other hand, opportunities and threats are external, so it is generally difficult to modify. Each component is defined below:
Strengths: are the special capabilities that the company has, which give a business an advantage over the competition. Examples include resources control, skills and abilities, activities that are adequately carried out, etc. Weaknesses: are those factors that put an organization in an unfavorable
position with respect to the competition, for example, lack of resources, lack of skills, activities which are not carried out, etc.
Opportunities: are those factors that are positive, favorable, exploitable, and to be discovered in the environment in which the company operates and that provide competitive advantages.
Threats: are those situations that come from the economic, competitive, natural and social environment that can affect the organization.
Each of these components can be analyzed in evaluative or descriptive terms, which means that they can be described objectively or evaluated subjectively. The logical sequence must be selected to link the SWOT model dimensions in order to support a logical perspective of the company in the market.
From an analytical perspective, the key SWOT characteristics distinguish between controllable and uncontrollable factors.
"For companies focused on the market, the evaluation process is guided considerations of market intelligence, i.e. information about customers and competitors" (Jaworski and Kohli, 1993).
According to Carves D. et al. (1997), a key factor to considering firms with market orientation is a culture that gives value based on intelligence about the learning environment, the planning process to develop value propositions that can achieve
the requirements by the customer and differentiating the company from its competitors.
When there is a customer focus, strategies are more stable, and managers can pay more attention to emerging customer needs that allow the identification of opportunities that can be exploited.
According to M. Porter (1980), the SWOT model helps create questions about the competitive position of the company, but does not answer some of them, and that’s why he proposes his five forces model.
1.5.4 Model of Michael Porter's 5 Forces
This is the most commonly applied strategy model since the 80's. The model depends on the competitive position of the company and not only the price or quantity of production, but rather the five forces that determine their long-term profitability.
1.5.4.1 The Degree of Rivalry
The degree of competition in a particular sector of an industry occurs because one or more of the competitors feel pressured or see the opportunity to improve their position. In most sectors, the competitive moves of a company have observable effects on its competitors, so it is possible to make efforts to counteract them. That is, companies are mutually dependent and this gives rise to manipulating their position by using tactics like price competition, advertising battles, the introduction of new products, increases in customer service or increases in the guarantees of products and services. The more concentrated the industry, the more likely that its competitor will recognize their mutual interdependence and thus restrict their rivalry. Ghemwat Rivkin and J. P. (1999) argue that the degree of rivalry defines determinant behaviors.
"If competitors are diverse, and if add a high strategic value to their positions in an industry, or face high exit barriers, they are more likely to compete more aggressively."
Some factors that increase the degree of rivalry are the high fixed costs, excess of capacity or lack of its use, slow growth, various competitors and lack of product differentiation. In other words, when there is high competition, companies used to its maximum capacity, obtain lower costs, increase liquidity, generate growth and there is a high differentiation among competitors.
1.5.4.2 Threat of New Entries
The creation of new companies generates the desire to obtain a market share and profits. This can force businesses to lower their prices or inflate costs of existing products, thereby reducing profitability. The key concepts to analyze in this point are the constraints and entry barriers that restrict the income flow from some companies to others. According to M. Porter (1980), entry barriers exist when it is not possible to replicate or it is not economically feasible to reach a certain position. Here are some of them:
Economy of Scale: is to increase the production volume and the use of resources to reduce costs.
Product Differentiation: is to improve, change or adapt the product or service to generate more value for the customer and the company, making brand identification and loyalty, derived from past advertising, customer service, product differences or is created simply by being the first in the sector.
Capital Investment: is the concentration, accumulation of financing of economic resources to improve, optimize and expand the operation to get more profits.
Access to Distribution Channels: is to improve the relationship with distributors and promoters offering lower prices without sacrificing much profit to introduce or sell the product or service.
Government Policies: are government rules and regulations that restrict or regulate the marketing, production and execution of services and products.
Some other common barriers are: copyright, patent protection, the development of a new product, service or process, brand identity and sales force among others.
1.5.4.3 Threat of Substitutes
The threat of substitutes is given in relation to the performance and price range of different types of products or services that customers can access to meet the same need. The graph shape that represents a threat is in the form of an S, as it begins slowly and at a low cost, then gains strength through acceptance and finally levels when almost all economic substitution possibilities have been exhausted.
"The substitutability from the supply-side influences the willingness of suppliers to provide the required supplies and from demand side influences the willingness of buyers to pay for the products." Buendia F. (2004).
The main contribution of this force is that it gives an overview of the organization and the resources they use to impose their conditions of price and size of the request.
1.5.4.4 Buyer Power
Buyer power describes the organization of clients and issues concerning the product and the amount of substitutes, differentiation and cost for the customer. It allows consumers to squeeze industry margins by forcing competitors to reduce prices or to increase the level of service offered, without a reward in return. Probably the most important determinant variables of buyer power are the number and concentration of customers; therefore, if there are few buyers, bargaining power is high and vice
versa. This is one of the two vertical forces that influence the value creation of an industry and predicts the price sensitivity of consumers. It also details the relationship between demand, lower prices and profitability.
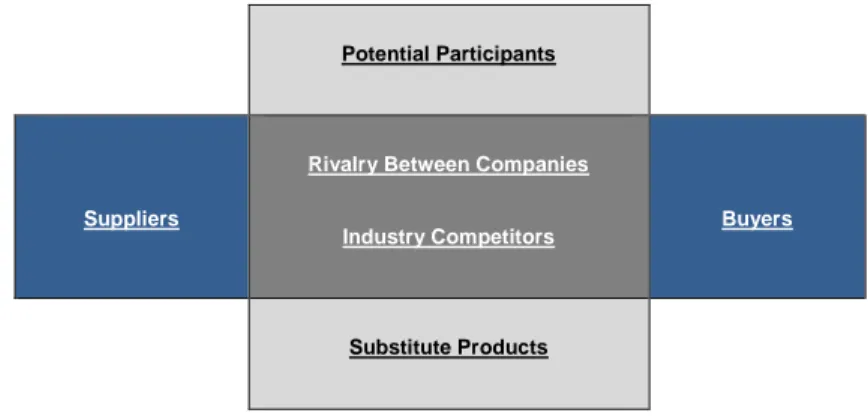
1.5.4.5 Supplier Power
This analysis focuses on the size and concentration of suppliers relative to industry participants, as well as the degree of differentiation between the supplies provided.
According to Ghemwat Rivkin and J. P. (1999), the power of the provider determines the technological level, determines the existence of potential or real substitute products and compares prices on profit margins. The relationships between buyers and suppliers have important cooperative as well as competitive elements. The ability to charge consumers different prices in relation to the value created usually indicates that the market is characterized by high supplier power and low buyer power. The supplier power is reflected in buyer power. Below is a diagram that displays the five forces that determine the position of the company in a given market.
Potential Participants
Suppliers
Rivalry Between Companies
Industry Competitors Buyers
Substitute Products
Figure 2. Porter’s Five Forces Interaction. Source: The Author.
1.5.5 Generic Strategies
Generic strategies are tactics to outperform competitors in a sector. Ghemwat Rivkin and J. P. (1999), state that competitors within an industry can be grouped in terms of generic strategies, so that they help to explain their interaction and profitability.
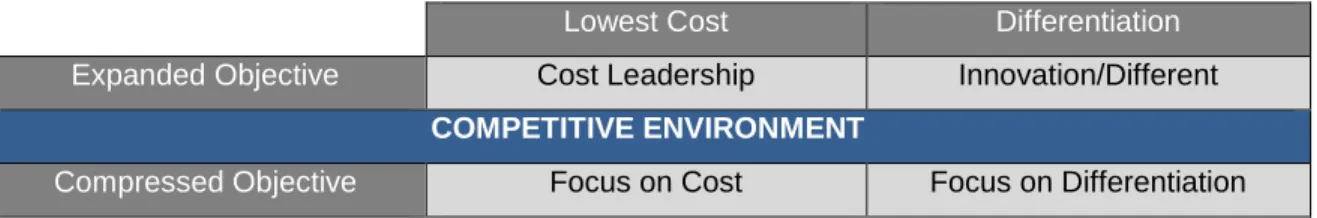
Porter M. (1980) proposes three generic strategies to create long-term defenses and to have an advantage over competitors and reduce the competitive forces that impact the company.
1. Cost leadership requires facilities capable of producing large volumes efficiently to the degree of reaching economies of scale as well as cost reduction based on experience, rigid cost and expense controls, and the minimization of costs such as research and development, service, sales force, advertising, etc. A company that has a low cost position will logically obtain higher yields than the average in its industry, but they still have to face intense competition.
2. Differentiation is to create something that is perceived as unique. This strategy builds loyalty with customers, increases profits and produces less price sensitivity, because the buyers’ lack of comparable alternatives. Differentiation can take many forms including design, branding, technology, customer service, distribution network, etc.
3. Focus concentrates on serving a particular target or group
of buyers, product line segment or geographic market well. As a result, diversification is reached to better fulfill the target needs of a market or lower costs.
These generic strategies are attractive to the organizational structure, reward system, corporate culture and leadership style needed to make a low cost or differentiation strategy successful.
"Porter´s generic strategies have been considered as the most common actions that the company can implement to meet the five competitive forces and create a defensible strategic position." Buendia F. (2004).
It can be said that the three generic strategies include somehow all the alternatives that the company can apply to different business situations.
Lowest Cost Differentiation
Expanded Objective Cost Leadership Innovation/Different
COMPETITIVE ENVIRONMENT
Compressed Objective Focus on Cost Focus on Differentiation
Figure 3. Porter’s Generic Strategies. Source: The Author.
1.5.5.1 General Strategies to Reach Competitive Advantage
"The competitive advantage is when a company offers a product or service that customers perceive as superior to competitors." Sodhi S. (2003).
In order to create a competitive advantage, companies must respect the steps to establishing a strategic platform as well as understand the basics of formulating it. Specifically, the key points are the environment in which the company operates, the study of general trends, the dynamics of competition, the external analysis that determines the competition and the internal analysis that reveals what the company can do.
"The competitive advantage should be formulated taking into account the entire company, i.e. the design, production, marketing, distribution, and product support" (Porter, M. 1990).
Each of these activities can contribute to the cost position that a company has, so it can create a basis for differentiation.
Successful companies often have to compete based on low costs, focus or differentiation of their products through their quality or performance characteristics. A competitive position should consider both the relative costs and differentiation, and it must recognize the relationship between both parts. The optimum position is represented by a combined strategy.
In this way, one can understand why a company has added value to the product or service. One can identify opportunities to improve the added value and predict future changes in it. One of the ways in which a company can modify the value added is by adjusting the focus and scope of its operations, looking for the cheapest way to generate a greater availability of payment, at least in one of its customer segments.
1.5.5.2 Competitive Advantage Strategy Using Cost System ABC
The companies that are looking to create and maintain a cost leadership strategy should analyze their internal processes as well as increase the value-adding activities.
There are several methods to determine the value creation; one of them is Activity Based Costing (ABC). This method can identify waste and inefficiencies in managing the costs of a product, process or administrative practices, so according to Hooshang M. (2004) it is convenient to incorporate it into the strategy and organizational culture.
The ABC should be used as part of the total quality management that operates under the premise of constant search for opportunities to eliminate waste and improve quality, contributing to the continuous improvement process to distinguish the key activities and optimal operation methods. This cost system is used to make decisions, to purchase goods and supplies, and to hire or consult externally for the competitive market research and for the company’s vertical integration.
Once the company can identify its position in the industry, it can determine its competitive advantage and method to generate profits. In evaluating methods of cost management, it helps to highlight the core competencies, strengths and weaknesses of the business.
1.5.6 Business System
The business system is the activities and resources necessary to produce and commercialize the product or service. These activities can be grouped into the following five subsystems:
1.5.6.1 Purchasing and Supply:
As its name suggests, it is the procurement and supply of materials and services for the production and proper operation of the company. This feature helps identify products and services that can be obtained externally. It also develops, evaluates and determines the best supplier, price and delivery of those products and services. It involves contacting and contracting suppliers of goods or services, tracking purchases, registration and management of supplies or services required the selection of adequate sources of supply and the development of business relationships with suppliers.
The purchasing function often spends more money than any other company function, so this area provides a good opportunity to reduce costs and increase profit margins.
1.5.6.2 Production and Maintenance:
The production function is also known as the operational function and focuses on the use of machines, facilities, sites or resources by employees or workers in order to transform materials for the preparation or implementation of products or services. The work in this area consists of the preparation of work, task scheduling, production and control in advance of scheduled activities, among others.
However, the preventive function focuses on ensuring the effectiveness and efficiency of the material, equipment and facilities necessary for production.
1.5.6.3 Organization and Management:
Organization and management consists of planning, organizing, directing and controlling the activities carried out in a company. In other words, it consistently and constantly gives shape to organizations. Management functions and organization are responsible for making resources productive, seeking the achievement of objectives through people, through techniques within an organization, this function is vital as it connects all other subsystems. This area is responsible for the coordination of human, material and financial resources for the effective and efficient achievement of organizational objectives. In the same way it handles the relationship of the organization with its external environment and responses to the needs of society. It plays informative and critical roles such as setting objectives, planning, allocation and distribution of human and material resources.
1.5.6.4 Marketing and Sales:
The intention of marketing is to get the customer to buy or need a product or service offered. A marketing strategy in a business plan starts by defining a market niche and analyzing it. It also involves the study of the product, sales, prices and profit margins. Additionally, it includes competitive analysis, identifying main competitors and their strategies in regard to product quality, pricing, distribution, promotion and advertising. Another element that is important to consider at this point is the planning of internal marketing that aims to develop preventive methods and raise awareness of internal and external factors that create customers and, therefore, profits; thereby eliminating functional barriers for people who avoid efficiency and effectiveness.
1.5.6.5 Finances
Once the plans and strategies are established, specific action programs are created: operating budgets, investment and financing, in accordance to the operational or functional conditions in different areas of the company.
General strategies mean detailing the decisions and identifying the necessary resources for an investment project to be implemented. The purpose of these projects is to improve or expand the operational infrastructure to increase occupancy and volume of operations.
For a good idea to translate into an investment opportunity, the level of profitability that can be achieved and the size of investment required must be stated. It is essential to have a project’s projections of earnings and its financial requirements and assets to see if the investment is feasible from a financial point of view.
The financial statements provide important information on the performance and financial resources of a company. The key financial statements are the balance sheet and cash flow statement. According to Longenecker J. et al. (2000), there are five indicators to determine the profitability of a business:
Revenue from the sale of products or services, Cost of the acquisition of goods or services for sale,
Operating costs, related to both the sale or distribution of the product or service to customers, as well as business administration,
The business’s financial costs, particularly the interest paid to company creditors,
Tax payments
A balance sheet provides a snapshot of the financial position of a business at a specific point in time, shows assets that a company has, liabilities or outstanding debt, and the amount that the owners have invested in the business, or capital.
Both the balance sheet and the accounting and financial statements are management tools from the vision and mission that operationalize strategy and demand objective-by-objective, be they financial, commercial, operational or human. They are the foundation for developing strategic initiatives. The other key financial statement related to business is the cash flow statement, because sometimes the income statements do not provide the same information, as it is calculated on an
accrual rather than a cash basis.
In accrual accounting, revenue is recorded when it is earned, regardless of whether the income is received in cash or not, and costs are recorded when incurred, even if the money still does not leave the company.
"An analysis of capital requirements should consider how to finance the necessary investments and costs to start up a company project that will allow it to grow and not require the personal expenses of shareholders, especially if no other revenue is available for their support.” Longenecker J. et al. (2000).
During the initial period of the company, these expenses are part of the capitalization of the business, and should be taken into account in the financial plan. The key to effective screening asset requirements is the knowledge of the relationships between the projected sales and the necessary assets. Because the asset needs tend to increase with the increase in sales, it is common to calculate requirements as a percentage of sales.
"If future sales have been projected, it is possible to use the assets to sales ratio to calculate the asset requirements." Longenecker J. et al. (2000).
A company must finance its growth so that it can maintain a proper level of liquidity. Liquidity measures the degree to which a company has sufficient working capital to satisfy its debt obligations when they are due. The following are some practical suggestions to formulate financial projections:
Sales projections should be conservative and realistic.
Make projections taking into account the actual sales figures without being too optimistic.
Develop projections quantitatively, from clear hypotheses and writing marketing plans and prices.
It is favorable to calculate the number of clients the business is expected to have and to calculate the projection of an average sale per customer.
In the projection of sales and expenses specific industry comparative data can be used to guide the calculations.
It is advisable to compare the pro-forma financial results with actual and projected change, as needed.
It is better not to receive funding than take the money and then fail to pay it back as is required.
This framework entails a basic analytic complexity which is essential, given the specific properties of a globally strategic resource like oil and gas. First of all, oil and gas are simultaneously a local, regional, national, and global resource, but its analysis typically is characterized as fixed on a particular scale. Therefore, extraction must occur at the specific focal point of its location. This means that the exploitation of oil and gas has particular consequences for the communities and territories in which it is embedded. Oil and gas control, however, requires the infrastructure, security and technology to convert it into an asset that can be transported over and through broad and complex regional, national, and transnational-national geographic spaces, usually across national borders. Having said this, there are several barriers for new players in the oil and gas service market, external variables that negatively affect the option to introduce themselves, lack of local infrastructure, cultural and environmental knowledge, among others, that reduce the probability of success. Besides, when considering a Chinese company, the “stigma” related to quality and safety issues that those companies heavily carry on their shoulders, particularly in the Latin-American market, should be added.
II. THE CURRENT OIL MARKET SITUATION
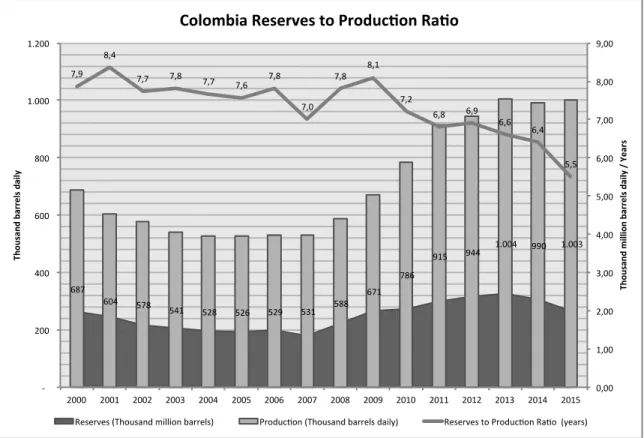
In terms of equivalent oil reserves, Colombia reported 2,344 millions of barrels of oil in December 2015 (BP Statistical Review of World Energy, 2016), however, official data from the National Agency of Hydrocarbons (ANH in Spanish) shows only 2,003 million for the same dates, which will support the country’s self-sufficiency in oil consumption for the next five and a half years (see Figure 2.). Therefore, the country
needs to focus on increasing its proven oil reserves by at least 30% to support Colombia’s accelerated Gross Domestic Product (GDP) growth of more than 4.6% average per year from the last five years, which according to the National Administrative Department of Statistics (DANE in Spanish) has maintained a strong economic performance for almost a decade.
Figure 4. Oil Reserves to Production Ratio Source: ACP, IEP May 2015.
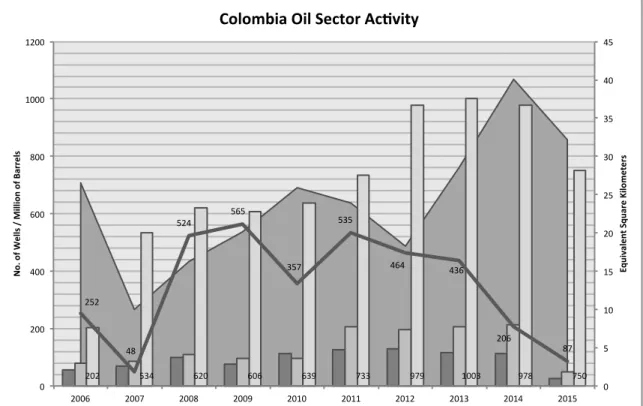
The economic performance and worldwide oil market situation, particularly the oil price behavior and other variables, show an opportunity to be capitalized in Colombia. All indicators related to the oil industry in Colombia have decreased since 2011 in terms of seismic acquisition; exploratory wells and development wells drilled, as shown in Figure 3, and plummeted as a consequence of the fall of international oil prices. In order to maintain self-sufficiency of the national oil market, the government must implement changes in oil exploration and production policies so
that it can increase or at least continue to maintain the Gross Domestic Product (GDP) growth trend. This would result beneficial to investors as well as would provide an opportunity for oil and gas service companies, as the government needs to attract investment in this sector, particularly foreign direct investment (FDI), which in the past 5 years has been at an average level of 33%.
Figure 5. Oil Sector Activity Source: ACP, IEP May 2015.
2.1. Oil Production
As easily accessible oil and gas reserves decrease, technological advances during the past few decades have improved access to complex oil and gas reservoirs. Technological developments in the completions (fracturing) of oil and gas wells have particularly been the main drivers that have enabled oil companies to explore and develop unconventional reservoirs successfully, thereby paving the road to increased access to new oil and gas reserves as well as substantial production
increases.
Therefore, the exploitation of non-conventional reservoirs presents a strategic opportunity for Colombia to improve its declining oil reserves and self-sufficiency. ECOPETROL has a steady daily production goal of 1 million barrels of oil per day to be achieved by the end of 2015 (see Figure 4), and expects to maintain those production levels for the next three years. By 2020, the National Oil Company (NOC) expects to be producing 1.3 million of barrels of oil per day (MBOPD), thus increasing the country ́s daily production by 30%, of which 50,000 barrels of oil per day (BOPD) will come from unconventional reservoirs, a 66% production increase from those plays compared to 2015, 30,000 BOPD expected (ECOPETROL, 2015). This level of production, especially from unconventional reservoirs, presents a major challenge for fracturing services that will play a key operational role in the following years. With no new important oil field discoveries and dramatically declining reserves, conventional oil exploration is not, in the short term, a solution. Furthermore, conventional oil exploration investments require substantial capital and the chance of success is low. Those strategies are focused on Enhanced Oil Recovery (EOR) and Improved Oil Recovery (IOR), such as in fill wells in developed and mature fields, secondary oil recovery methods such as water, steam or polymer injection, and In Situ combustion in those specific reservoirs. An option included in IOR also contemplated by so many companies in Colombia is conventional fracturing jobs, which seek to obtain greater flow area for the oil to flow from the reservoir. Another strategy adopted by the government is to encourage the exploration and exploitation of unconventional reservoirs, reservoirs previously identified as far as 40 years ago but never were exploited due to the lack of technology. Now that it is available, there is an opportunity for the government and investors to reduce capital investment risk and to meet the production sustainability in the upcoming years.
Figure 6. Colombia’s Oil Production Source: ACP, IEP May 2015.
2.2. Unconventional Resources in Colombia
Among the efforts developed by countries to support the growing demand for energy, without any clear definition to date, the exploitation of resources does not meet the requirements which have been characterized by conventional hydrocarbons. This means that there are resources accumulated in a nonporous or impermeable rock, a rock that obstructs an easy flow of hydrocarbons from the rock to the oil well or to the surface.
These accumulations can be oil or gas, and they are generally more abundant than conventional resources. Experts state that they normally require high investments and the application of the latest technology available for extraction. They use more water than conventional resources to produce, seem less profitable than conventional resources and may constitute exploitable reserves to the extent that
39
Coal Bed Methane CBM
Gas & Oil Shale Gas Hydrate
costs go down and prices rise. Unconventional resources include gas hydrates, oil sands (tar sand), coal bed methane (CMB) and, to a lesser extent, shale oil, shale gas, and tight gas.
The Energy Information Administration of the United States (EIA) has identified Colombia as one of the countries benefiting from the presence of unconventional hydrocarbon deposits, for which the national government through its various entities is working hard to establish appropriate regulation that allow the development of such resources. This potential mainly located in the structures of the Llanos Orientales basin and within it, mainly in the foothills, are significant but limited prospects for oil sand deposits (tar sands). There are potential shale oil and shale gas reserves within the Magdalena and Catatumbo basins, as well as in the Caguan and Putumayo basins, as shown in Figure 7. Colombia is the world’s second largest open coalmine producer, and those mines are located in the northwestern region of the country. This resource is always tied to gas layers called coal bed methane (CBM, which are other unconventional resources considered for future developments (Advances Resources International Inc., 2013).
According to studies and their respective updates conducted in 2012 and the following years by Rodolfo Guzman, Director of Arthur D. Little in Houston, Colombia has been identified as an important player for unconventional resources in Latin America, thanks to its potential reserves located in different basins within the country. It is in fourth place after Argentina, Brazil and Mexico. Growing demand implies that the country should be prepared to increase the exploitation of these resources, which means increased opportunities for the introduction of specialized equipment.
Figure 7. Unconventional Oil & Gas Resources Locations
Source: ANH, Unconventional Hydrocarbons Workshop, June 2014.
2.3. Literature and Study Review
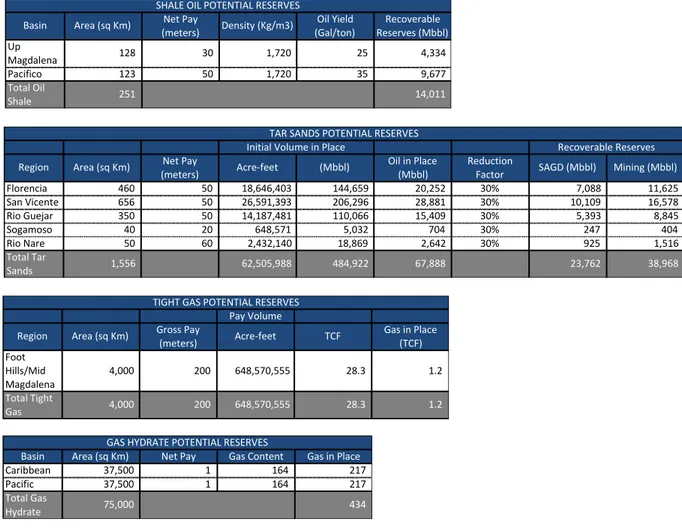
A couple of key previous studies, some Conference and Exhibition Congresses and some private companies’ studies conducted years ago were consulted in order to provide an estimated potential of unconventional reservoirs in Colombia.
The Energy Information Administration of the United States (EIA) requested in 2013 that Advanced Resources International, Inc. conduct a study called World Shale Gas and Shale Oil Resource Assessment. Vello A. Kuuskraa, Scott H. Stevens, Keith D. Moodhe evaluated shale oil and shale gas resources in 26 regions and 41 countries, excluding the United States. This report first included new geological data collection and analysis, including only those countries and/or regions with high quality potential or prospective areas. Secondly, they evaluated those prospects, classifying those that from a technical perspective are recoverable and have an interesting flow rate on the top. They considered the possibility of developing those potential prospects, taking into account different success factor scenarios.
Arthur D. Little is a top management-consulting firm with a specialized area focused on the energy and utilities sector. In 2011, the ANH requested a study called Potential Resources of Unconventional Hydrocarbons in Colombia from this firm with a particular purpose in mind. The ANH, as mentioned before, is the regulatory institution in charge of promoting worldwide those blocks or areas in which the country expects to receive investments in exploration, based on technical studies provided by third parties who state that there is a high probability of finding hydrocarbon resources in those places.
After receiving, analyzing and approving this study led by Rodolfo Guzman, a partner at Arthur D. Little, the ANH conducted local studies that involved drilling stratigraphic wells to acquire detailed geological information and complemented the theoretical study. With the collection and compilation of all of this available information, the ANH launched in 2014 the Colombia Bidding Round, which offered 77 conventional prospective and 18 unconventional prospective blocks to companies like Shell, Exxon-Mobil, Conoco-Philips and Nexen, among others who came back to to Colombia, which shown a growing interest in unconventional resources. Those studies, Arthur D. Little, ANH and the unconventional blocks technical specifications were basic data to build the business case.
Basin Area (sq Km) Net Pay (meters) Gas in Place (TCF) Recoverable Reserves (TCF) Mid Magdalena 7,500 100 289.5 29.0 Foot Hills 500 100 19.3 1.9
SHALE GAS POTENTIAL RESERVES Region Minieable Coal
in Place Potential Total Gas in Place (Gmt) (TCF) Cesar 6.6 2.3-6.3 Guajira 4.5 2.5-10 Boyaca 1.7 2.1-5 Cundinamarca 1.5 2-5 Valle del Cauca 0.2 0.1-6.2 Norte de
Santander 0.8 0.9-1.2
Cordoba 0.7 0.4-0.5
Antioquia 0.5 0.3-0.4 Santander 0.8 0.5-0.7 Total Coal Pot. 17.3 11.1-35.3
CBM - COAL BED METHANE POTENTIAL RESERVES
Lignite Low Volatile Bitum Medium Volatile Bitum High Volatile A Bitum High Volatile B Bitum High Volatile C Bitum Antracite
Table 2-7. Unconventional Oil & Gas Potential Reserves
Source: ANH, Unconventional Hydrocarbons Workshop, June 2014.
In order to obtain statistical and other relevant data, the ANH, ECOPETROL, the Mining and Energy Planning Unit (UPME in Spanish) and some special associations such as the Colombian Chamber of Oil Services (CAMPETROL in Spanish) and the Colombian Oil Association (ACP in Spanish) were consulted. An interesting amount of published information was available to the public on each organization’s web page.
Finally, in order to get technical data, different sources of information have been used: oil service companies’ web pages, specialized literature and different domestic and international technical publications, particularly from SPE and Oil & Gas Journal.
Basin Area (sq Km) Net Pay
(meters) Density (Kg/m3) Oil Yield (Gal/ton) Recoverable Reserves (Mbbl) Up Magdalena 128 30 1,720 25 4,334 Pacifico 123 50 1,720 35 9,677 Total Oil Shale 251 14,011
SHALE OIL POTENTIAL RESERVES
Pay Volume Region Area (sq Km) Gross Pay
(meters) Acre-feet TCF Gas in Place (TCF) Foot Hills/Mid Magdalena 4,000 200 648,570,555 28.3 1.2 Total Tight Gas 4,000 200 648,570,555 28.3 1.2
TIGHT GAS POTENTIAL RESERVES
Region Area (sq Km) Net Pay
(meters) Acre-feet (Mbbl)
Oil in Place (Mbbl)
Reduction
Factor SAGD (Mbbl) Mining (Mbbl)
Florencia 460 50 18,646,403 144,659 20,252 30% 7,088 11,625 San Vicente 656 50 26,591,393 206,296 28,881 30% 10,109 16,578 Rio Guejar 350 50 14,187,481 110,066 15,409 30% 5,393 8,845 Sogamoso 40 20 648,571 5,032 704 30% 247 404 Rio Nare 50 60 2,432,140 18,869 2,642 30% 925 1,516 Total Tar Sands 1,556 62,505,988 484,922 67,888 23,762 38,968
TAR SANDS POTENTIAL RESERVES
Initial Volume in Place Recoverable Reserves
Basin Area (sq Km) Net Pay Gas Content Gas in Place
Caribbean 37,500 1 164 217 Pacific 37,500 1 164 217
Total Gas
Hydrate 75,000 434
2.4. Unconventional Extractive Technology
Hydraulic fracturing is used after the drilled hole is completed. Simply put, hydraulic fracturing is the use of fluid and material to create or restore small fractures in a formation in order to stimulate production from new and existing oil and gas wells. This creates paths that increase the rate at which fluids can be produced from the reservoir formations, in some cases by many hundreds of percent.
The process includes steps to protect water supplies. To ensure that neither the fluid that will eventually be pumped through the well nor the oil or gas that will eventually be collected enter the water supply, steel surface or intermediate casings are inserted into the well to depths of between 1,000 and 4,000 feet. The space between these casing “strings” and the drilled hole (wellbore), or annulus, is filled with cement. Once the cement has set, the drilling continues from the bottom to the surface or intermediate cemented steel casing of the next depth. This process is repeated, using a smaller steel casing each time, until the oil and gas-bearing reservoir is reached, (Cabot Oil & Gas Corporation [COGC], 2015) which in Colombia can be found at between 5,500 to 12,000ft. More detail about hydraulic fracturing process could be found in Annex 1.
Hydraulic fracturing creates a horizontal well in an underground rock layer with multiple fracture stages. Water and sand make up 98 to 99.5 percent of the fluid used in hydraulic fracking. In addition, chemical additives are used. The exact formulation varies depending on the well, detailed information about resources required to perform hydraulic fracturing jobs could be found in Annex 2. Fracturing allows for extended production to take place in older oil and natural gas fields. It also allows for the recovery of oil and natural gas from formations that geologists once believed were impossible to produce. Hydraulic fracking is also used to extend the life of older wells in mature oil and gas fields. This is called a conventional fracturing job (COGC, 2015).
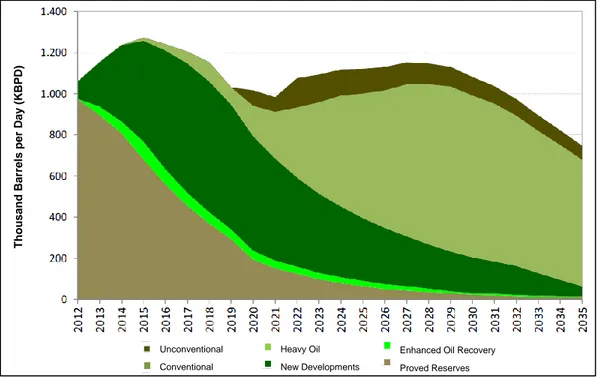
The oil and gas market in Colombia of the last twenty years shows a cyclical behavior framed by periods of prosperity and of crisis: The year 2014 and the two first quarters in 2015 were particularly marked by decreases in activity caused by different factors, being the most significant the fall of international oil prices. Right now, because of this crisis the activity is going down. This market behavior has motivated the oil service companies to relocate resources in other countries to optimize costs and reduce non-profitable equipment and machinery. In the past year, huge quantities of hydraulic fracturing units were mobilized away from Colombia. Considering the new challenges in production established by the national government for its National Oil Company (NOC) and the future development of unconventional resources, shown in Figure 8 and Figure 9, a gap to supply the local demand has been created today; however, even if the oil price is not good for some domestic operator companies, the development of unconventional resources must become a reality in the short term. Hydraulic fracturing is a specialized service that needs specialized equipment, and only a few companies, most of whom are currently at a high activity level developing projects particularly in the United States and Argentina, are capable of providing it. Based on the reserves incorporation hypothesis showed in Figure 7, and using the base case scenario, the production forecast showed in Figure 8 was built reflecting production results in the following years.
45
Figure 8. Reserves Incorporation Scenarios
Source: UPME, Cadena del Petroleo, December 2013.
Figure 9. Oil Production Forecast, Base Reserves Incorporation Case Source: UPME, Cadena del Petroleo, December 2013.
T housa nd B a rre ls per D a y ( K B P D ) Unconventional Conventional Heavy Oil New Developments Enhanced Oil Recovery Proved Reserves M il li o ns of Barre ls Unconventional Conventional Heavy Oil New Developments Enhanced Oil Recovery Proved Reserves M il li o ns of Barre ls Plenty Base Shortage Unconventional Conventional Heavy Oil New Developments Enhanced Oil Recovery Proved Reserves M il li o ns of Barre ls
III COLOMBIA’S FRACTURING MARKET
Reserves incorporation is the primary objective to attract investors and companies interested in provide services to develop unconventional resources, as we saw in the previous chapter using the base case scenario of reserves incorporation the forecast production from unconventional reservoirs in Colombia is small compared with other resources such as heavy oil, Enhanced Oil Recovery (EOR) and conventional resources, however this was calculated considering just proved reserves behind the casing in wells already drilled but in fact the potential could be significantly bigger.
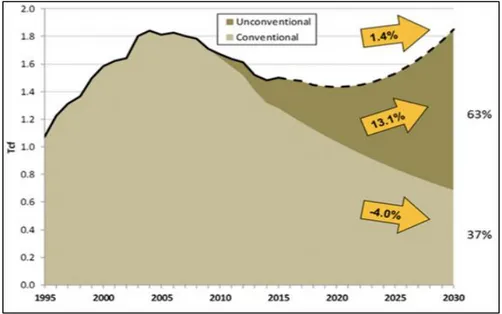
To show how dramatically these resources has been changing the energetic matrix in some countries is showed in Figure 10 the evolution of unconventional reservoirs in Argentina since 2009 producing proved reserves from unconventional resources up to 2015 and the forecast including probable reserves till 2030.
Figure 10. Oil Production Forecast, Argentina Source: EIA, Annual Energy Outlook, 2013.
Having said that there are several companies targeting the Colombian unconventional market. These E&P (Exploration and Production) operating companies include ECOPETROL, the National Oil Company, Exxon-Mobil, Nexen, Lewis Energy, Canacol Energy, Drummond, and Shell.
Figure 11 summarizes Colombia ́s unconventional resources potential according to the Arthur D. Little study’s subsequent updates, with the geographic location of the various operating companies present in Colombia:
Figure 11. Companies with Activity in Unconventional Plays Source: ANH, Unconventional Hydrocarbons Workshop, June 2014.
Table 8 summarizes the number of wells per company to be fractured per year in the next 3 years, according to information collected directly from planning departments and management teams in each operator company. Activity depends on different variables such as international oil price, security, the social situation and equipment availability:
Year Basin
Ecopetrol VMM 2 7 18
Exon Mobil VMM 3 3 1
Exon Mobil- Vetra-Canacol VMM 1 2 5
Nexen COR 2 2 2
Lewis Energy VMM 1 2 3
Canacol Energy VMM 0 1 2
Drummond CES- RAN 15 15 20
TOTAL 24 32 51
2019
Company 2017 2018
Table 8. Wells to Fracture Forecast Source: The author, Business Intelligence.
The average revenue for each stage in a fracturing job is USD$300,000. A stage corresponds to each layer of a geological formation in the hole (oil well) to be fractured. This cost includes all materials, equipment and personnel needed to perform the job, as shown in Annex 2. Average stages per well in unconventional potential reservoirs in Colombia are four; therefore, revenue for each well is estimated at USD$1,200,000. Considering the companies and quantity of wells to be drilled in the next three years, shown in Table 7, the total available market (TAM) for that period (from 2017 to 2019) for unconventional hydraulic fracturing jobs is estimated at USD$128,400,000.