Orientador: Professora Doutora Alexandra de Jesus Branco
Ribeiro, CENSE, DCEA, FCT-UNL
Co-orientador: Doutor Renato Nunes Rosa, investigador
CENSE, FCT-UNL
Júri:
Presidente: Prof.ª Doutora Maria Júlia Fonseca de Seixas Arguente: Prof. Doutor José Carlos Ribeiro Kullberg Vogais: Prof.ª Doutora Alexandra de Jesus Branco Ribeiro
Março 2016
Characterization of the shale gas production: A case study in a
sector of the Lusitanian Basin
Mariana Silva Dias Alvarez
Dissertação para obtenção do Grau de Mestre em Engenharia do Ambiente
Copyright © Mariana Silva Dias Alvarez, Faculdade de Ciências e Tecnologia, Universidade Nova de Lisboa.
iii
Acknowledgements
Firstly, I would like to thank you to Eletroactross project for the opportunity that provided me to go to University of Vermont. Also, I would like to express my gratitude to my supervisor Professor Alexandra Ribeiro for the useful comments and advices through the learning process of this master thesis. Thank you for the sincerity, availability, patience and persistence in the several steps of this thesis. Furthermore, I would like to thank my co-supervisor, Dr Renato Rosa, for all the understanding, tolerance, constructive criticism and valuable knowledges.
I would also thank to Professor José Carlos Kullberg, for all the teaching and inspiration with his high technical and scientifically knowledge, for the infinite patience with my questions and for the constant availability and happiness to share with me all his experience. To Eng. João Brisos for the assistance in developing the ArcGis image of my study area.
A special thank you to Professor Ehsan Ghazanfari who received me so well in his students group in University of Vermont, for helping me in so many doubts, and for the support to start this study. To Professor Julia, Jennifer, and Lauren for guidance in the laboratory and for dealing with my analysis so carefully.
A special thank you to my best friend Domingos, for teaching me so much and for always believing in me. My biggest supporter, looking always for the best part of me and by motivating me to be better. Thank you also for introduce me Francisco, which deserves an enormous thank you as well for all the availability to help me over my percussion in this work and for all the interest in this subject.
A special thank you goes to ENMC for receiving me and for its great accessibility to give me all the research tools to achieve my study. Thank you to Procesl for giving me the time to finish this work done and to all my colleagues for believing in my skills.
I would like to thank my family and to all of my friends, especially to my best friends Rita, Carlota, Joana, Mary, Cate and Ana for putting up with my bad mood. Thank you Rafa, Maria, Robert, Holly and Sharon for all your support and for welcoming me with a big smile during my stay in Vermont. Thank you Francisco for believing in me and for all the support you gave me.
Last but not the least, thank you Zé, for your constant support, bearing my bad mood and frustration during this work. Thank you for your continued interest, enthusiasm and pride in my thesis, it was what gave me strength when I needed most.
v
Sumário
Este estudo visa caracterizar a exploração de gás de xisto em Portugal através dos impactos gerados pela sua técnica de extração – fracturação hidráulica- a nível ambiental, social e económico. A extração do gás de xisto tem vindo a ser um assunto polémico essencialmente pela sua influência nos preços do petróleo e pelos impactes ambientais negativos que estão envolvidos no seu processo – em particular, associados à água contaminada que regressa à superfície após o processo de perfuração, a flowback water. Para suportar esta análise, foram elaborados três casos de estudo diferente: 1) análises químicas a um exemplar de flowback water proveniente da formação Marcellu, USs; 2) delimitação de uma área de estudo na Bacia Lusitaniana através das suas características geológicas; 3) análise de sensibilidade de investimento através da aplicação do método do valor atual líquido (VAL). Na primeira análise os valores de contaminação da flowback revelam que estes se encontram dentro dos parâmetros esperados, sendo confirmada a elevada toxicidade da mesma. De seguida, através da análise de sondagens efetuadas na Bacia Lusitaniana, delimitou-se a área de estudo localizada entre as sondagens Benfeito, Torres Vedras 4 e Sobral. Por fim, a análise de sensibilidade indica que a variação das despesas de capital representa o parâmetro com maior influência nas receitas e no período de retorno do investimento. Em conclusão, os resultados deste estudo indicam que a exploração do gás de xisto em Portugal conduziria a grandes benefícios para a economia nacional apesar do seu sistema de taxas para esta indústria não ser considerado adequado em comparação com os sistemas praticados em outros países e tendo em consideração as suas implicações a nível de impactes ambientais.
Palavras-chave:
vii
Abstract
This study aims to characterize the shale gas exploration in Portugal through the impacts generated by its extraction technique – the Hydraulic fracturing – on the environmental, social and economic sector. The extraction of shale gas has been a controversial issue mainly due to its influence on oil prices and the negative environmental impacts involved in the exploitation process – in particular, the contaminated water that returns to the surface after the drilling process, i.e. the flowback water. To support this analysis, it was performed three different analyses: 1) a chemical analysis of a flowback water sample from the Marcellus formation, US; 2) delimitation of the study area in Lusitanian Basin based on its geological characteristics; 3) an investment sensitivity analysis applying the method of net present value (NPV). The chemical analysis revealed flowback water values within the expected parameters, confirming its high toxicity. Then, based on the analysis of surveys carried out in the Lusitanian Basin, the study area was delimited from Benfeito, Torres Vedras 4 to Sobral. Finally, the sensitivity analysis finds that, comparing with the base case scenario, the variation of Capital expenditure is the parameter that most influences the profits and payback period. To conclude, shale gas exploitation in Portugal would lead to high economic benefits, despite the existence of a relatively more inefficient fee system that fails to truthfully reflect its negative environmental impacts.
Keywords
ix
Table of contents
Acknowledgements ... iii
Sumário ... v
Abstract ... vii
Table of contents ... ix
List of figures ... xiii
List of tables ... xv
Abbreviations and symbols ... 17
Introduction ... 19
Literature review ... 21
2.1 Shale gas extraction ... 21
2.1.1 Characterization of shale rock ... 21
2.1.1 Shale gas in USA ... 22
2.1.1 Shale vs coal ... 22
2.1.1.1 Marcellus Shale ... 23
2.1.2 Shale gas plays in Europe ... 25
2.1.2.1 Shale gas plays in Portugal ... 26
2.2 Hydraulic fracture ... 28
2.2.1 The technique ... 28
2.2.2 Injected fluid ... 30
2.3 Shale Gas Development ... 32
2.3.1 Potential benefits ... 33
2.3.1.1 Natural gas prices ... 33
2.3.1.2 Economic development ... 34
2.3.1.3 Carbon reduction ... 35
2.3.2 Possible costs ... 35
2.3.2.1 Environmental factors ... 35
I. Land take ... 36
II. Water usage ... 37
III. Groundwater contamination ... 38
IV. Flowback ... 39
V. Surface water contamination ... 42
VI. Air quality... 45
VII. Seismicity ... 47
2.3.2.2 Social Factors ... 48
x
II. Public health ... 49
2.4 Characterization of Lusitanian Basin ... 51
2.4.1 Water resources ... 51
2.4.2 Groundwater ... 52
2.4.3 Surface water ... 53
2.4.4 Air quality... 55
2.4.5 Seismicity ... 55
2.4.6 Social characterization... 57
2.5 Economic characterization ... 58
2.5.1 Existing studies of viability ... 59
Materials and methods ... 61
3.1 Chemical analyses from Marcellus flowback water ... 62
3.2 Lusitanian Basin ... 65
3.3 Exploratory investment decision analysis ... 67
3.3.1 The Lusitanian Basin case ... 68
3.3.1.1 Portuguese legislation ... 69
3.3.1.2 Data ... 69
Results and discussion ... 73
4.1 Chemical analyses from Marcellus flowback water ... 73
4.2 Lusitanian Basin ... 76
4.2.1 Land take ... 77
4.2.2 Water usage ... 77
4.2.3 Groundwatercontamination ... 78
4.2.4 Surface water contamination ... 78
4.2.5 Air quality... 79
4.2.1 Job creation ... 79
4.3 Exploratory investment decision analysis ... 80
4.3.1 Base case scenario ... 80
4.3.2 Sensitivity analysis ... 82
4.3.2.1 Evaluating CAPEX ... 82
4.3.2.2 Evaluating OPEX ... 83
4.3.2.3 Evaluating gas price ... 84
4.3.2.1 Evaluating Discount factor ... 85
4.3.3 Discussion of results ... 85
Conclusion ... 89
References ... 91
xiii
List of figures
Figure 2.1. Projected U.S. Natural Gas Production by Source (1990-2040) ... 21
Figure 2.2. US shale gas plays ... 22
Figure 2.3. Marcellus and Utica shale formations ... 24
Figure 2.4. Shale gas in regions and countries ... 25
Figure 2.5. – Map of concessions in Portugal ... 27
Figure 2.6. Hydraulic fracture process ... 28
Figure 2.7. Injected fluid cycle in hydraulic fracture ... 30
Figure 2.8. The components of hydraulic fracture fluid ... 30
Figure 2.9. Percentage of the different types of chemicals in hydraulic fluid ... 31
Figure 2.10. Sand acts as a proppant in Hydraulic fracture ... 32
Figure 2.11. Three pillars of sustainability ... 32
Figure 2.12. Schematic representation of infrastructures and potential impacts ... 36
Figure 2.13. Multi well pad representation ... 37
Figure 2.14. Shale gas life cycle ... 45
Figure 2.15. Shale Gas Employment contribution in US ... 48
Figure 2.16. Shale gas employment contribution, 2010 ... 49
Figure 2.17. Meteorological maps of Portugal in February and August of 2015 ... 51
Figure 2.18. Water supply in Lisbon district ... 52
Figure 2.19. Groundwater resources in Portugal ... 53
Figure 2.20. Main superficial water in Portugal ... 54
Figure 2.21. Location of the boundaries of the Lusitanian basin and failures ... 55
Figure 2.22. Map of potentially seismogenic faults obtained from seismic reflection ... 56
Figure 2.23. Resident population according to age group and sex ... 57
Figure 3.1. Laboratory procedure ... 62
Figure 3.2. Laboratory procedure ... 62
Figure 3.3 - Collection to XRF and XRD analysis ... 63
Figure 3.4 - Laboratory procedures to XRF ... 64
Figure 3.5. Geological map of Portugal with Lusitanian Basin painted (1:1 000 000) ... 65
Figure 3.6. Present value of a cash flow stream ... 67
Figure 3.7. Gas production declining curve ... 71
Figure 4.1 – Fluorescence spectrophotometry results. ... 74
Figure 4.2 – Concentration of metals in flowback water (ppm) ... 75
Figure 4.3. Study area localization ... 76
Figure 4.4. 3D study area representation ... 77
xiv
Figure 4.6. Sensitivity analysis - CAPEX variation with royalties ... 82
Figure 4.7. Sensitivity analysis - OPEX variation without royalties ... 83
Figure 4.8. Sensitivity analysis - OPEX variation with royalties ... 83
Figure 4.9. Sensitivity analysis - gas price variation without royalties ... 84
Figure 4.10. Sensitivity analysis - gas price variation with royalties ... 84
xv
List of tables
Table 2.1. Main constituents of hydraulic fluid and their respective purposes ... 31
Table 2.2. Model of cost-benefit analysis for shale gas development ... 33
Table 2.3. Water used per well in Marcellus Shale ... 37
Table 2.4. Potential metals in flowback water ... 41
Table 2.5. Water use and wastewater per well ... 42
Table 2.6. Surface water Typical TOC Concentrations... 43
Table 2.7. Constituent of injected fluid, flowback and sea water ... 44
Table 2.8. Elements of injected fluid, flowback and sea water ... 44
Table 2.9. Emission factor of fossil fuels ... 45
Table 2.10. Methane emitted during flow-back in different states of US ... 46
Table 2.11. Common health effects in human and other animal in consequence of fracking exposition ... 50
Table 2.12. Characteristics of the major river in Portugal ... 54
Table 3.1. Surface rentals in Pombal and Batalha concession contract ... 69
Table 3.2. Gas natural price forecast. Source: World Bank ... 70
Table 3.3. Selected rates European shale gas basins ... 71
Table 3.4. Royalties per annual production ... 72
Table 3.5. Royalties per barrel commercialized ... 72
Table 4.1. Non-purgeable organic carbon and total nitrogen results ... 73
Table 4.2. pH results from the flowback water samples ... 73
Table 4.3. XRF analysis results in ppm ... 74
Table 4.4. Characteristics of the point chosen ... 76
Table 4.5. Water resources depletion for single well ... 78
Table 4.6. Selected properties European shale gas basins. ... 80
Table 4.7. Sensitivity analysis - Base case scenario results ... 81
Table 4.8. Sensitivity analysis - evaluating CAPEX ... 82
Table 4.9. Sensitivity analysis - evaluating OPEX ... 83
Table 4.10. Sensitivity analysis - evaluating gas price ... 84
17
Abbreviations and symbols
Al - Aluminum
APA - Portuguese Environment Agency Ba - Barium
Bcf – Billion of cubic feet Br - Bromide
BTEX - Benzene, toluene, ethylbenzene and xylene Btu - British thermal unit
Ca - Calcium
CAPEX - Capital expenditures Cf – Cubic feet
Cl - Chloride Cr - Chromium
DOH – Department of Health EI - Energy Institute
EIA - Department of Energy’s Energy Information Administration EPA - United States Environmental Protection Agency
FB – Flowback
GDP – Gross Domestic Product GWP – Global Warming Potential HCO3 - Bicarbonate
H2S – Hydrogen sulfide Hg - Mercury
IPMA – Portuguese Sea and Atmosphere Institute INE - National Institute of Statistics of Portugal IRR – Internal Rate of Return
K - Potassium Li – Lithium
LNEG – National Laboratory of Energy and Geology MCL - Maximum contaminant level
Mcf – Millions of cubic feet mg/l - Milligrams per liter M – Thousand
MM – Million Mn - Manganese
MSDS - Material Safety Data Sheet Na - Sodium
nd - Not determined N2 - Nitrogen
Ni - Nickel NO2 - Nitrite NO3 - Nitrate
NOAA - National Oceanic and Atmospheric Administration NOM - Natural Organic Matter
NORM - Naturally occurring radioactive materials NPT - Nonproductive time
Pb - Lead
18 OPEX - Operating expenditures
TC – Total Carbon TN – Total Nitrogen
19
Introduction
Hydraulic fracturing is a technique used in "unconventional" gas production. This technique involves the injection of pressurized fluids to stimulate or fracture shale formations and release the natural gas. After this process, the internal pressure of the rock formation causes fluid to return to the surface through the wellbore. This fluid, known as flowback water, contains the injected chemicals plus naturally occurring materials. Hence, the main issue of hydraulic fracturing is its potential negative environmental impact, mainly due to the flowback water.
In Portugal, the interest in shale gas exploration has been growing and several energy companies are currently studying the economic potential of the Portuguese basins, in particular the Lusitanian Basin. Moreover, given the taxation system of petroleum industry in Portugal, it is important to mention the low rates applied considering both the costs of local pollution and rates charged in other countries.
Objectives and research
Q1 –What are the environmental impacts associated to the flowback water caused by hydraulic
fracturing?
Q2 – What is the economic potential of gas production in shale formations of Lusitanian Basin? Q3 – How different taxation systems may influence the investment decision in shale gas?
20 Dissertation structure
This work is organized in 8 chapters:
1. Introduction - work scope and relevance, main objectives and structure;
2. Literature review - description of the central theme and relevant terms and previous work developed;
3. Materials and methods – description of how the study were conducted 4. Results and discussion – interpretation of the results
5. Conclusions – main outcomes; 6. References
21
Literature review
2.1
Shale gas extraction
2.1.1
Characterization of shale rock
Shale is a sedimentary rock formed from compaction of silt and clay-size mineral particles that
are usually called ‘mud’. The mud is a precursor to natural gas and oil deposits as a result of its high organic material content (Rozell and Reaven, 2011). This rock can be silty or calcareous, and grade into other lithology (siltstone/limestone).
There are two types of shale: organic-rich (black) and organic lean (gray or red). Shale can be distinguished from other mudstones because it is fissile and laminated, which indicates that the rock is made up of many thin layers (Passey et al., 2010).
The main difference between shale and other gas reservoirs is represented by the low reservoir permeability and the fact that the generated hydrocarbons do not suffer any migration, being the host rock to reservoir rock itself. The low permeability of shale has been limiting the production of gas shale resources. Thus, hydraulic properties such as permeability and porosity reflect the ability of rocks to hold and transmit fluids such as water, oil or natural gas (Cho et al., 2013). Properties such as porosity and medium permeability of rocks reservoir are rarely mentioned in the literature, on Hall, (2011) it is refereed that the expectable porosity of shale gas rock is till 6% although this value cannot be considered as absolute (Baptista, 2011).
Figure 2.1 shows the growth and projections in unconventional energy production in the United States (US).
22
2.1.1
Shale gas in USA
Shale formations in the United States have been increasing as a source of natural gas and oil. The
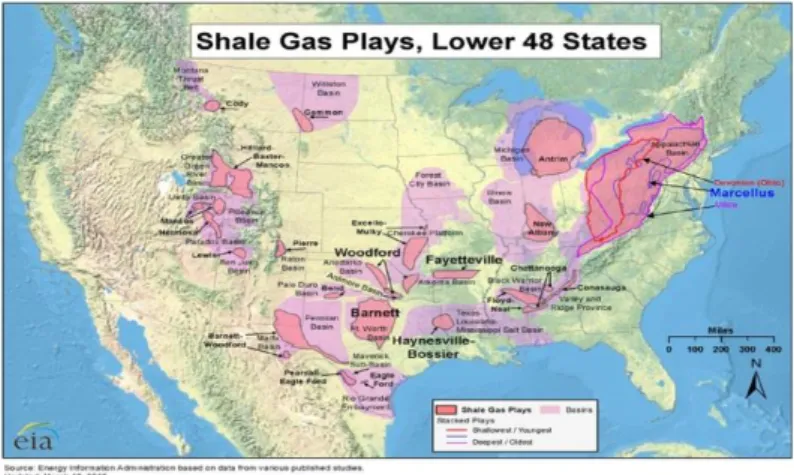
U.S. Energy Information Administration’s (EIA), National Energy Modeling System (NEMS) began representing shale gas resource development and production in the mid-90s. However, only in recently shale gas has been recognized as a “game changer” for the U.S. natural gas market (Meade, 2015). Figure 2.2 represents the natural gas shale basins and plays of US.
Figure 2.2. US shale gas plays (UTU, n.d.)
According to Vengosh et al., (2013), recent advances in drilling technologies and production strategies, such as horizontal drilling and hydraulic fracturing, have significantly improved the production of hydrocarbons by stimulating the flow of gas and liquids from impermeable geologic formations.
These technological improvements have overvalued the exploration of oil and gas in several unconventional areas throughout the U.S., particularly in the Barnett, Haynesville, Bakken, Fayetteville, Woodford, Utica, and Marcellus shale formations (Figure 2.2). EIA, (2013) estimates that by 2035 about 50% of the total expected gas production in the U.S will be provided from shale gas production, increasing to 340 billion cubic meters (bcm) per year.
2.1.1
Shale vs coal
Today, in the “golden age of gas” (IEA 2011), the high potential of shale gas that some authors defend, is controversial due to its environmental impact. Researchers have been doing comparative analysis including positive and negative aspects of the extraction of gas, such as shale gas and some other conventional gas like coal.
23 oxides (NOx) than coal. In addition, its burns almost no sulfur dioxide (SO2), carbon monoxide (CO), black carbon, particulates and mercury (Jenner and Lamadrid, 2013). However, several authors defend different opinions regarding the long-term consequences associated with the methane (CH4) released from the shale gas, being a reason to doubt about the better footprint of shale compared to coal (Tollefson, 2012).
According to Parenteau and Barnes, (2013):“In certain respects, this surge of natural gas has benefited the environment and public health. Low natural gas prices have dramatically altered the energy mix in the electricity sector, particularly with respect to coal—the dirtiest fuel that imposes the highest social costs. One result of displacing all of this coal is that United States carbon
emissions are, for now at least, the lowest they have been in twenty years.”
On the other hand, methane is the principal component of natural gas and produces 30 times more radiative forcing than CO2 over a 100-year time frame (Omara et al., 2016). Howarth et al., (2011) affirms:
“The footprint for shale gas is greater than that for conventional gas or oil when viewed on any time horizon, but particularly so over 20 years. Compared to coal, the footprint of shale gas is at least 20% greater and perhaps more than twice as great on the 20-year horizon and is comparable when compared over 100 years.”
2.1.1.1
Marcellus Shale
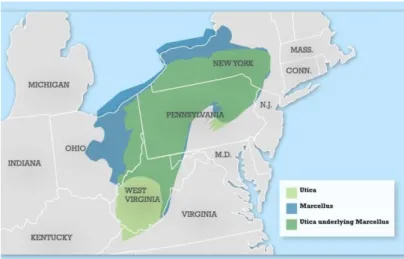
Marcellus shale formation is the most expansive shale gas play in the U.S. covering an area of 240 000 km2 along six states and underlies nearly 75 % of Pennsylvania (Soeder and Kappel, 2009).
24 Figure 2.3. Marcellus and Utica shale formations (Marcellus Shale Coalition, 2015)
Marcellus shale forms the bottom or basal part of a thick sequence of Devonian age (416 - 359 million years ago) sedimentary rocks in the Appalachian Basin (Waples, 2012). This shale contains significant quantities of natural gas and belongs to a group of black, organic-rich shales (Kargbo et al., 2010).
In Marcellus Shale, the natural gas varies from wet in the western portion of the state to dry in the northeast. The organic-rich, gas-producing layers of Marcellus shale range from less than 1,5 m thick to more than 72 m and are located around 2 800 m below the earth surface. In general, the higher the depth, the natural gas contains higher proportions of methane and less “wet” gas components, such as propane, butane and ethane (Lampe and Stolz, 2015).
The organic matter deposited within Marcellus formation was compressed and heated deep within the earth over geologic time, forming hydrocarbons, including natural gas. Besides that, the gas occurs in fractures, in the pore spaces. This is the main reason why Marcellus Shale is considered an important gas resource (Byrd, 2007). Thus, Marcellus Shale is an important component of the US National Energy Program that seeks both greater energy independence and greener sources of energy (Harper, 2008).
25
2.1.2
Shale gas plays in Europe
According to European Parliamentary Research Service (EPRS, 2014), “Some European regions have significant shale gas resources, but more exploration is needed to find out whether they can
be developed commercially”. However, Europe has a high population density and has more rules
restricting the exploration of oil and gas than the US regulating how to explore for oil and gas (Kavalov and Pelletier, 2013).
Besides that, according to EPRS, (2014), “Most analysts agree that shale gas in Europe will be more expensive than in the US, due to different geology and the need to address public acceptance and environmental impact. Shale gas will not resolve short-term energy security issues as exploration and development will take 5 to 15 years. In any case, the volumes produced will not make Europe self-sufficient in gas, but could help to reduce gas prices”.
The World Energy Outlook (IEA, 2012) mentioned that natural gas demand in the European Union (EU) is not expected to rise above the 2010 levels before 2020. On the other hand, EPRS (2014) projected the increase of worldwide energy demand by 27% up to 2030, which also has an impact on Europe's energy security.
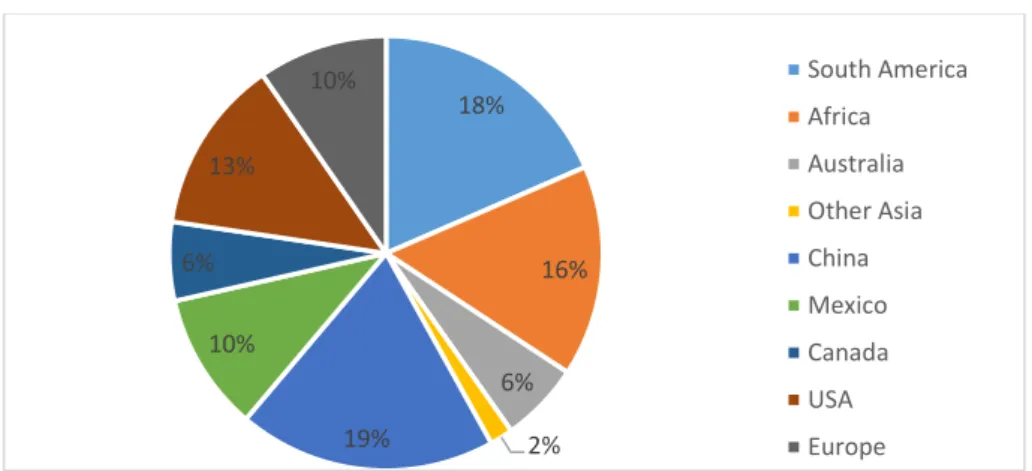
According to EPRS (2014) the EU imports 53% of its energy needs. In 2013, the EU imported 305 bcm of natural gas – 66% of its consumption. In 2014, in the global perspective of shale gas, Europe represents of 10% of existing shale gas resources worldwide (Figure 2.4). Poland and France have the largest estimated shale gas resources in the EU, representing about 60% of existing resources in Europe with 29% and 28%, respectively.
Figure 2.4. Shale gas in regions and countries (EIA, 2015)
Six EU Member States are dependent on Russia for their entire imports of natural gas and 71% of Russian gas exports go to the European market. For this reason, countries in Eastern Europe like Poland, Ukraine and Lithuania are more open to shale gas, both to generate jobs and to ease their dependence on Russian gas (EPRS, 2014).
18% 16% 6% 2% 19% 10% 6% 13%
10% South America
26 Turkey started hydraulic fracturing operations in 2013 to extract shale gas in the Thracian and south-eastern regions. This may help reduce the country's dependence on energy imports, but Turkey is not expected to become a gas exporter (EPRS, 2014).
In the U.K., the underground mineral rights do not belong to the landowner, as they often do in the US, but to the British Government. In December of 2014, the current government was in favor of shale gas development, and had adopted regulations for that. However, as Edward Dave stated,
“We are still in the very early stages of shale gas exploration in the U.K., and it is likely to develop slowly” (Department of Energy & Climate Change of the Government of the United Kingdom, 2012).
France, Bulgaria, and parts of Spain have already banned fracking, concerned about the environmental risks. For example, in France, on April of 2015, the French Minister for the Environment, Ségolène Royal, stated in a press release that "reopening the shale gas debate may jeopardize the economic recovery created by the law on energy transition," and that energy companies should instead concentrate on investing in renewable energy. Additionally, she concluded the debate by saying that shale gas extraction was no longer a "viable" topic (Urbain, 2015).
2.1.2.1
Shale gas plays in Portugal
Natural gas was introduced in Portugal in 1997 in order to provide a competitive, convenient and ecological energy source (Arentsen and Künneke, 2003). Further allowing the diversification of Portugal's energy resources, natural gas also reduces oil dependence and increases the competitiveness of the Portuguese oil and gas industry (Kondratowicz and Brzdek, 2013). Portugal is part of the list of countries with shale gas formation. However, there are no detailed studies on the potential of shale gas in Portugal. Besides that, according to Portuguese legislation, to produce any exploration or drilling with unconventional methods such as hydraulic fracturing in Portugal, an environmental study will be required.
According to studies performed on national territory, the Lusitanian basin in the municipalities of Alenquer, Bombarral and Cadaval, is pointed as the most potential area rich in shale in Portugal. The Algarve and Alentejo basins also have potential. However, the amount of shale is not so significant and they are in environmentally protected areas (LNEG, 2014).
27 In 2015 it was signed the concession agreement for oil exploration in the areas of Aljezur and Tavira in Algarve. According to the National Authority for the Fuel Market (ENMC, 2015), the contracts for the concession, research, development and production of oil for these areas predict just research on land using traditional methods, for a period of eight years.
In September 2015 the company Australis Oil & Gas Ltd. signed through direct negotiation the only concession of the Lusitanian basin. There is no information on the type of work that is currently being done by this company once the concession contract covers all stages of exploration, research, development and production of oil.
Figure 2.5 presents the map of concession in Portugal, with the Lusitanian Basin marked with a red cycle. According the information collected from the ENMC, Lusitanian Basin is the most researched basin for hydraulic fracturing in Portugal, with a drilling density of 2,4 per 1 000 km2 (ENMC, 2015a).
28
2.2
Hydraulic fracture
2.2.1
The technique
Hydraulic fracturing, or “fracking”, is a method which has been used in the oil and gas industry for decades (Engle and Rowan, 2014). The process involves drilling and injecting fluid into the ground at a high pressure in order to fracture shale rocks and to release the natural gas that is trapped inside (Arthur et al., 2008).
In order to achieve the shale gas, a vertical well is first drilled and then, using directional drilling equipment, the well is drilled horizontally (Rahm, 2011). During hydro fracturing, millions liters of water with sand and a large amount of chemicals are pumped into a well under pressure in order to open or create fractures in the shale (Balashov et al., 2015).
Once the rock is fractured, the gas can flow through the horizontal part of the well, up the vertical part, for collection (Rahm, 2011). Figure 2.6 presents the process of hydraulic drilling that includes the following steps:
Site selection
Site selection is made by the Reflection Seismic Method which uses an advanced technology of sound waves that gives a view of the subsurface to pinpoint the best drilling location. This methodology works by sending sound waves to the underground using small explosive charges or vibration created by special trucks. The sonic vibrations returning back from the formation are dependents on the topography and when they are detected, they are measured by geophones at the surface and sent to a truck collecting data (Ghazanfari, 2014). This information is converted to 3D images from the surface and this data helps to have a better perception to determine the drilling location.
29
Vertical drilling process
Vertical drilling ranges from 1 500 m to 2 800 m below the ground depending upon the depth and thickness of the gas reservoir. Vertical drilling occurs through sediment layers and the water table, in order to reach the shale rock formations, where the oil and gas are located (Ghazanfari, 2014).
Horizontal drilling process
When the shale is reached, the well changes its direction, and the drilling is then angled horizontally for another 900 m to 3 000 m or more, where a cement casing is installed and will serve as a conduit for the massive volume of water, chemicals and sand. This pressurized mixture causes the crack of rock layer (Bazant et al., 2014).
Gas extraction
The fracking process occurs after drilling a well and inserting a steel pipe in the well bore. The casing is perforated within the target zones that contain oil or gas, so that when the fracturing fluid is injected into the well it flows through the perforations into the target zones (Bazant et al., 2014). These fissures are held open by materials called proppants (usually sand or ceramic beads) so that natural gas from the shale can flow up the well (Yu et al., 2015).
Flowback and produced water
30 Figure 2.7. Injected fluid cycle in hydraulic fracture (Adapted from Frumkin, 2015)
2.2.2
Injected fluid
The hydraulic fracturing technique consists in injecting a mixture of water, sand and chemicals. (figure 2.8). Although the large amount of chemicals, its volume is less than 1% of the injected fluid (Rogers et al., 2015). The multiplicity of these chemicals is further taken into account with some public confidence, but it is estimated that more than 600 different types of chemicals are used in each hydraulic fracturing operation, representing about 80-300 ton of chemicals.
Figure 2.8. The components of hydraulic fracture fluid (Gregory et al., 2011)
Only a small percentage of the referred chemicals are used per well. However, this "one-well" is a miss representation, as fracking operations in a gas play typically consist of thousands of wells and therefore, the cumulative impacts is much higher.
Scientists have been studying the composition of the fluid, revealing that several of the chemicals used pose a significant threat to human health and well-being, such as volatile organic compounds e.g. methanol or benzene, toluene, ethylbenzene, and xylene (BTEX) components, among others.
<1% 9%
91%
Chemicals
Sand
31 According to Frac Focus, (n.d.) (which records the chemicals used in hydraulic fracturing in the US), there are 71 of those chemicals (Table A.1, Annex 1) that are most used in this technique. Through the data provided in Gregory et al. (2011), table 2.1 presents the main constituents of hydraulic fluid and their function and figure 2.9 presents the percentages of the most important chemicals in the mix and understand their associated functions.
Table 2.1. Main constituents of hydraulic fluid and their respective purposes (Gregory et al., 2011)
Figure 2.9. Percentage of the different types of chemicals in hydraulic fluid (Gregory et al., 2011)
Water
The exact quantity of water used in fracking depends on the well where it is applied but, usually, it requires 10-20 million liters per facture per well. Of this quantity of water, 68% normally comes from surface water, 32% from public supply that is usually purchased (Peraki and Ghazanfari, 2014).
Sand
Sand is usually can be used in fracking as a “proppant” (figure 2.10) in order to facilitate the natural gas or crude oil to be extracted (Ziemkiewicz and Thomas He., 2015). Once the shale rock
Acid
Friction reducer
Surfactant
Salt Scale inhibitor pH-adjusting
agent
Iron control Corrosion
inhibitor
32 formations are injected with water and chemicals, the function of the sand it is to keep the newly formed cracks open after they are made in the rock.
Figure 2.10. Sand acts as a proppant in Hydraulic fracture (U.S. Global Investors, 2014)
Chemicals
The chemicals inserted during the fracture process have many functions, e.g. to insure that the fracturing is effective and efficient, to limit the growth of bacteria or to prevent the corrosion of the well casing.
2.3
Shale Gas Development
Figure 2.11. Three pillars of sustainability
33 conclusions will be the opposite. Regarding that, it is really important to balance these three elements.
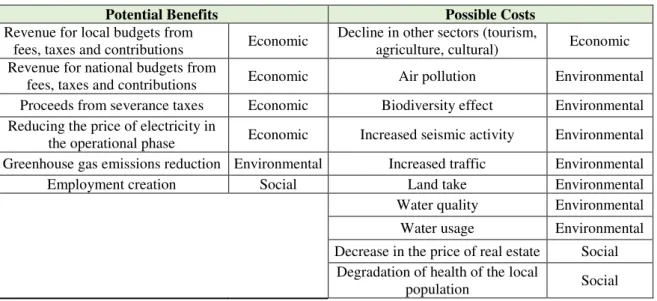
Unconventional oil and natural gas extraction enabled by horizontal drilling and hydraulic fracturing is described from “revolutionary” to “disastrous.” (Jackson et al., 2014). In order to present a clear and succinct explanation of this two distinct opinions around fracking, this study will be adjusted to the model presented in table 2.2, which summarizes some potential benefits and costs of a shale gas exploitation.
Table 2.2. Model of cost-benefit analysis for shale gas development (Adapted from Muresan and Ivan, 2015)
Potential Benefits Possible Costs
Revenue for local budgets from
fees, taxes and contributions Economic Decline in other sectors (tourism, agriculture, cultural) Economic Revenue for national budgets from
fees, taxes and contributions Economic Air pollution Environmental Proceeds from severance taxes Economic Biodiversity effect Environmental Reducing the price of electricity in
the operational phase Economic Increased seismic activity Environmental Greenhouse gas emissions reduction Environmental Increased traffic Environmental
Employment creation Social Land take Environmental
Water quality Environmental Water usage Environmental Decrease in the price of real estate Social
Degradation of health of the local
population Social
2.3.1
Potential benefits
In 2013, EIA projected that natural gas production in the U.S would grow 44% among 2011 and 2044, generally due to a 113% increase in the total amount of natural gas produced from shale (EIA, 2013). Beyond its use as an energy supply, natural gas derived from hydraulic fracturing also has the potential to reduce greenhouse gas emissions since it releases less CO2 than coal when converted into electricity. (Maniloff and Mastromonaco, 2014).
Although the average cost of shale gas production vary from site to site, it tends to be about 50–
66 percent cheaper than production from new conventional gas wells, and technological improvements could also drive costs down further (Sovacool, 2014).
2.3.1.1 Natural gas prices
After the shale gas revolution, the prices of natural gas dropped drastically in US (Aruga, 2016). The shale gas boom had contributed not only to the birth of a new era of cheap natural gas, but also to the decoupling of US natural gas price from the crude oil price, which has a significant
34
Shale gas decreased the prices of natural gas in the US significantly compared to other major
markets. In fact, without the shale gas development, the natural gas prices could be more than 2,5 times higher than they otherwise would be by 2050. These lower energy prices from increased supply would likely increase energy consumption overall and encourage switching to natural gas from other energy sources, including coal, nuclear, and renewables (Jackson et al., 2014). Thus, natural gas has become an increasingly important fuel for electricity generation. This expansion in the supply of inputs into the electricity market, lowers costs to the gas-fired electricity producers as well as electricity prices for consumers (Mason et al., 2014).
On the other hand, the Organization of the Petroleum Exporting Countries (OPEC), informally led by Saudi Arabia, has been struggling with the growing production of shale gas. In order to deal with its competitors at the time that demand was slowing decreasing, OPEC decided to reduce oil prices and increase the quantity produced. Thus, the objective with these measures is to bring the price of gas down, to a point where it would not be feasible to shale gas producers to compete, as they will be making losses and would not be able to pay for its hydraulic fracture infrastructures (Rava, 2015). The results of these measures can be quantified by observing the latest Commodity Markets Outlook report from World Bank (World Bank, 2016).
Therefore, IEA report estimates that oil prices should not return to the minimum set in January 2015 and affirms that the collapse in prices in recent years is already having results in a production fall by countries outside the countries of OPEC as US (EIA, 2016).
2.3.1.2 Economic development
The economic development is known as the main benefits of hydraulic fracture as it comprises the employment, jobs, infrastructure, revenues, and taxes (Sovacool, 2014). These factors also affect economic development indirectly, providing higher incomes and landowner royalties. Pennsylvania, where the majority of Marcellus play are situated, saw its shale gas boom create 29 000 new jobs in 2008 with revenues of $2,3 billion and tax revenues for governments of $238 million (Kargbo et al., 2010). In 2009, production on the Marcellus Shale across West Virginia and Pennsylvania brought $4,8 billion in gross regional product, generated 57 000 new jobs, and created $1,7 billion in local, state, and federal tax collections (Scott, 2013).
35 closed in some wells, others are being added. According to (Forbes, 2014), further declines in oil prices could continuing happening and reducing this growth of shale gas industry but the most productive basins for shale oil and gas will remain profitable.
On the other hand, in 2016 US shale gas has been imported into Europe for the first time which represents more economic development for US, including new jobs and market opportunities.
2.3.1.3 Carbon reduction
As mentioned above, natural gas burned for electricity generates half the CO2 that coal does during combustion. However, natural gas derivate of shale are still fossil fuel, which release greenhouse gases when burned and the most worrying factor is the large quantities of released methane emissions (Howarth et al., 2011).
According to the reports from the EIA and the EI, carbon emissions from fossil-fuel combustion in the US has decreased gradually in recent years (EIA, 2014) and this fact is usually associated to the actual energy production changing process associate to shale gas industry.
Given all recent methane emission estimates for unconventional gas production are based on sparse and poorly documented data, the knowledge on current and future emission levels from shale gas and hydraulic fracturing remains highly uncertain (Olivier et al., 2013).
2.3.2
Possible costs
2.3.2.1 Environmental factors
Despite the advantages of the shale gas exploitation, it is also important to state that its development has been followed by several scientific concerns related to the negative impact that it creates, affecting the water, air and the quality of life in the region where its production occur (He and You, 2016).
Due to the complexity and importance of the topic, it is worth subdividing the main theme into two different section, in order to include all the externalities faced by the process of hydraulic fracture. Therefore, the first section will focus on the environmental factors and the second section will approach the social factors as health effects to the human beings that live close to an exploitation.
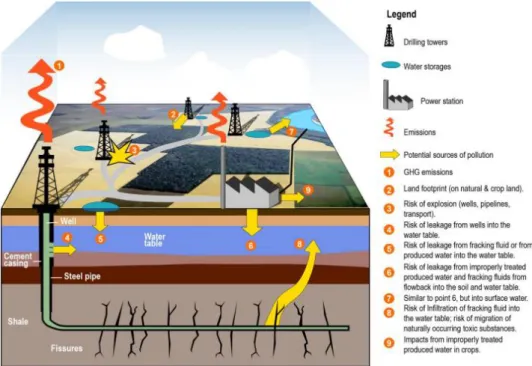
36 that are not present in the figure as they cannot explain visual represented, however they are equally important as the rest of the problems.
Figure 2.12. Schematic representation of infrastructures and potential impacts (UNEP, 2012)
I. Land take
The land take from hydraulic fracture vary depending on numerous factors: the locations of the well (well pad), the well pad density and size, and the number for well pads. Other indirect factors are associated as access, pipes and other supply lines. It is important to take in to account that the places where the wells are located require more than a single well, it is necessary to have ponds, tanks, fracturing equipment, emission reduction equipment, dehydrators, separators, and brine tanks.
The full exploitation of shale gas usually requires four phases of stimulation which are estimated to last 40 years (Broomfield, 2012). In fact, the land use requirement is highest during the hydraulic fracturing stage, and lower during the production stage. Due to the prevalence of horizontal drilling, wells may be situated in isolation or, more commonly, drilled in clusters on multi-well pads.
37 Figure 2.13. Multi well pad representation (Statoil, 2010)
II.Water usage
According to Sovacool (2014), the majority of sites in the United States need between 10–20 million liters of water per well. Nicot and Scanlon (2012), studies the water usage in different basins, affirming that Barnett Shale requires around 11 000 m3 of water per well, Haynesville Shale, TX requires around 21 500 m3 and Eagle Ford, TX around 16 100 m3. Table 2.3 presents different perspectives of water used per well in Marcellus Shale, PA.
Table 2.3. Water used per well in Marcellus Shale
Basin Water use per well (m3) Source
Marcellus Shale, PA (<2010) 7 700−38 000 Kargbo et al. (2010) Marcellus Shale, PA (2008−2011) 11 500−19 000 Lutz et al. (2013)
This high demand of water that is required to hydraulic fracture has two important implications:
1. The difficulty to produce shale gas in areas where water is limited. The majority of the
world's water sources are already under stress and Gleeson et al., (2012) predicted that global groundwater needs are 3,5 times higher than the actual area of aquifers, and they warned that 1,7 billion people live in areas “where groundwater resources and/or groundwater-dependent ecosystems are under threat”.
2. The potential risk that shale gas production might cause in the quality of the water. Shale gas production generates waste from drilling muds, flowback and produce brines, all requiring proper treatment and disposal (Peraki and Ghazanfari, 2014).
38 Another factor that is important to be consider is that wells may have to be fractured several times for the stimulation of the well by injecting over pressurized water for the creation of the cracks and that means that is necessary even more water in hydraulic fracturing (Lechtenböhmer et al., 2011). Each additional fracture operation may require more water than the previous one and in some cases, the wells are re-fractured up to 10 times.
These large volumes of water are usually acquired from nearby water surface or pumped from a municipal source. In Portugal, the water abundance is very dependent on the time of the year and location. According to IPMA, (2015), in august over 70% of continental territory was passed for a severe drought, the second most serious in 70 years.
III. Groundwater contamination
Groundwater contamination from shale gas operations can occur through a variety of mechanisms (Cooley and Donnelly, 2012). However, there is limited data on the effect of fracking in the quality of water as shale gas production is currently exempted from the U.S. Safe Water Drinking Act (SDWA). Thus, it becomes difficult to systematically monitor possible groundwater contamination (Sovacool, 2014).
Hydraulic fracturing can result in the unintentional contamination of groundwater with methane, chemicals and other toxic substances released from the fracturing of shale layers, including heavy metals. The most harmful contaminants in the shale formations that are dissolved into the fracturing fluid are CH4, CO2, H2S, N2, He, trace elements such as Hg, As, Pb, Ra, Th, U, and VOCs such as benzene.
A survey made by State University of New York College in five different states, estimates that 2% of wells that are used for hydraulic fracture may end up contaminating groundwater with
fracking fluids (Bishop, 2011).
39 Old and abandoned wells can also serve as migration pathways for contaminants to enter groundwater systems (Cooley and Donnelly, 2014). Coalbed methane is generally found at shallower depths and in closer proximity to underground sources of drinking water and therefore this rote can also serve as a conduit for groundwater contamination (Cooley and Donnelly, 2012). According to Michie and Koch (1991), the risk and importance of aquifer contamination from leaks inside the well to the drinking water resource decreases by a factor of approximately one thousand when surface casing extends below the bottom of the drinking water resource.
IV.
Flowback
Around 80% of the injected volume of water remains bound to the dry shale matrix and only 10-20% is recovered as a wastewater stream, known as flowback water (Kondash and Vengosh, 2015).
Flowback water is the mixture that returns to the surface having the chemical of initial fluid and also the constituents originating from the shale formations. The predominant constituents of flowback water are the dissolved salts as calcium, magnesium, chloride, or barium, among others (Peraki and Ghazanfari, 2014). In addition to hazardous substances contained in fracturing fluids, flow-back may contains heavy metals and radioactive materials from the deposit.
Naturally occurring radioactive materials (NORM) are part of any geological formation, though with a very small share in the ppm to ppb range. The organic matter in black shales is the material that generates the gas but in seawater and sediment geochemistry, the organic material also has an affinity for attracting radionuclides, mainly uranium (Engelder et al., 2014). Through the hydraulic fracturing process, these radioactive materials such as uranium, thorium and radium bound in the rock are transported to the surface with the flow-back fluid. NORM can also move through the cracks in the rock into the ground and surface water. Usually, NORM accumulates in pipes, tanks and pits (Peraki and Ghazanfari, 2014).
40 In order to support the study of environmental impacts of shale gas exploration it is important to analyses the composition of flowback water, as it represents the main source of direct environmental impacts (Rahm et al., 2013).
Total Organic Carbon (TOC)
TOC is a good indicator of the water quality and their control can help to determine the efficiency of the treatment that will be applied to flowback water. Thus, TOC provides an estimate of the amount of natural organic matter (NOM) in the water source (Leenheer and Croué, 2003). In the following section of surface water contamination (2.3.2.4) is presented a comparison between the typical TOC concentrations in different types of water contamination.
Total Nitrogen (TN)
TN represents all forms of nitrogen (organic and inorganic) and symbolizes an essential nutrient for plants and animals. However, an excess amount of nitrogen in a waterway may lead to low levels of dissolved oxygen and might have a negative impact in different plants and organism’s
life. The importance of nitrogen in the aquatic environment varies according to the relative amounts of the forms of nitrogen present such as ammonia, nitrite, nitrate, or organic nitrogen (Rabalais, 2002). In fact, total nitrogen is the sum of total kjeldahl nitrogen (ammonia, organic and reduced nitrogen) and nitrate-nitrite.
The natural level of ammonia or nitrate in surface water is typically low (less than 1 mg/l) and total nitrogen is reported as mg/l and an acceptable range of total nitrogen is 2 mg/l to 6 mg/l. Excess nitrates can cause hypoxia (low levels of dissolved oxygen) and can become toxic to warm-blooded animals at higher concentrations (10 mg/l) or higher) (Spellman, 2006).
pH
In order to ensure the efficiency of surfactant additives that facilitate the infiltration of injected fluid into bedrock, the pH of fracking fluid is maintained within a narrow range. Thus, organic acids, such as acetate and formate, are added to fracking fluid to adjust the pH. These organic acids can act as a carbon source, increasing the growth of anaerobic bacteria which results in the production of corrosive and toxic hydrogen sulfide (Fisher et al., 2013). Additionally, as the
fracking solution is not totally recovered, bacteria’s can grow within the interstitial cracks
41 contaminates. Generally, small changes in pH are usually associated with relatively large changes in water qualities.
Metals
In most flowback waters, the concentrations of toxic elements such as barium, strontium, and radioactive radium are positively correlated with the salinity. The correlation of toxic and radioactive elements with salinity suggests that many of the potential water quality issues associated with wastewaters from unconventional shale gas development may be attributable to the geochemistry of the brines within the shale formations (Vengosh et al., 2014).
The table 2.4 lists the metals that are expected to be found in the flowback water.
Table 2.4. Potential metals in flowback water (Jack et al., 2014)
Aluminum Antimony Arsenic Barium Beryllium Boron Calcium Cadmium Cobalt Chromium Trivalent Chromium Copper Iron Lead Lithium Magnesium Manganese Molybdenum Nickel Potassium Sodium Selenium Strontium Titanium Thallium Zinc
Dissolved Organic Matter (DOM)
Water travels through the environmental carrying dissolved organic matter (DOM), made-up of various chemicals compounds. The amount of DOM in water and its chemicals composition vary in space and time.
Fluorescence spectroscopy can provide information about the amount and type of DOM in a water sample. The chemicals composition of DOM is determined by its original source material and the process occurring in the environment through which it travels. Futhermore, DOM characterization using fluorescence spectroscopy can help find the source of DOM (Hudson et al., 2016).
Total Dissolved Salts (TDS)
42 V.Surface water contamination
Surface water contamination is mainly associated with the operational phase of exploration, as a well pads requires the transport of materials to the site, the use of those substances, storage of wastes and the subsequent transport of wastes generated. Thus, there is an increased risk of the following situations that can promote contamination of surface waters (Ferreras, 2014):
1. Spillage of
- Concentrated fracturing fluids during transfer and final mixing operation (with water) that occurs onsite;
- Flowback fluid during transfer to storage (pipework or frac tree failure during the operation, insufficient storage capability and overflow), during transfer from storage to tankers for transport or during transport to wastewater treatment works; - Water ingress or leaching from cutting/mud pits (limited storage capacity, storm water or flood water ingress or poor construction).
2. Loss of containment of stored flowback fluid (tank rupture; overfilling of lagoons due to operator error or limited storage capacity).
After the fracturing event, the pressure is decreased and the direction of fluid flow is reversed, allowing fracturing fluid and naturally occurring substances to flow out of the well bore to the surface Some injected fluid returns to the surface and by implication, some injected fluid remains underground. Table 2.5 presents an example of water use and wastewater from a well of Marcellus formation.
Table 2.5. Water use and wastewater per well
Basin Water use per well (m3) Wastewater per
well (m3) Source
Marcellus Shale, PA (2014) 16 124 5 201 Kondash and Vengosh (2015)
The fast and intense growth of unconventional drilling could lead to a higher possibility of surface spills or leaks and consequently, increase the potential contamination of drinking water sources (Werner et al., 2015).In some cases, overflows from wastewater pits have caused surface water contamination. Spills or leaks of hydraulic fracturing and flowback fluids can pollute soil, surface
43 Various methods are used to control polluting discharges to surface waters in order to assess the ecosystems quality of life. Measuring organic and inorganic carbon in surface waters is a method to evaluate the pollution of water and the following parameters are used:
Total Organic Carbon (TOC) Dissolved of organic Carbon (DOC)
Chemical Oxygen Demand (COD): Contains all substances that can be solubilized by chemical oxidation. It is at the same time the conventional parameter for the calculation of wastewater charges
Biological Oxigen Demand (BOD): Contains only the compounds that can be microbiologically oxidized
Table 2.6 establishes the level of contamination of waters from its typical TOC concentration.On one hand, the lines of surface water (rivers and streams) can easily recuperate pollutant discharges due to the combined effect of dilution and bacterial decomposition. On the other hand, when this contamination is high (as flowback water), these natural methods are not efficient or sufficient.
Table 2.6. Surface water Typical TOC Concentrations (Shimadzu, n.d.)
Surface water Typical TOC
Concentrations (mg/l) Typical TOC Concentrations (mg/l)
Clean spring water 1 – 2
Weakly polluted rivers and streams 2 – 5 Nutrient-rich stagnant lakes 5 – 10
Polluted waters 50 – 100
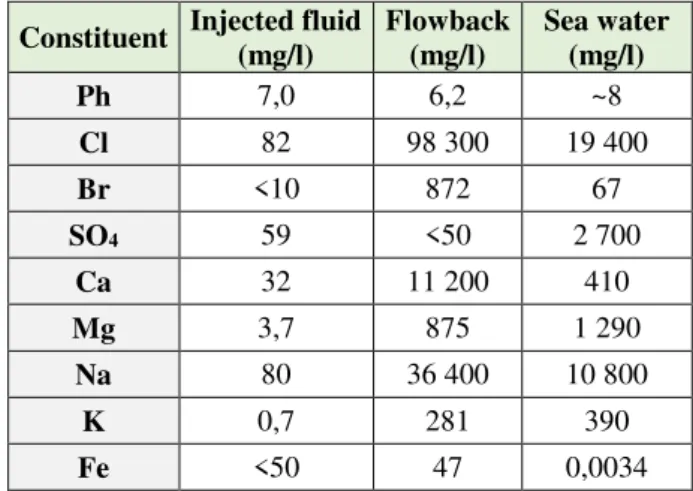
44 Table 2.7. Constituent of injected fluid, flowback and sea water (Rose, 2013)
Constituent Injected fluid (mg/l)
Flowback (mg/l)
Sea water (mg/l)
Ph 7,0 6,2 ~8
Cl 82 98 300 19 400
Br <10 872 67
SO4 59 <50 2 700
Ca 32 11 200 410
Mg 3,7 875 1 290
Na 80 36 400 10 800
K 0,7 281 390
Fe <50 47 0,0034
Table 2.8. Elements of injected fluid, flowback and sea water (Rose, 2013)
Element Injected fluid (mg/l)
Flowback (mg/l)
Sea water (mg/l)
N 14 140 15
P 0,36 0,55 0,09
Al 0,3 0,5 0,001
B 0,5 20 4.4
Li 0,04 95 0,17
Sr 0,82 2 330 8,1
Ba 0,6 1 990 0,021
Mn 0,07 5,6 0,0004
Zn 0,08 0,09 0,005
45 VI. Air quality
Air quality and its effects in climate change are two factors that also represent some concern about shale gas production. Emission factor is used in order to compare the emissions released to the atmosphere from natural gas and other fossil fuels. An emission factor is a representative value that attempts to relate the quantity of a pollutant released to the atmosphere. Table 2.9 presents the emission factors associated with the different types of fossil fuels.
Table 2.9. Emission factor of fossil fuels (Galp, 2016)
Fuel Emission factor (t C / TJ)
Gasoline 18,9
Diesel 20,2
Anthracite 26,8
Fuel oil 21,1
Natural Gas 15,3
According to table 2.9, natural gas emits less pollutants than others fossil fuel. However, emissions from numerous well developments could significantly affect the air quality and the increase in conventional air pollution may pose a threat to air-quality in shale gas extraction regions (Alvarez and Paranhos, 2012).
Air contaminants are released through the various drilling procedures, including construction and operation of the well site, transport of the materials and equipment, and disposal of the waste (Sovacool, 2014). Figure 2.14 presents the shale gas life cycle.
Figure 2.14. Shale gas life cycle (Frumkin, 2015)
46 Diesel and road dust emissions from trucks transporting water and equipment to the site,
and wastewater away
Pollutants from gases and hydraulic fracturing fluids dissolved in waste water during well completion or recompletion
Emissions from well drilling and hydraulic fracturing, including diesel combustion Emissions from the production of natural gas, including on-site diesel combustion and
fugitive emissions
Combustion emissions from natural gas powered compressor stations
The main component of natural gas is methane (Zhang and Soeder, 2015). Fugitive emissions of methane are associated with the formation of photochemical ozone as well as climate impacts. As a powerful greenhouse gas, methane has a global warming potential that is far greater than that of carbon dioxide (Howarth et al., 2011). According to the US EPA (2010), natural gas systems remain one of the most significant methane emitters in the United States. National Oceanic and Atmospheric Administration (NOAA) (2012) estimated that 4 percent of the methane produced by shale gas wells is escaping into the atmosphere (Pétron et al., 2012).
Pollutants from natural gas can also include volatile organic compounds (VOCs,) nitrogen oxides (NOx) and particles (PM) (Kemball-Cook, 2010). However, estimates of the quantity of these emissions in Pennsylvania in 2011 suggest that they represent only a small fraction of the total state emissions (Litovitz et al. 2013).
Methane emissions occur in the stages of preparation, drilling and fracturing, transport of water and chemicals, well completion, production and transportation of the product. As methane escapes from flowback, the higher emissions from shale gas happen during the hydraulic fracture process (Holahan and Arnold, 2013). Additionally, methane dissolved in the flowback water could slowly be released if stored in open tanks, adding to fugitive emissions.
Table 2.10 presents the emissions of methane in different US basins after the hydraulic fracturing stage. The differences between these locations can be explained by the productivity and the amount of water required to achieve the shale layer in each basin.
Table 2.10. Methane emitted during flow-back in different states of US (Howarth et al., 2011)
States Methane emitted during
flowback (103 m3) Haynesville (Louisiana, shale) 6 800
Barnett (Texas, shale) 370
Piceance (Colorado, tight sand) 710
Uinta (Utah, tight sand) 255
47 Well or site abandonment may also have some impacts on air quality if the well is inadequately sealed, but they may be considered low because the majority of emission are associated with the drilling process (Broomfield, 2012).
VII. Seismicity
Induced seismicity associated with high-volume of hydraulic fracturing and energy extraction has received considerable attention in the US.
The impoundment of reservoirs, surface and underground mining, withdrawal of fluids and gas from the subsurface or the injection of fluids into underground formations are known for their capability of inducing earthquakes. The earthquakes caused by the injection of fluids have become an important point of study giving the new drilling technologies that enable the extraction of oil and gas (Ellsworth, 2013).
According to Jackson et al., (2014), the main evidence for induced seismicity is divided in two steps of unconventional energy extraction. The first one is hydraulic fracturing, which rarely induces earthquakes large enough to be felt by people, and the second one is the deep injection of wastewater, which has caused significantly higher-energy earthquakes.
Hydraulic fracturing consistently produces micro-earthquakes (with magnitudes below 2) as part of the process, but as the process is currently practiced appears to pose a low risk of inducing destructive earthquakes. However, in areas with a seismic history and/or specific geological conditions, the injected fracking fluid can facilitate sliding movements of pre-existing faults and trigger major events.
Several cases have been reported in which earthquakes large enough to be felt but too small to cause structural damage were associated directly with hydraulic fracturing. Additionally, some studies associate the seismic hazard of induced earthquakes with disposal of wastewater into deep layers or basement formations (Ellsworth, 2013).
48 2.3.2.2 Social Factors
Many of the social problems and their impacts are not reflected in most cases directly and sometimes they are not studied, either for reasons of strategic order of what is considered as a priority measure or through technical and financial inability to develop those measurements. In this study will be considered two different topics: Job creation and Public health.
I. Job creation
The development of shale has increased the employment creation in the oil and gas industry. As was already stated in the benefits of fracking chapter, job creation is a valuable asset in terms of economic and social level of the country.
According to a report of IHS, (2011), in 2010 shale gas represented 27% of US natural gas production (Figure 2.15). Thus, it is estimated than during the next five years (2015) this share will grow to 43% and is expected to increase to 60% by 2035. The numbers point that natural gas has the potential to support more than 1,6 million jobs and contribute more than $230 billion to GDP in 2035 in US.
Figure 2.15. Shale Gas Employment contribution in US (IHS, 2011)
Shale gas employment contribution is calculated by the sum of its direct contribution, its indirect contribution from shale's supplier industries and an induced economic contribution resulting from additional spending throughout the US economy. In 2010, the shale gas industry supported over 600 000 jobs in US, which included 148 000 direct jobs, nearly 194 000 indirect jobs in supplying industries and more than 259 000 induced jobs. According to the estimates of this study, by 2035, the shale gas industry will support a total of over 1,6 million jobs, involved of more than 360 000 direct jobs, over 547 000 indirect jobs and over 752 000 induced jobs (IHS, 2011).
49 Figure 2.16. Shale gas employment contribution, 2010 (IHS, 2011)
On the other hand, more recent studies and news comes on to reveal that the employment rate in this sector has declined. For this reason, it is difficult to estimate the development of employment in US, only the jobs that has subsided.
II.Public health
Though the development of hydraulic fracture technologies, communities living near of the drilling operations have becoming a growing concern in terms of health issues. Consequently, the study of environmental toxicology has been rising and existing studies have provided conclusive evidence about how unconventional natural gas development affects nearby communities (McDermott-Levy et al., 2013).
The closer a population is from a well, also increases the danger potential of fracking chemicals in the health of those who are exposed. Health problems ranging from autism, asthma, cancer, heart disease, kidney failure, birth defects, allergies, and imbalances of the immune system. However, as some components are known carcinogens, many others are unknown, given that manufacturers consider their composition to be proprietary information or a trade secret (McDermott-Levy et al., 2013).
50 Table 2.11. Common health effects in human and other animal in consequence of fracking exposition
Health Category Humans Animals
Neurologic
Headaches Lameness
Incoordination Incoordination
Seizures Seizures
Inability to stand Inability to stand Short-term memory loss
Skin numbness and tingling sensations
Difficulty concentrating Dizziness
Fatigue
Respiratory
Coughing Coughing
Wheezing Wheezing
Burning in the nose and throat Heaving Difficulty breathing Difficulty breathing
Asthma
Gastrointestinal
Vomiting Refusal of food
Diarrhea Vomiting
Cramping Diarrhea
Weight loss Colic
Weight gain Dysphagia
Dermatologic
Hair loss Hair loss
Rashes Feather loss
Burning eyes Hoof problems
Dermatologic irritation Rashes
Endocrine Endocrine disruption
Reproductive
Failure to breed Failure to cycle
Abortions Stillbirths
Growth Stunting
Failure to thrive
Vascular Nosebleeds Nosebleeds
Stroke
In addition, hydraulic fracturing occurs over 2 to 5 days and may be repeated multiple times on the same well during the lifetime period of a well (25 to 40 years). Therefore, some health effects
51
2.4
Characterization of Lusitanian Basin
2.4.1
Water resources
Lusitanian basin is located on a region of Portugal where the weather is typically dry. Figure 2.17 represents the weather maps of Portugal on February and August of this year (IPMA, 2015) and it is possible to deduce that despite the drought intensity in summer, the region of Lusitanian basin in winter also do not have abundance of water.
Figure 2.17. Meteorological maps of Portugal in February and August of 2015 (IPMA, 2015)
Regarding this fact, it is important to state that in Lusitanian basin regions the limited availability of water may be a significant barrier to gas resource development.