The Critical Flow back Velocity in Hydraulic-Fracturing Shale
Gas Wells
Zheng Zhang and Boyun Guo
University of Louisiana at Lafayette
Abstract
The loss of prop pant during the flow back process in hydraulic fracturing treatments has been a problem for many years. The effectiveness of the fracture treatment is reduced. A well cleanup is often required to remove the unwanted proppant from the wellbore to re-establish production. Among several techniques available to reduce the prop pant loss, controlling flow back velocity within a critical range is an essential measure.
The objective of this study is to determine the critical flow back velocity under different confining pressures in the propped fractures of different thicknesses. This objective is achieved based experimental studies conducted in a specially designed apparatus.
For a fracture with a given width, the closure stress helps hold the proppant in place. This is due to the friction force that is proportional to the normal force created by the closure stress. The critical flow back velocity necessary to mobilize the proppant therefore increases with closure stress. However, the stress effect may be influenced by the shape of solid particles and friction coefficient of solid. Under the condition of constant closure stress, a narrow fracture holds proppant better than a wide fracture, resulting in increased critical flow
back velocity. This is interpreted to be due to the “tighter” packing of proppant in narrow fractures.
I.
Introduction
Numerous studies devoted to the loss of prop pant in the flow back process after hydraulic fracturing treatment have been published. Kerver and Graham (1964) discussed the use of concentrated viscous sodium silicate for retaining proppant in place after hydraulic fracturing. The treated proppant is consolidated in place and will not back-flow when the reservoir fluid is produced from the reservoir. Ely et al. (1990) presented their studies to discuss the use of forced closure technique combined with the use of high proppant concentration and fluid quality to control proppant flowback. They recommended high proppant concentrations and near-wellbore proppant packing in order to avoid proppant flow back. Milton-Tayler et al. (1992) conducted a laboratory study of factors affecting the stability of proppants in fractures. These factors include closure stress, rock hardness, proppant type and distribution. Almond et al. (1995) studied the effect of fluid pH and type, closure pressure during RCP curing, and downhole flow conditions on proppant flowback. Goel and Shah (1999) conducted an experiment to investigate proppant flowback by using a large scale fracturing simulator. Their experiments were performed in a slot which simulated a fracture. Their studies point out that the proppant-pack stability is highly dependent on fracturing parameters and reservoir closure stresses. Results from these experiments showed that the critical flowback rate decreases as the normal stress increases and as the fracture width increases. Parker et al. (1999) showed the generation
of flow channels as the critical flow velocity required to initiate prop pant flow back increases in a numerical prop pant-flow back model.
Guo et al. (2015) conducted an experiment to investigate the critical flow rate that will initiate proppant production during the flowback process. Their experiments were performed using a Hassler type core holder, which can hold a 2" diameter core sample up to 24" long and provide a confining pressure up to 7500 psi. The core sample was cut into two pieces and filled with proppant to simulate a fracture. Water was pumped into the core holder to simulate fracturing fluid flow back. The water flow rate was varied until the proppant pack destabilized, and sand production began. Results from their experiments showed that the critical flowback velocity increases with proppant size and closure pressure. This research comprised experimental investigations of the critical flowback velocity in simulated fractures in shale, filled with different fracture width sizes under varying confining pressure conditions. But the effect of fracture width on the critical flowback velocity was not investigated. This is done in our study and the result is presented in this paper.
II.
Experimental Investigations
Experimental Setup
Figure 1 presents a schematic of experimental setup for testing the critical flowback velocity. Critical flowback velocity was experimentally investigated using a Hassler type core holder, shown in Figure 2. The core holder can hold a 2" diameter
core sample up to 24" long. The core holder allows for applying a confining pressure up to 7,500 psi. With the core holder assembled and the sleeve in place a core sample is inserted. Inlet and outlet distribution plugs allow fluid to be circulated through a propped fracture in the core sample. A liquid pump can provide a flow rate up to 1700 ml/min.
Figure 1. Schematic Diagram of Flowback Testing Experimental System
Figure 2. A Hassler Type Core Holder used in the Experimental Investigation.
Experimental Materials
A cylindrical Barnett shale rock sample 2 inches in diameter and 6 inches in length was used in the experiments. The shale core sample was cut into two equal parts and proppant was placed between the two
pieces to simulate a “propped” fracture. Figure 3
illustrates a core sample ready for testing. Four
“fractured” core samples were joined together to
form a total length of 24 inches. Figure 4 depicts the
flow of fluid in the core holder.
Figure 3.“Fractured” Core Sample with Proppant Inserted.
Experimental Design
Three fracture thicknesses, 0.05 inch, 0.1 inch and 0.15 inch were used in the experiments. The proppant sample used was 40/70 mesh natural sand.
Table 1 shows the parameters calculated for the fracture in each core section:
Table 1. Parameter Values of Fracture and Proppant
Fracture height (in.) 2
Fracture length (in.) 6
Fracture surface area (ft2) 0.083
Weight of proppant (lb) 0.038
Proppant concentration (lb/ft2) 0.458
Width of fracture (in.) 0.05,0.1,
0.15
Cross-sectional area of
fracture (in2.)
0.1, 0.2,
0.3
The experiments were run on the 40/70 mesh sand at confining pressures ranging from 80 psi to 800 psi to simulate the effective stress in the sand pack. Water injection rate was varied from 0 ml/min to 1700 ml/min. Water and proppant were collected at the outlet and mass flow rate was calculated.
III.
Result
Figure 5 summarizes the experimental results for a 0.05 inch fracture at different confining pressures. It shows that the critical flowback velocity is not affected by the confining pressure. High confining pressure can hold proppant tighter and thus increase the critical flowback velocity.
0 100 200 300 400 500 600 700 800 900
0 50 100 150 200 250 300 350 400 Critical Flo w
back Velocity (
inch
/min
)
Confining Pressure (psi)
Figure 5. Effect of Confining Pressure on the Critical Flowback Velocity in a Fracture of 0.05 inch
Thickness
Figure 6 presents the experimental result for a fracture of thickness 0.1 inch. It shows that the critical flowback velocity is non-linearly affected by the confining pressure.
0 100 200 300 400 500 600 700 800 900
0 20 40 60 80 100 120 140 160 Critical Flo w
back Velocity (
inch
/min
)
Confining Pressure (psi)
Figure 6. Effect of Confining Pressure on the Critical Flowback Velocity in a Fracture of 0.1 inch
Thickness
Figure 7 presents the experimental results for a fracture with thickness of 0.15 inch. It shows that the critical flowback velocity is non-linearly affected by the confining pressure.
0 100 200 300 400 500 600 700 800 900 0 20 40 60 80 100 Critical Flo w back Velocit y (in ch/m in)
Confining Pressure (psi)
Figure 7. Effect of Confining Pressure on the Critical Flowback Velocity in a Fracture with a
Fracture Thickness of 0.15 inch.
A comparison for the critical flowback velocities
in fractures of three thickness can be seen in Figure
8. The critical flow velocities are 9.64 in/min, 3.66
0 100 200 300 400 500 600 700 800 900 0
50 100 150 200 250 300 350 400
Critical Flo
w
back Velocity (
inch
/min
)
Confining Pressure (psi)
Fracture Thickness = 0.05 inch Fracture Thickness = 0.10 inch Fracture Thickness = 0.15 inch
Figure 8. The Comparison between Three Different Thicknesses of Fractures.
IV.
Discussion
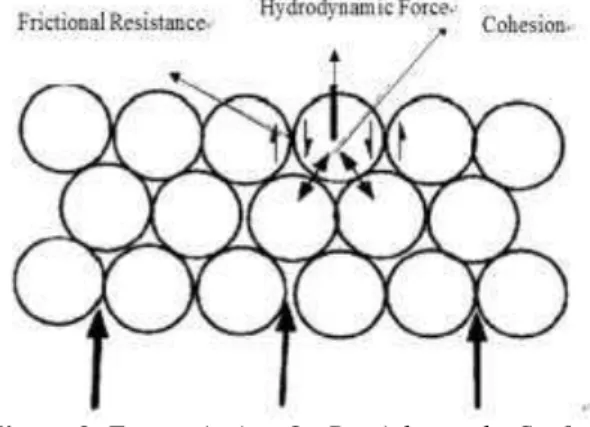
Stability of proppant pack is dominated by the balance between the driving hydrodynamic force, the gravitational force, and the resisting friction force (Pearson and Zazovsky, 1997). Previous studies have shown that the closure stress and hydrodynamic force are the two mechanisms that contribute to proppant flowback. Higher closure stresses increased the normal forces acting to extrude proppant grains out of the fracture. But our study shows that the closure stress hinders proppant flowback. As the confining pressure applied to the proppant through the core holder sleeve increased, the frictional force within the proppant grains also increased, which made the proppant pack more stable. The hydrodynamic force is resisted by frictional resistance and cohesion. This
is demonstrated in Figure 9.
Figure 9. Forces Acting On Particles at the Surface of the Perforation Tunnel (Pearson and Zazovsky,
1997)
The discrepancy between the results from this and previous study is explained as the difference in experimental materials. As interpreted by Guo et al.
the critical flow back velocity depending on friction coefficient. Closure pressure can squeeze the proppant out of the fracture if the friction coefficient is low. But it can hold the proppant in the fracture if the friction coefficient is high enough.
V.
Conclusions
An experimental investigation has been
conducted to study the critical flowback velocity in
hydraulic-fracturing shale gas wells. The following conclusions are drawn:
1. For a fracture with a given width, the closure
stress helps holding the proppant in place. This is due to the friction force that is proportional to the normal force created by the closure stress. The critical flowback velocity necessary to mobilize the proppant therefore increases with closure stress. However, the stress effect may be influenced by the shape of solid particles and friction coefficient of solid. More experiments with various types of proppant should be conducted to understand this effect.
2. Under the condition of constant closure stress, a
narrow fracture holds proppant better than a wide fracture, resulting in increased critical flowback velocity. This is interpreted to be due
the “tighter” packing of proppant in narrow
fractures.
VI.
Acknowledgements
This research was supported by the Louisiana Board of Regents Support Fund under contract No.
LEQSF (2013-16)-RD-B-05 for the project
“Experimental Investigations of Fracture Growth in
Unconventional Liquid-Rich Shale Plays.”
References
[1.] Almond, S.W., Penny, G.S., and Conway,
M.W. 1995. Factors Affecting Proppant Flowback with Resin Coated Proppants. Presented at SPE European Formation
Damage Conference, The Hague,
Netherlands, 15-16 May.
doi:10.2188/30096-MS
[2.] Ely, J. W., Holditch, S. A., and Arnold III,
W. T. 1990. New Techniques and Quality
Control Find Success in Enhancing
Productivity and Minimizing Proppant
Flowback. Paper presented at 65th Annual
Technical Conference and Exhibition, New
Orleans, Louisiana, 23-26 September.
doi:10.2118/20708-MS
[3.] Goel, N., and Shah, S. N. 1999.
Exhibition, Houston, Texas, 3-6 October. doi:10.2118/56880-MS
[4.] Guo, B., Song, J., and David, O. U. 2015.
An Experimental Investigation of the
Critical Flowback Velocity in
Hydraulic-Fracturing Shale Gas Wells.
Hydraulic Fracturing Journal, 19-25.
[5.] Kerver, J.K., Graham, J.W., 1964.
Hydraulic Fracturing Method. United States Patent 3,138,205A Filed Dec. 14, 1960.
[6.] Milton-Tayler, D., Stephenson, C., and
Asigan, M. I. 1992. Factors Affecting the Stability of Proppant in Propped Fractures: Results of a Laboratory Study. Presented at the Annual Conference and Exhibition,
Washington, D.C, 4-7 October.
doi:10.2118/24821-MS
[7.] Parker, M.,Weaver, J., Batenburg, V.D.,
1999. Understanding Proppant Flowback. Paper SPE 56726 presented at the 1999 SPE
Annual Technical Conference And
Exhibition, October 3-6 1999, Houston, Texas.