Braz. J. of Develop.,Curitiba, v. 6, n.5, p.30462-30478 may. 2020. ISSN 2525-8761
Effects of complementarity in time between wind and water resources on the
performance of a wind hydro hybrid system in northeastern Brazil
Efeitos da complementaridade no tempo entre os recursos eólicos e hídricos
no desempenho de um sistema híbrido eólico no nordeste do Brasil
DOI:10.34117/bjdv6n5-486
Recebimento dos originais: 25/04/2020 Aceitação para publicação: 25/05/2020
Evandro Eifler Neto
Engenheiro Ambiental, UFRGS
Instituição: Instituto de Pesquisas Hidráulicas, Universidade Federal do Rio Grande do Sul Endereço: Porto Alegre, Rio Grande do Sul/RS - Brazil
E-mail: evandro05@hotmail.com
José de Souza
Doutor em Engenharia, Fundação Liberato
Instituição: Instituto de Pesquisas Hidráulicas, Universidade Federal do Rio Grande do Sul Endereço: Rua Inconfidentes, 395 - Bairro Primavera - Novo Hamburgo/RS - Brazil
E-mail: josesouza@liberato.com.br
Alfonso Risso
Doutor em Sensoriamento Remoto e Geoprocessamento, UFRGS
Instituição: Instituto de Pesquisas Hidráulicas, Universidade Federal do Rio Grande do Sul Endereço: Porto Alegre, Rio Grande do Sul/RS - Brazil
E-mail: risso@iph.ufrgs.br
Elton Gimenez Rossini
Doutor em Engenharia, UFRGS
Instituição: Instituto de Pesquisas Hidráulicas, Universidade Federal do Rio Grande do Sul Engenharia de Energia, Universidade Estadual do Rio Grande do Sul
Endereço: Porto Alegre, Rio Grande do Sul/RS - Brazil E-mail: elton-rossini@uergs.edu.br
Alexandre Beluco
Doutor em Engenharia, UFRGS
Instituição: Instituto de Pesquisas Hidráulicas, Universidade Federal do Rio Grande do Sul Endereço: Porto Alegre, Rio Grande do Sul/RS - Brazil
Braz. J. of Develop.,Curitiba, v. 6, n.5, p.30462-30478 may. 2020. ISSN 2525-8761
ABSTRACT
The world is in a time when the energy resources have been under increasing pressure from a growing demand with higher quality requirements. At the same time, our world, largely based on non-renewables, see these resources approaching scarcity. In this context, it is important to get energy supplies from renewable resources and seek ways to leverage these resources as well as possible. The complementarity between energy resources can be a way to make better use of available resources, enabling a greater supply of energy and facilitating the management of devices for energy storage. This paper presents preliminary results of the identification of complementarity between water and wind resources in a portion of northeastern Brazil. Further, this paper presents simulation results for a hydro wind hybrid system showing the effects of complementarity. Located on a site with resources without complementarity, the insertion of an artificial lag in the data shows how the system would be feasible. The effects of complementarity for the benefit of the feasibility of a hybrid system will prove more effective in conditions of scarce energy resources. In smaller systems, can be taken into account complementarity in time. In larger systems, may also be considered complementarity in space.
Keywords: Energetic complementarity, wind energy resource, hydro energy resource, wind
hydro hybrid system, software Homer, northeastern Brazil.
RESUMO
O mundo está em um momento em que os recursos energéticos estão sob crescente pressão de uma demanda crescente com requisitos de qualidade mais altos. Ao mesmo tempo, nosso mundo, amplamente baseado em fontes não renováveis, vê esses recursos se aproximando da escassez. Nesse contexto, é importante obter suprimentos de energia a partir de recursos renováveis e buscar formas de alavancar esses recursos da melhor maneira possível. A complementaridade entre os recursos energéticos pode ser uma maneira de aproveitar melhor os recursos disponíveis, possibilitando um maior suprimento de energia e facilitando o gerenciamento de dispositivos para armazenamento de energia. Este artigo apresenta resultados preliminares da identificação de complementaridade entre recursos hídricos e eólicos em uma porção do nordeste do Brasil. Além disso, este trabalho apresenta resultados de simulação para um sistema híbrido de energia eólica, mostrando os efeitos da complementaridade. Localizada em um site com recursos sem complementaridade, a inserção de um atraso artificial nos dados mostra como o sistema seria viável. Os efeitos da complementaridade em benefício da viabilidade de um sistema híbrido serão mais eficazes em condições de escassos recursos energéticos. Em sistemas menores, pode ser levado em consideração a complementaridade no tempo. Em sistemas maiores, também pode ser considerado complementaridade no espaço.
Palavras-chave: Complementaridade energética, recurso de energia eólica, recurso de energia
hidrelétrica, sistema híbrido de energia eólica, software Homer, nordeste do Brasil.
1 INTRODUCTION
The world is in a time when the primary resources, especially energy resources, have been under increasing pressure from a growing demand with higher quality requirements. At the same
Braz. J. of Develop.,Curitiba, v. 6, n.5, p.30462-30478 may. 2020. ISSN 2525-8761 time, our modern world, largely based on non-renewable resources, see these resources approaching scarcity. A context that will evolve into a framework of increasing costs.
In this context, it is important to get energy supplies from renewable resources and seek ways to leverage these resources as well as possible. Impose more discipline on the rational use of energy, enabling power supplies with better efficiency, reduce losses from transmission and distribution of energy are some of the measures that are required. In the case of Brazil, a country trying to engage an up growth in various sectors for many years, finds difficulties in this endeavor. [1] One of bounds for economic growth is a power supply that is smaller than would be required.
The complementarity between energy resources [2]-[3] can be a way to make better use of available resources, enabling a greater supply of energy and facilitating the management of devices for energy storage. Reference [4] proposed a dimensionless index to evaluate the complementarity between energy resources in time. Reference [5] proposed a method for performance analysis of hybrid systems based on complementary resources. This method is based on the use of available energy idealized curves for the determination of performance of hybrid systems. This performance will be considered as an upper limit of performance for hybrid systems. Reference [6] applies this method to relate the performance of hybrid systems with complementary index.
This paper presents preliminary results of the identification of complementarity between water and wind resources in a portion of northeastern Brazil. Data from water and wind resources were manipulated to determine values for complementarity in time and indicate places where hybrid systems could be designed based on this complementarity. Further, this paper presents simulation results for a hydro wind hybrid system showing the effects of complementarity. Some initial simulations were performed, for a survey of the behavior of solutions, with data from some sites and this paper presents the results obtained specifically for a site without complementarity.
2 ENERGETIC COMPLEMENTARITY
Complementarity between energy resources may occur in space and time. Energetic complementarity in time may occur when the energy availability of two or more energy resources present periods of availability which are complementary over time in the same region. When a resource is more abundant, the other is near its minimum availability. When at another time of the year the first approaches its minimum, the second shows higher availability.
Braz. J. of Develop.,Curitiba, v. 6, n.5, p.30462-30478 may. 2020. ISSN 2525-8761 Energy resources may be considered perfectly complementary if the variation of the availability values presents equal periodicity and their respective maximum and minimum values occur in time intervals half a period apart (out of phase). Furthermore, the average availability of energy resources should be the same as well as the relation between the respective maximum and minimum values of availability of the two sources. The values of energy supplied by generators in a hybrid system may also be considered complementary in time even when the values of availability are not completely complementary. So, the availabilities may present an imperfect complementarity and the generators may be sized to supply energy values which have the same average values along the period. Obviously this is possible only if the available energy values are greater than the energy demand.
Reference [5] proposed a method for quantifying the complementarity through a dimensionless index. The proposed index considers complementarity in a comprehensive manner, while in this work will be considered only complementarity in time. This ratio quantifies the time interval between weeks or months in which occurs the minimum availability of energy resources considered. In fact, this index provides values between 0 and 1 for this time interval.
The index of complementarity in time, t, is defined [4] by equation (1) and evaluates the time interval between the minimum values of availability of the two sources of energy considered in the evaluation. If this interval is exactly half the period, the index will be equal to one. If the interval is null that is, if the availability minima coincide, the index will be equal to zero. Intermediate values are linearly related.
𝜅𝑡 =
|𝑑ℎ−𝑑𝑤|
√|𝐷ℎ−𝑑ℎ||𝐷𝑤−𝑑𝑤|
(Eq.1)
Equation (1) was written considering the energy resources of this article. Thus, Dh is the number of the day of maximum value of hydraulic energy availability, dh is the number of the day of minimum value of hydraulic energy availability, Dw is the number of the day of maximum value of wind energy availability and dw is the number of the day of minimum value of wind energy availability. This expression may be rewritten as equation (2) supposing that the respective (D-d) differences are equal to half a year which is more practical for estimates.
Braz. J. of Develop.,Curitiba, v. 6, n.5, p.30462-30478 may. 2020. ISSN 2525-8761 𝜅𝑡 =|𝑑ℎ−𝑑𝑤| √180⋅180 = |𝑑ℎ−𝑑𝑤| 180 (Eq. 2)
3 COMPLEMENTARITY BETWEEN WIND AND HYDRO RESOURCES IN NORTHEASTERN BRAZIL
The determination of a map of complementarity was performed in a simplified way, from data bases of open access. The flow data were obtained from the database HydroWeb [7], provided by the National Water Agency (Agência Nacional de Águas, ANA), maintained by the Brazilian government. The wind velocity data were obtained from the database Merra [8], The Modern Era Retrospective-Analysis for Research and Applications, provided by NASA.
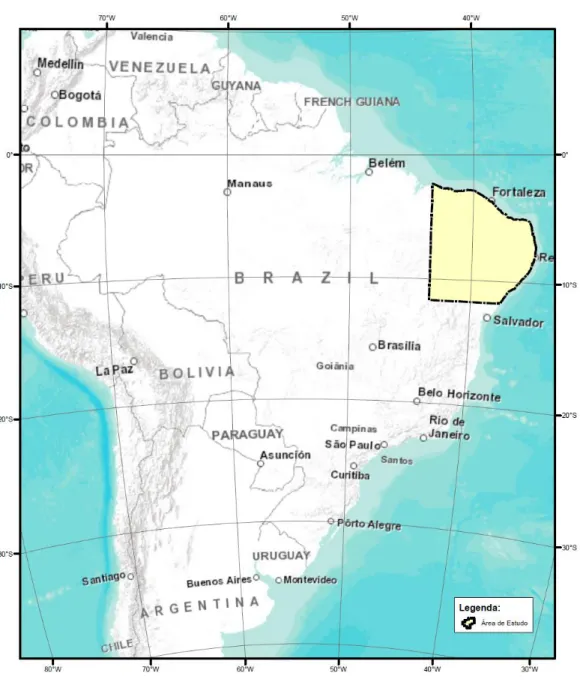
In this study, data from 44 streamflow stations along a portion of the northeast region of Brazil, which is shown in Figure 1, were used. The positions are indicated in Figure 2. Os postos estão localizados nos Estados da Bahia[9], Sergipe[10], Alagoas[11], Pernambuco[12], Paraíba[13], Rio Grande do Norte[14] and Ceará[15].
Braz. J. of Develop.,Curitiba, v. 6, n.5, p.30462-30478 may. 2020. ISSN 2525-8761
Braz. J. of Develop.,Curitiba, v. 6, n.5, p.30462-30478 may. 2020. ISSN 2525-8761
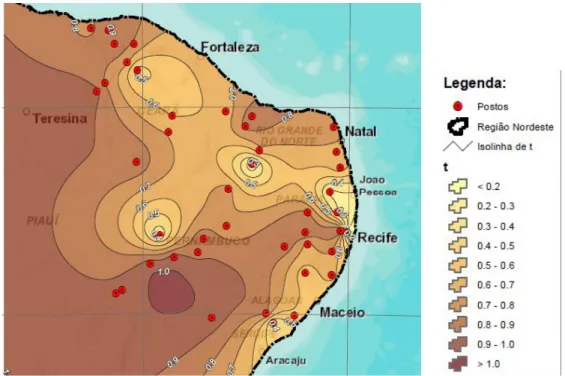
Figure 2. Index of complementarity in time of the study area.
Wind speed data for those points over the same time periods were obtained. The data sets are then converted into twelve monthly data series. These series were also normalized, with resulting curves having the same amplitudes. This transformation aims to facilitate comparisons of the flow and wind data, with the determination of separation in months between the months of maximum availability. Comparing these curves it was possible to determine the values of the index of complementarity in time.
The map of complementarity was built through a mesh interpolation data obtained by the Kriging method, using the software Surfer [16]. After interpolation, contours were obtained, which were imported into ArcGIS [17], used for the finishing of the map. The contours were overlaid with a mask of northeastern Brazil, inserted to delimit the region of interest and minimize the effects of extrapolation. The area of study is completed by an image in different color tones, according to the scale shown. The result, shown in Figure 2, has lines to a level of index values into ten intervals of 0.10.
The map shows approximately 40% of the region considered in the study with complementarities above 0.9. This corresponds high delays between the maximum values of energy availability. The southernmost part is where there are the highest values, followed by the west side of the map. References [18]-[19] present the results obtained from the determination of all the indices proposed by Beluco et al. [4] for the portion of northeastern Brazil considered in this study.
Braz. J. of Develop.,Curitiba, v. 6, n.5, p.30462-30478 may. 2020. ISSN 2525-8761
4 A SYSTEM WITH FULL WIND AND HYDRO COMPLEMENTARITY IN TIME
In the area that was considered in this study, a site with water and wind resources with no complementarity was chosen. The site is located in Juazeiro[20], State of Bahia, with wind data obtained from station Sonda, in Petrolina[21], State of Pernambuco, and flow data obtained from
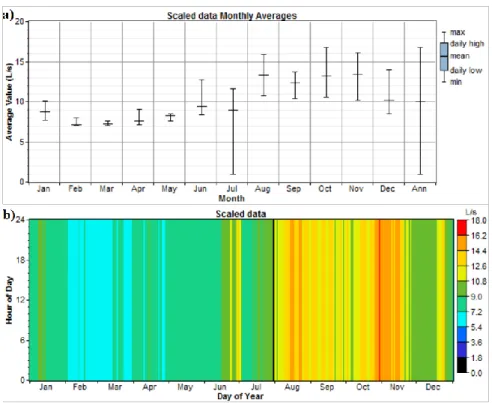
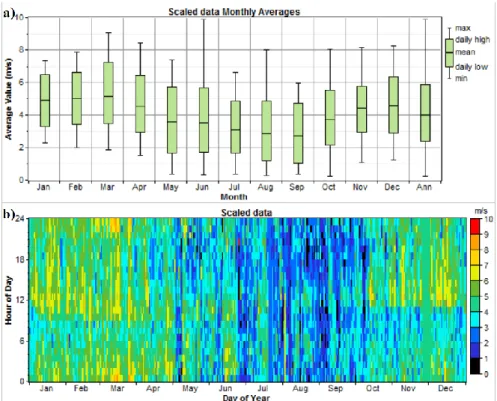
station Juazeiro, in Juazeiro. Figure 3 and Figure 4 show two graphs each. Figure 3 is the flow data, and Figure 4 the wind data. The first graph in both figures shows the monthly mean values, as well as the maximum and minimum values. The second graph shows the variations in flow and wind speed for every day of the year.
Figure 3. a) Monthly average, monthly max. and monthly min. stream flow; b) Annual hourly variation of stream flow.
Braz. J. of Develop.,Curitiba, v. 6, n.5, p.30462-30478 may. 2020. ISSN 2525-8761
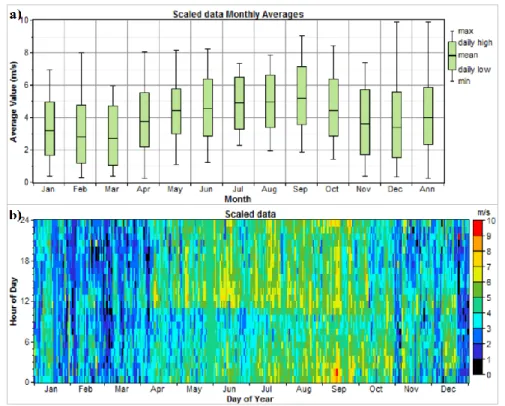
Figure 4. a) Monthly average, monthly maximum and monthly minimum wind velocity; b) Annual hourly variation of wind velocity.
The site of the generation system is located on the map of Figure 2 exactly in the area where the index of complementarity takes values close to zero. At the same time, it is observed that the minimum for both flow data and for wind data are between the months of February and March. Thus, so complementarity is close to zero.
5 SIMULATONS WITH HOMER
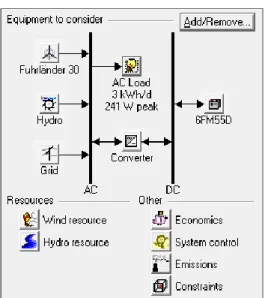
The software Homer [22], The Micropower Optimization Model, was developed by the National Renewable Energy Laboratory (NREL) in the United States, and is available for universal access in version 2.68 beta. The program [23]-[24] simulates a power generating system during the period of time considered in this study, usually 20 or 25 years at 60 minute intervals, with the results presented for a period of one year. The simulations were performed for a period of operation of 25 years, with 12% and 6% annual interest rate of return. It was established for the project that different generators could operate simultaneously and in parallel. The hybrid system considered in the simulations is represented schematically in Figure 5. It is a wind hydro hybrid system with the possibility of energy storage in batteries and the possibility of buying and selling power to the grid system.
Braz. J. of Develop.,Curitiba, v. 6, n.5, p.30462-30478 may. 2020. ISSN 2525-8761
Figure 5. Wind hydro hybrid system.
The system includes a bus in alternating current (AC) and the other in direct current (DC), receiving supplies of hydro and wind generators. The electrical load is connected to the AC bus and battery bank to the DC bus. The flow of energy in both directions between the two buses made possible by the converter device. The simulations were performed for the following values of the variables of optimization: 0, 2, 4, 8 and 12 wind turbines; 0, 4, 8, 12, 16 and 20 batteries; 0 kW, 20 kW and 40 kW for the converter; 0 kW, 100 kW and 200 kW for the purchasing power of the network.
For variables of sensitivity, simulations were performed for the following values: 2 m/s, 2.25 m/s, 2.5 m/s, 2.75 m/s, 3 m/s, 3.25 m/s, 3.5 m/s, 3.75 m/s, 4 m/s, 4.25 m/s, 4.5 m/s, 4.75 m/s, 5 m/s, 5.25 m/s, 5.5 m/s, 5.75 m/s, 6 m/s, 6.25 m/s, 6.5 m/s, 6.75 m/s and 7 m/s for the average annual wind speed; 0 L/s, 2.5 L/s, 5 L/s, 7.5 L/s, 10 L/s, 12.5 L/s, 15 L/s, 17.5 L/s, 20 L/s, 22.5 L/s, 25 L/s, 27.5 L/s, 30 L/s, 32.5 L/s, 35 L/s, 37.5 L/s, 40 L/s, 42.5 L/s, 45 L/s, 47.5 L/s and 50 L/s for the mean annual stream flow.
A set of 360 simulations, for 1764different values of the variables of sensitivity, were performed. The operation was completed after a total time of about 160 minutes. The results are presented and discussed in the next chapter. Simulations were first performed for the data shown in Figure 3 and Figure 4. In a second step, simulations were performed with the data in Figure 3 and the data in Figure 6. Thus, the data in Figure 3 and Figure 4 show complementarity zero, while the data in Figure 3 and Figure 6 show maximum complementarity.
Braz. J. of Develop.,Curitiba, v. 6, n.5, p.30462-30478 may. 2020. ISSN 2525-8761
Figure 6. a) Monthly average, monthly maximum and monthly minimum wind velocity; b) annual hourly variation of wind velocity, both with artificial lag of 180 days.
Figure 6 also shows two graphs with wind data. The first graph shows the monthly mean values, as well as the maximum and minimum values. The second graph shows the variations in flow and wind speed for every day of the year. This figure was obtained with a delay of 180 days in the data set of Figure 4.
The hydroelectric plant was quoted at US$ 2,000 per kW installed. The hydroelectric plant harnesses gap 100 meters with pipe 300 meters long, 200 mm in diameter. Wind turbines, Fuhrlander AG, rated at 30kW, were priced at US$ 3,000 per kW installed. The wind turbine tower is 30 meters tall, with rotor diameters of 13 meters. The lifetime of the hydropower plant is estimated at 25 years, while the wind turbine is estimated at 15 years. The converter includes in a single device the functions of inverter and rectifier. He can play both with 100% capacity and 85% efficiency. Their lifespan is estimated at 12.5 years. The power installed in this device must be carefully evaluated, because the software can suggest a very high power to be employed in a few times during the year when there minimum availability of energy resources.
The batteries that were adopted in the simulation are 6FM55D, which is included in the software and has very similar characteristics to the batteries available in the Brazilian market. These are automotive and were approved by their market availability and low cost. The battery operates at 12V, with a nominal capacity of 55 Ah, equivalent to 0.66 kWh. The hybrid system
Braz. J. of Develop.,Curitiba, v. 6, n.5, p.30462-30478 may. 2020. ISSN 2525-8761 of this project will use batteries in connections such that the bank voltage is 24V. The acquisition cost is considered US$ 100, with replacement cost of US$ 90. All financial costs involving the simulated system were adopted based on current values.
The electrical demand considered in the simulations is equal to an average value of about 100 kW throughout the day. Thus, it is 2,980 kWh/d with an average consumption of 124 kW and a peak of 241 kW consumption. The connection to the energy system is considered at the cost of US$ 0.15 per kWh, at a cost of US$ 0.06 per kW for hiring demand, as is usual for residential consumers. The sale of energy to the system happens to the value of $ 0.075 per kWh. There is not charging different rates for consumption during peak hours for residential consumers.
6 RESULTS AND DISCUSSION
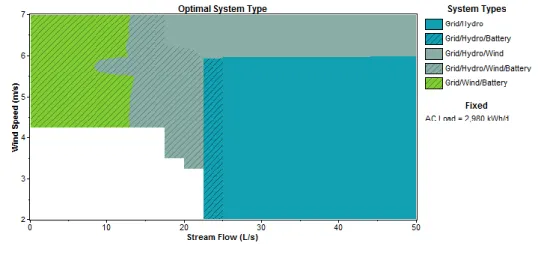
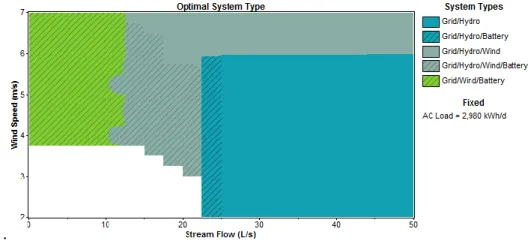
Figure 7 shows the optimal combinations for the components of the hybrid system of Figure 5 for the data of Figure 3 and 4. Figure 8 shows the optimal combinations for the data of Figure 3 and 6. In both figures, the optimal combinations include energy purchase from the grid, required to enable the solutions. The other combinations depend on the quantity of available water and wind. If there is more water and less wind, some combinations do not include wind turbines. Similarly, if there is less water and more wind, some combinations do not include hydro component. The white areas represent non-viable systems. Of course, the blank area in Figure 7 is greater than in Figure 8. The best complementarity between energy resources led to the feasibility of a larger number of combinations of components of the hybrid system.
Braz. J. of Develop.,Curitiba, v. 6, n.5, p.30462-30478 may. 2020. ISSN 2525-8761
Figure 8. Optimal combinations of components of the hybrid system for the data in Figure 3 and Figure 6.
.
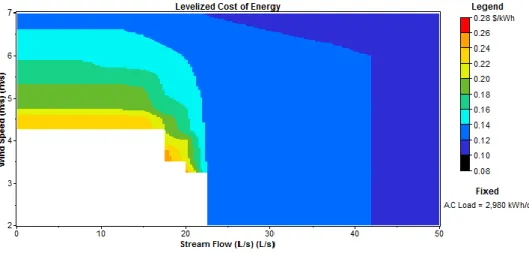
The hatching area irrespective of colors and their combinations of components of the hybrid system, it indicates the inclusion of batteries. The accumulation of energy in batteries allows a certain capacity for energy supply at peak demand without requiring elevation of installed power. Better complementarity reduces dashed area because generating equipment can meet demand even in peak times. For certain demands or number of consumers with limited funds to invest, the map of complementarity can suggest better complementarity regions where the same installed power can result in better energy supplies. Figure 9 shows the cost of energy to the results of Figure 7. Figure 10 shows the energy cost for the results of Figure 8. The total investment cost is reduced about 5% with the delay imposed on the data. These cost reductions should be higher for systems with higher installed power. However, it is observed in Figure 9 and Figure 10 that there is a small increase in the cost of energy in a portion of the results. In general, for smaller systems with regional service capacity, complementarity should be considered from the point of view of time, as in this work, to be applied within the system in question. For higher power systems, complementarity can also be viewed spatially, contributing to the overall energy system.
Braz. J. of Develop.,Curitiba, v. 6, n.5, p.30462-30478 may. 2020. ISSN 2525-8761
Figure 9. Cost of energy of the hybrid system for the data in Figure 3 and Figure 4.
Figure 10. Cost of energy of the hybrid system for the data in Figure 3 and Figure 6.
The data used in the simulations have average flow of 10 L/s and average wind speed of 4 m/s. For these data, Figure 8 shows viable solution. This solution includes wind turbines, connecting to the system and energy storage in batteries. To these data, there was no viable solution in Figure 7. Simulations suggest a solution with 12 wind turbines, a bank with 64 batteries and a connection to the system with 200 kW capacity.
This study aimed to contribute to a better understanding of the effects of complementarity. A design for an energy system with the characteristics considered in this study will certainly have to meet a demand much smaller, since in this study the demand was raised to high values precisely to evaluate the effects of complementarity.
Braz. J. of Develop.,Curitiba, v. 6, n.5, p.30462-30478 may. 2020. ISSN 2525-8761
7 CONCLUSION
This paper presented preliminary results of the identification of complementarity between water and wind resources in a portion of northeastern Brazil. A map of complementarity in time was presented, in which more than 40% of the region studied had high levels of complementarity.
Further, this paper presented simulation results for a hydro wind hybrid system showing the effects of complementarity. The site considered in the study, with the equipment considered in the simulations, did not allow a viable solution. Data on water and wind resources for this site exhibit null complementarity.
The simulations showed that a delay inserted artificially in wind speed data, leading to an almost complete complementarity between energy resources, enabled a combination of components of the hybrid system which achieved economic feasibility.
Studies on energy complementarity will continue, seeking more information about the effects of complementarity in real systems, the complementarity between other resources and their influence on hybrid systems of various sizes.
ACKNOWLEDGEMENTS
This work was developed as a part of research activities on renewable energy developed at the Instituto de Pesquisas Hidráulicas, Universidade Federal do Rio Grande do Sul. The authors acknowledge the support received by the institution.
REFERÊNCIAS
[1] MercoPress South Atlantic News Agency, 2013. Brazil’s growth potential limited by structural distortions. Available at en.mercopress.com/2006/11/24/brazil-s-growth-potential-limited-by-structural-distortions on November 24, 2006. Accessed on May 27, 2013.
[2] Beluco, A. Souza, P.K. Livi, F.P. Caux, J. 2015. Chapter 7: Energetic complementarity [of solar energy] with hy7dropower and the possibility of storage in batteries and water reservoirs. In: Sørensen, B. Solar Energy Storage, Academic Press, pp.155-188. ISBN 978-0-12-409540-3.
[3] Jurasz, J.K. canales, F.A. Kies, A. Guezgouz, M. Beluco, A. 2020. A review on the complementarity of energy sources: concept, metrics, application and future research directions. Solar Energy, 195:703-724.
Braz. J. of Develop.,Curitiba, v. 6, n.5, p.30462-30478 may. 2020. ISSN 2525-8761 [4] Beluco, A. Souza, P.K. Krenzinger, A. 2008. A dimensionless índex evaluating the time complementarity between hydraulic and solar energies. Renewable Energy, 33:2157-2165.
[5] Beluco, A. Souza, P.K. Krenzinger, A. 2012. A method to evaluate the effect of complementarity in time between hydro and solar energy on the performance of hybrid hydro PV generating plants. Renewable Energy, 45:24-30.
[6] Beluco, A. Souza, P.K. Krenzinger, A. 2013. Influence of different degrees of complementarity between hydro and solar energy on the performance of hybrid hydro PV generating plants. Energy and Power Engineering, 4(5):332-342.
[7] ANA (2012) HidroWeb. Available at www.hidroweb.ana.gov.br. Accessed on December 10, 2012.
[8] NASA (2012) MERRA. Available at www.gmao.gsfc.nasa.gov/merra/. Accessed on December 10, 2012. [9] http://goo.gl/maps/KBX91. [10] http://goo.gl/maps/C94lj. [11] http://goo.gl/maps/sJ3nE. [12] http://goo.gl/maps/KcBvn. [13] http://goo.gl/maps/jTfPU. [14] http://goo.gl/maps/7KdUL. [15] http://goo.gl/maps/WYxdP.
[16] Golden Software, 2002. Surfer, version 8. Golden, Colorado, USA.
[17] ESRI, 2010. ArcGIS, version 10. Redlans, Califórnia, USA.
[18] Eifler Neto, E. 2012. Study on the complementarity of hydro and wind in northeastern Brazil (in portuguese), Graduation Work in Environmental Engineering, IPH-UFRGS.
[19] Eifler Neto, E. Risso, A. Beluco, A. 2014. Complementarity in time between wind and water resources in northeastern Brazil. international Journal of Environmental Engineering and Natural Resources, 1(1):13-18.
[20] http://goo.gl/maps/p2fcG.
[21] http://goo.gl/maps/ufy5k.
[22] Homerenergy, 2009. Software HOMER, version 2.68 beta, The Micropower Opyimization Model, Homer Energy. Available at www.homerenergy.com.
Braz. J. of Develop.,Curitiba, v. 6, n.5, p.30462-30478 may. 2020. ISSN 2525-8761 [23] Lambert, T.W. Gilman, P. Lilienthal, P.D. 2005. Micropower system modeling with Homer. In: Farret, F.A. Simões, M.G. Integration of Alternative Sources of Energy, John Wiley & Sons, pp.379-418. ISBN 0471712329.
[24] Lilienthal, P.D. Lambert, T.W. Gilman, P. 2004. Computer modeling of renewable power systems. In: Cleveland, C.J. (ed.) Encyclopedia of Energy, Elsevier, v.1, pp.633-647. NREL Report CH-710-36771.