Healthy life expectancy in Brazil:
applying the Sullivan method
Expectativa de vida saudável no Brasil:
uma aplicação do método de Sullivan
1 Centro de Informação Científica e Tecnológica, Fundação Oswaldo Cruz, Rio de Janeiro, Brasil. 2 Escola Nacional de Saúde Pública Sergio Arouca, Fundação Oswaldo Cruz, Rio de Janeiro, Brasil.
Correspondence D. E. Romero Departamento de Informações em Saúde, Centro de Informação Científica e Tecnológica, Fundação Oswaldo Cruz. Av. Brasil 4365, Rio de Janeiro, RJ 21045-900, Brasil. [email protected]
Dalia Elena Romero 1 Iúri da Costa Leite 2
Célia Landmann Szwarcwald 1
Abstract
The objective of this study is to present the method proposed by Sullivan and to estimate the healthy life expectancy using different mea-sures of state of health, based on information from the World Health Surveycarried out in Brazil in 2003. By combining information on mortality and morbidity into a unique indica-tor, simple to calculate and easy to interpret, the Sullivan method is currently the one most com-monly used for estimating healthy life expectan-cy. The results show higher number of healthy years lost if there is a long-term disease or dis-ability that limits daily activities, regardless of the difficulty in performing such activities or the severity of the functional limitations. The two measures of healthy life expectancy adjust-ed by the severity of functional limitation show results very similar to estimates based on the perception of state of health, especially in ad-vanced age. It was also observed, for all mea-sures used, that the proportion of healthy years lost increases significantly with age and that, al-though females have higher life expectancy than males, they live proportionally less years in good health.
Chronic Diseases; Health Status; Life Expectan-cy; Years of Lost Life
Introduction
Classically, mortality indicators have been uti-lized to evaluate the general state of health of a population. These indicators highlight life ex-pectancy, which, because it is not influenced by a population’s age structure, has been used to compare the health state between popula-tions and also to monitor the impact of differ-ent intervdiffer-entions in the health area 1.
The increase in life expectancy is not only a characteristic of developed countries, having also shown significant increased in developing coun-tries, especially in the second half of the 20th cen-tury 2. According to estimates by the United Na-tions 3, between 1950 and 2000, Latin America witnessed an increase of approximately 14 years in life expectancy from birth, rising from 51.6 years to 65.4 years for both sexes. A similar gain is observed in Brazil where the life expectancy rose from 51 years to 69.4 years during the same time-frame. Demographic projections foresee the con-tinuation of this process, estimating a life ex-pectancy in Brazil around 77.4 years in 2030 3.
Recent studies on longevity and health con-cluded that the positive tendencies of pro-longed life were not accompanied by similar trends in the extension of healthy life; in other words, a long life does not necessarily mean a healthy life 5,6,7. On the contrary, with increased life expectancy, the proportion of years of life with degenerative chronic diseases, disabili-ties and socioeconomic disadvantages also in-creased 8,9. Advancement in the technologies for saving lives and providing more efficient medical care resulted in the paradoxical in-crease in the prevalence of chronic diseases, as Gruenberg named 10, “the failure of success”.
It is thus arguable that mortality measure-ments alone are insufficient to adequately eval-uate state of health, quality of life in a popula-tion, or the comparative impact of medical in-terventions. In the last four decades, great ef-fort has been spent to develop synthetic health measures that consider, besides the effect of mortality, morbidity, limitations and disabili-ties, as well as concepts relative to the well-be-ing and the quality of life of a population 2,11,12. The first method to combine morbidity and mortality information was proposed by Sanders 13and later developed by Sullivan 14.
The key measures of the Sullivan method have been called healthy life expectancy, active life expectancy or life expectancy free of dis-ability, depending on the selected information to measure the state of health. Due to its sim-plicity, the Sullivan method has been used to estimate healthy life expectancy in various countries 11,15,16, especially the developed ones, as well as for monitoring health changes and differences in the European countries. In Brazil it was employed to calculate healthy life ex-pectancy using the SABE (Saúde, Bem-estar e Envelhecimento; Health, Well-Being, and Ag-ing) research database, which is restricted to the elderly in the city of São Paulo 17.
The objective of this study is to introduce Sullivan’s technique and estimate healthy life expectancy in Brazil using different ways of measuring state of health, based on informa-tion from the Pesquisa Mundial de Saúde(World Health Survey– WHS), carried out in 2003 on a national scale.
Methods and materials
The Sullivan method
The information necessary for applying the Sullivan method are: (1) population and deaths or specific mortality rates that permit the
con-struction of a life table; (2) prevalence of health states according to age.
In the present study, the morbidity infor-mation used in applying the Sullivan method comes from the WHS that was carried out in Brazil in 2003. This research is part of a larger project from the World Health Organization ( WHO), in which many other member coun-tries where included.
The WHS sample was comprised of 5,000 Brazilians over the age of 18, selected, proba-bilistically, in 250 census sectors, in 188 munici-palities located in the 25 states of the federation. The sampled population corresponded to the set of private residences in Brazil except for the ones located in rural areas of northern region, in the states of Acre and Roraima, and in special census sectors (military bases, lodgings, en-campments, boats, penitentiaries, asylums, or-phanages, convents, or hospitals) 18.
Specific mortality rates by age and sex were provided by the Departamento de População e Indicadores Sociais, Instituto Brasileiro de Geo-grafia e Estatística (DEPIS, Department of Pop-ulation and Social Indicators; IBGE, Brazilian Institute of Geography and Statistics).
The healthy life expectancy or expectancy of a life free of disability, proposed by Sullivan, is calculated using an adaptation of the tradi-tional life table. The expectancy of healthy life thus reflects the state of health of a determined population adjusted by the level of mortality and, as in a life table, it is not affected by the age structure of a population. In the present study, healthy life expectancies were estimated according to sex, since health states vary con-siderably between genders, especially at more advanced ages 19,20,21.
The healthy life expectancy (e’x ) is calculat-ed in the following manner:
e’x = 1
Σ
wx (1 - nπx)nLx (1), where: lx
lxis the number of survivors at the exact age x; nπxrepresents the prevalence of a determined state of health among individuals with ages in the interval (x, x + n); nLxis the total number of years lived by a cohort in the age group (x, x + n); wrepresents the largest age category.
Indicators of healthy life
Since the Sullivan method depends on how one measures healthiness, the present study em-ploys four distinct estimates of healthy life ex-pectancy covering several dimensions of mor-bidity: self-rated health, presence of long-term disease or disability, and functional limita-tions.
The first method refers to the individual self-rated health obtained with the following question: “In general, how would you rate your health today?”. There are five possible answers (very good, good, moderate, bad, very bad), which have been dichotomized such that the answers “very bad” and “bad” constitute the category “poor self-rated health”, and the other answers compose “good self-rated health”. In this case, the specific rate by age of being healthy was established by the proportion of individu-als with a good perception of health state in each quinquennial age group.
The second measure is based on the pres-ence of a long-term disease or disability that limits the one’s daily activities, and is ascer-tained with the following two questions: “do you have any long-term illness or disability?” and “does the illness or disability limit in any way your daily activities?”. For this estimate, the state of having a long-term disease or dis-ability that limits daily activities was used to identify an unhealthy life and the specific rate
by age was established by the proportion of in-dividuals with a long-term disease or disability in each age group.
Differently from the first two estimates, where being healthy is defined by a dichotomous variable, the third estimate takes into consid-eration the continuum of the severity of func-tional limitations. For such, this study consid-ered the approach proposed by the WHO in the International Classification of Functionality, Disability and Health(ICF) 22, in which the lim-itations of activities and functionality are not only viewed as a consequence of illnesses but principally as important components in an in-dividual’s health. So as to obtain a measure-ment of the severity of functional limitations on a continuous scale, the present study first made use of a factorial analysis of principal components, which was applied to the five lev-els of difficulty (none, mild, moderate, severe, extreme) in performing daily activities (profes-sional and personal, self-care, locomotion, learning, and application of knowledge) and limitation and deficiencies of the body’s tions and structure (sensory and mental func-tions), as shown in Table 1. Using the scores in the first principal component, a scale from 0 to 1 was thus constructed so that 1 is equivalent to the greatest degree of severity and 0 corre-sponds to a healthy life (without limitations). In this manner, the specific rate by age of be-ing healthy is given by the complement of the
Table 1
Indicators, defined by the International Classification of Deficiencies, Functionality, and Disabilities in Health22,
employed to estimate the second the measure of healthy life.
Components Domains (chapters) Categories Questions from WHS
Activity limitations 6. Domestic life Doing housework (d640) q2001 – degree of hardship
with domestic tasks or activities?
4. Mobility Walking short distances (d4500) q2010 – degree of hardship
with locomotion?
5. Self-care Dressing (d540) q2020 – degree of hardship in caring
for oneself, such as washing and dressing?
q2021 – degree of hardship in caring for oneself, such as maintaining a proper and clean appearance?
1. Learning and applying Acquire skills, unspecific (d1559) q2051 – degree of hardship
knowledge in learning a new task?
Limitations and deficiencies 2. Sensory functions Sensation of pain (b280) q2030 – degree of pain felt in body?
in function and body structure and pain q2031 – degree of physical illness felt?
1. Mental functions Attention functions (b140) q2050 – degree of hardship
arithmetic average of the scale’s values by age group.
The final method used for measuring state of health is a proposed extension of the Sullivan method, which allows more than one healthy life-defining event to be used simultaneously. In addition, a weight is attributed to each event, establishing the degree of its severity. To illustrate the method, three events were con-sidered: (1) does not have long-term disease or disability; (2) has a long-term disease or dis-ability that does not limit daily activities; and (3) has a long-term disease or disability that limits daily activities. The weights which char-acterize the degree of severity in each situation were calculated by age group, as the arithmetic mean of the scores of functional limitations in a scale varying from 0 to 1, obtained from fac-tor analysis.
Applying the method
In this study, the life table used to illustrate the Sullivan method’s calculation has been sum-marized in quinquennial age groups, begin-ning at twenty years of age, since the
informa-tion from the WHS refers to individuals 18 years or older. Use of the summarized life table is recommended in studies of this type, since prevalence rates of age-specific health events, obtained through research samples, are too small to be used with simple ages 21.
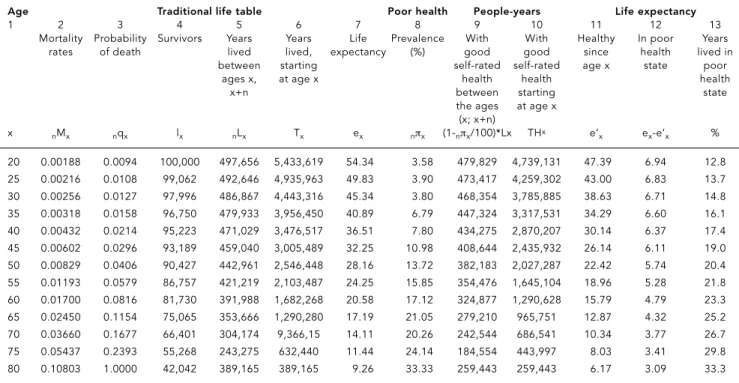
Table 2 shows the application of the Sulli-van method, taking into consideration the pro-portion of individuals in each quinquennial age group with a self-rated health that is not poor (very good, good, moderate) as the specif-ic rate by age of being healthy. The first column represents the age group ’s lower limit, in which the amplitude always equals five, except for the last group in which the interval is right open. The five following columns show the functions of a summarized mortality table, necessary for the calculation of life expectancy.
In the second column are the specific rates of mortality (5Mx). Based on the specific rate of mortality, the probability of an individual with exact age xdieing before completing x+ 5 (5qx) years is calculated. Since the table begins at twenty years of age, it was assumed that deaths occur uniformly within the quinquennial age groups, so that the probabilities are calculated with the following expression
Table 2
Healthy life expectancy, for both sexes, based on self-evaluation of poor health. World Health Survey, Brazil, 2003.
Age Traditional life table Poor health People-years Life expectancy
1 2 3 4 5 6 7 8 9 10 11 12 13
Mortality Probability Survivors Years Years Life Prevalence With With Healthy In poor Years
rates of death lived lived, expectancy (%) good good since health lived in
between starting self-rated self-rated age x state poor
ages x, at age x health health health
x+n between starting state
the ages at age x
(x; x+n)
x nMx nqx lx nLx Tx ex nπx (1-nπx/100)*Lx THx e’x ex-e’x %
20 0.00188 0.0094 100,000 497,656 5,433,619 54.34 3.58 479,829 4,739,131 47.39 6.94 12.8
25 0.00216 0.0108 99,062 492,646 4,935,963 49.83 3.90 473,417 4,259,302 43.00 6.83 13.7
30 0.00256 0.0127 97,996 486,867 4,443,316 45.34 3.80 468,354 3,785,885 38.63 6.71 14.8
35 0.00318 0.0158 96,750 479,933 3,956,450 40.89 6.79 447,324 3,317,531 34.29 6.60 16.1
40 0.00432 0.0214 95,223 471,029 3,476,517 36.51 7.80 434,275 2,870,207 30.14 6.37 17.4
45 0.00602 0.0296 93,189 459,040 3,005,489 32.25 10.98 408,644 2,435,932 26.14 6.11 19.0
50 0.00829 0.0406 90,427 442,961 2,546,448 28.16 13.72 382,183 2,027,287 22.42 5.74 20.4
55 0.01193 0.0579 86,757 421,219 2,103,487 24.25 15.85 354,476 1,645,104 18.96 5.28 21.8
60 0.01700 0.0816 81,730 391,988 1,682,268 20.58 17.12 324,877 1,290,628 15.79 4.79 23.3
65 0.02450 0.1154 75,065 353,666 1,290,280 17.19 21.05 279,210 965,751 12.87 4.32 25.2
70 0.03660 0.1677 66,401 304,174 9,366,15 14.11 20.26 242,544 686,541 10.34 3.77 26.7
75 0.05437 0.2393 55,268 243,275 632,440 11.44 24.14 184,554 443,997 8.03 3.41 29.8
5qx= 10 x nMn . 2 + 5 x nMn
Note that in the last age group, at the open interval, every individual will die. The probabil-ity of death in this interval (∞q80) equals 1.
Given these probabilities of death, the num-ber of survivors reaching the initial age of the following age group can be calculated (lx+5). Thus: lx+5= lxx (1 - 5qx) (3).
It was assumed that the number of survivors reaching twenty years of age equals 100,000. According to Table 2, the number of survivors reaching 25 years of age (l25) is equal to 99,062 (column 4).
The next column in the life table shows the number of lived years between the ages xand x+ 5. Every individual that survived the age of x+ 5 will fully live the period of five years. The ones who die before reaching the age of x+ 5 (1x- 1x+5) will live half the amplitude of the in-terval (2.5 years), assuming the deaths are uni-formly distributed along the interval. Thus: 5Lx= 5 x 1x+5+ 2,5 x (1x- 1x+5). For the open interval,
∞Lx= lx .
∞Mx
The survivors reaching twenty years of age will, added together, live 497,656 years in the subse-quent five years (column 5).
In column 6 is presented the total number of years to be lived by the survivors in the age group x, until the group extinguishes itself. This is done by accumulating the lived years in each interval:
Tx=
Σ
∞
a=x nLa (5).
Survivors reaching the age of twenty will al-together live a total of 5,433,619 years. The life expectancy is calculated by dividing the num-bers of years one expects to live starting from a certain age by the number of survivors to the referred age:
ex= Tx (6). lx
According to the mortality rates used for the year 2003, at the age of twenty, one is expected to live an additional 54.34 years (column 7).
The proportion of individuals, of both sex-es, that self-reated their health as poor (“bad” or “very bad”) is presented in the eighth column. The prevalence increases monotonically with age except between the second and third age groups. The ninth column shows the healthy
years lived in each age group by subtracting the total portion of years lived in an unhealthy state (column 8) from the total years lived (col-umn 5). By cumulatively summing these val-ues, the number of people-years that will be lived healthily from a determined age x (col-umn 10) is obtained. Of the 5,433,619 years expected to be lived from the age of twenty, 4,739,131 will be lived in a healthy state.
Similar to the traditional mortality table, the expectancy of healthy life (e’x ) is calculated by dividing the number of people-years lived in a healthy state from a certain age xby the survivors of the referred age. As can be ob-served in column 11 of Table 2, at the age of twenty, one expects to live another 47.4 healthy years. Consequently, 6.9 years are lived in a poor state of health (column 12), correspond-ing to 12.8% of the life expectancy at that age (column 13).
The method of calculation presented in Table 2 was also used for the second and third estimates of healthy life expectancy. For the second estimate, the prevalence rate of indi-viduals with a poor self-rated health is substi-tuted for each age group by the proportion of individuals who reported having a long-term disease or disability which limits their daily ac-tivities. For the third estimate, the specific rate by age of being unhealthy is given by the aver-age score of functional limitations estimated in the factor analysis.
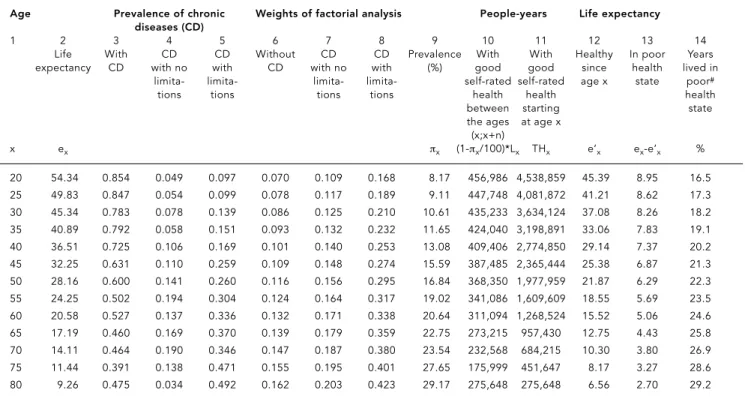
The fourth methodology involved three sit-uations (no disease or disability; with disease or disability but without limitation; with dis-ease or disability and with resulting limitation) and weights to mark the severity of each situa-tion according to the individual’s age. To ac-complish this estimate, a minor adaptation of the Sullivan method was made, as illustrated in Table 3.
To calculate healthy life expectancy with more than two health events, the population is classified in s+1categories, including all indi-viduals, from those with no health problem to those with the most severe cases. Accordingly, P0, P1, ..., Psrepresents the proportions of the population in each category, and w0, w1, ..., ws represents the weight describing the severity of each state of health, measured on a scale from 0 (best health state) to 1 (worst health state). In this case, the specific rate by age of not being healthy 5πxis given by the average of the scores weighted by the proportion of individuals in each category of each age group:
5πx=
Σ
sIn Table 3, the functions of the mortality table were omitted except for life expectan-cy, shown in column 2, since the calculations for the other columns were given in Table 2. Columns 3, 4 and 5 show the proportions of in-dividuals of both sexes in each category, ad-justed using a multinomial model because they display great oscillation between ages. Columns 6, 7 and 8 show the weights calculated as an av-erage of the scores of functional limitations (on a scale from 0 to 1) by category and age group. The weighted average (πx) is presented in col-umn 9. In the first age group, the prevalence of poor states of health is equal to 0.0817 (0.854x 0.070+0.049x0.109+0.097x0.168). The other func-tions are calculated according to the methods presented above.
Results
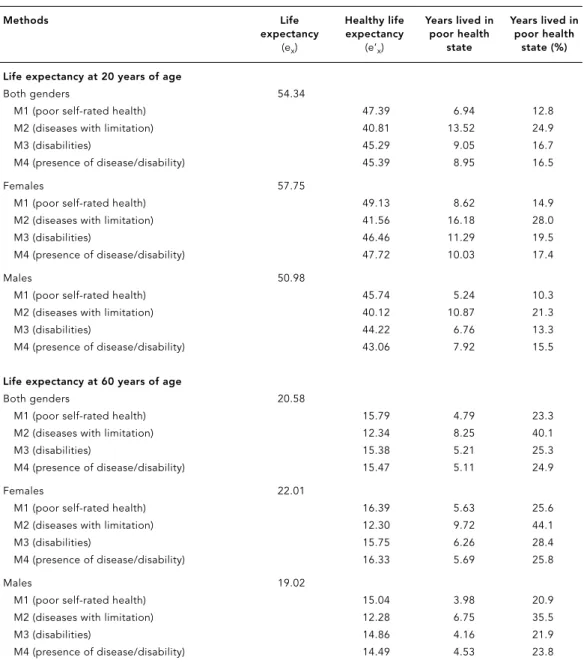
Table 4 displays the total life expectancy and the total healthy life expectancy for the ages of twenty and sixty years, according to sex. The number of unhealthy years lived is also shown, as well as its relative proportion of the total life expectancy.
In reference only to the mortality compo-nent, females at the age of twenty expect, on av-erage, to live approximately seven years more than males (57.8 years versus 51.0 years). At the age of sixty the difference by sex is, on average, three years in favor of females. Concerning the expectancy of a healthy life, given that females live more years in poor health or with limita-tions, the difference in healthy life expectancy between males and females is smaller both at the age of twenty and sixty (Table 4).
Comparing all four methodologies indicates that the estimate with greatest loss in healthy years is the one based only on the occurrence of a long-term disease or disability that causes limitations, not considering the resulting degree of hardship in performing daily activities and the severity of functional limitations (method 2). According to the estimate, at the age of six-ty, it is expected that males lose, on average, 35.0% of the years yet to be lived with limita-tions that result from long-term diseases. This average is 44.0% for females.
The other methodologies employed show estimates closer to each other. The measure-ment of unhealthiness through poor self-rated health is the one that presents the smallest rela-Table 3
Healthy life expectancy based on factorial analysis (method 2). World Health Survey, Brazil, 2003.
Age Prevalence of chronic Weights of factorial analysis People-years Life expectancy
diseases (CD)
1 2 3 4 5 6 7 8 9 10 11 12 13 14
Life With CD CD Without CD CD Prevalence With With Healthy In poor Years
expectancy CD with no with CD with no with (%) good good since health lived in
limita- limita- limita- limita- self-rated self-rated age x state poor#
tions tions tions tions health health health
between starting state
the ages at age x
(x;x+n)
x ex πx (1-πx/100)*Lx THx e’x ex-e’x %
20 54.34 0.854 0.049 0.097 0.070 0.109 0.168 8.17 456,986 4,538,859 45.39 8.95 16.5
25 49.83 0.847 0.054 0.099 0.078 0.117 0.189 9.11 447,748 4,081,872 41.21 8.62 17.3
30 45.34 0.783 0.078 0.139 0.086 0.125 0.210 10.61 435,233 3,634,124 37.08 8.26 18.2
35 40.89 0.792 0.058 0.151 0.093 0.132 0.232 11.65 424,040 3,198,891 33.06 7.83 19.1
40 36.51 0.725 0.106 0.169 0.101 0.140 0.253 13.08 409,406 2,774,850 29.14 7.37 20.2
45 32.25 0.631 0.110 0.259 0.109 0.148 0.274 15.59 387,485 2,365,444 25.38 6.87 21.3
50 28.16 0.600 0.141 0.260 0.116 0.156 0.295 16.84 368,350 1,977,959 21.87 6.29 22.3
55 24.25 0.502 0.194 0.304 0.124 0.164 0.317 19.02 341,086 1,609,609 18.55 5.69 23.5
60 20.58 0.527 0.137 0.336 0.132 0.171 0.338 20.64 311,094 1,268,524 15.52 5.06 24.6
65 17.19 0.460 0.169 0.370 0.139 0.179 0.359 22.75 273,215 957,430 12.75 4.43 25.8
70 14.11 0.464 0.190 0.346 0.147 0.187 0.380 23.54 232,568 684,215 10.30 3.80 26.9
75 11.44 0.391 0.138 0.471 0.155 0.195 0.401 27.65 175,999 451,647 8.17 3.27 28.6
80 9.26 0.475 0.034 0.492 0.162 0.203 0.423 29.17 275,648 275,648 6.56 2.70 29.2
tive loss in terms of healthy years of life, inde-pendent of gender. At twenty years of age males expect to lose around 10.3% of life ex-pectancy to poor health and females, 14.9%. At sixty years of age this proportion reaches 20.9% among males and 25.6% among females.
The tendency for the proportion of individ-uals in an unhealthy state to increase with age is found in all four estimates. However, the greatest variation in the relative loss of healthy years, between twenty and sixty years of age, is found for the estimate based on self-rated
health, while the smallest corresponds to the methodology based on the severity scale of functional limitations.
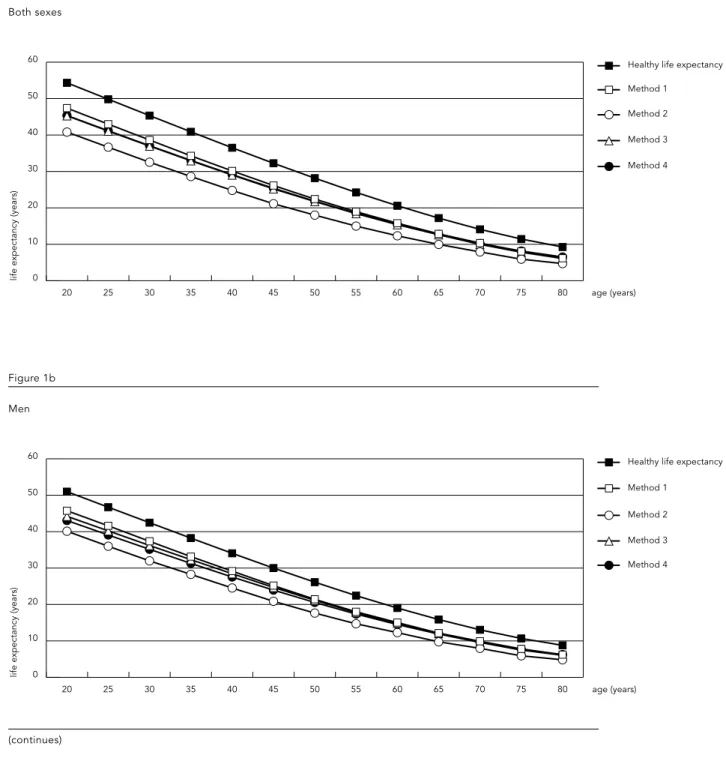
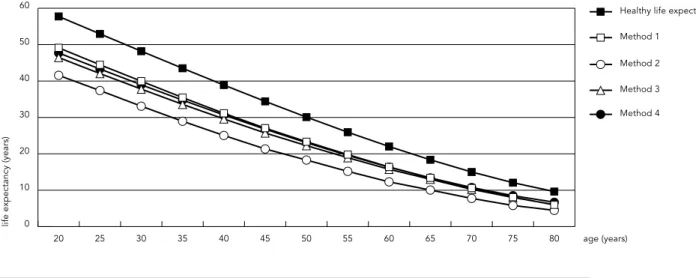
Figure 1 shows life expectancy and the esti-mates of healthy life expectancy, by sex, ac-cording to method employed. Results indicate that for all ages, independent of the method employed, life expectancy is greater among fe-males. However, females lose, relatively, more healthy years than males. Among the defining measures of being healthy, the greatest loss in years of healthy life results prominently in every Table 4
Life expectancy and healthy life expectancy at the age of twenty and sixty, by gender and selected methods.
World Health Survey, 2003.
Methods Life Healthy life Years lived in Years lived in
expectancy expectancy poor health poor health
(ex) (e’x) state state (%)
Life expectancy at 20 years of age
Both genders 54.34
M1 (poor self-rated health) 47.39 6.94 12.8
M2 (diseases with limitation) 40.81 13.52 24.9
M3 (disabilities) 45.29 9.05 16.7
M4 (presence of disease/disability) 45.39 8.95 16.5
Females 57.75
M1 (poor self-rated health) 49.13 8.62 14.9
M2 (diseases with limitation) 41.56 16.18 28.0
M3 (disabilities) 46.46 11.29 19.5
M4 (presence of disease/disability) 47.72 10.03 17.4
Males 50.98
M1 (poor self-rated health) 45.74 5.24 10.3
M2 (diseases with limitation) 40.12 10.87 21.3
M3 (disabilities) 44.22 6.76 13.3
M4 (presence of disease/disability) 43.06 7.92 15.5
Life expectancy at 60 years of age
Both genders 20.58
M1 (poor self-rated health) 15.79 4.79 23.3
M2 (diseases with limitation) 12.34 8.25 40.1
M3 (disabilities) 15.38 5.21 25.3
M4 (presence of disease/disability) 15.47 5.11 24.9
Females 22.01
M1 (poor self-rated health) 16.39 5.63 25.6
M2 (diseases with limitation) 12.30 9.72 44.1
M3 (disabilities) 15.75 6.26 28.4
M4 (presence of disease/disability) 16.33 5.69 25.8
Males 19.02
M1 (poor self-rated health) 15.04 3.98 20.9
M2 (diseases with limitation) 12.28 6.75 35.5
M3 (disabilities) 14.86 4.16 21.9
0
life expectancy (years)
10 20 30 40 50 60
Method 4 Method 3 Method 2 Method 1
Healthy life expectancy
80 age (years) 75
70 65 60 55 50 45 40 35 30 25 20 Figure 1
Life expectancy and healthy life expectancy, according to sex, age, and method. World Health Survey, Brazil, 2003.
Figure 1a
Both sexes
0 10 20 30 40 50 60
Method 4 Method 3 Method 2 Method 1
Healthy life expectancy
80 age (years) 75
70 65 60 55 50 45 40 35 30 25 20
life expectancy (years)
Figure 1b
Men
0 10 20 30 40 50 60
Method 4 Method 3 Method 2 Method 1
Healthy life expectancy
80 age (years) 75
70 65 60 55 50 45 40 35 30 25 20
life expectancy (years)
Figure 1c (continued)
Women
age group from the presence of a long-term disease or disability which limits daily func-tions. The other three measures produce values that differ little from each other.
Final comments
Since its creation, the WHO defined health as a complete state of physical, mental, and social well-being. This definition transcends the ab-sence of death, disease, and disability, and in-corporates concepts relative to well-being and to quality of life. In such context, the concept of healthy life expectancy or life expectancy free of disability emerges; a generic term which characterizes a population’s indicators that es-timate the average timeframe (in years) a per-son may expect to live in a healthy state.
Ever since the 1980s, a growing number of studies employ the Sullivan method 11,15due to its mathematical simplicity, the availability of required data, and the ease of interpreting its results. This indicator has also been adopted for monitoring health in European countries, Project REVES (Réseau Espérance de Vie en San-té) 23,24, and by the United States’ governmen-tal health plan Healthy People 201025. This method has also been employed to evaluate disparity in health by means of estimates of healthy life years according to socioeconomic indicators such as income and schooling 26,27.
There exists a certain consensus as to the potential of healthy life expectancy as a measure
to monitor and evaluate the action of health programs and politics 2. Differences exist in re-lation to the selection of measurement for indi-cating a healthy life. Some authors prefer mea-surements of relatively objective states, such as disability and diagnosed chronic diseases 28, ar-guing that interference by the cultural context should be avoided 29,30. On the other hand, there are authors who consider it important to incorporate the subjective dimension, such as self-rated health, because they consider it a strong factor in predicting mortality, well-being, and the use of health services 26,31.
The inclusion of various measures in the present study raises an important methodolog-ical question of how to measure healthiness 32, whether it be with simple or combined indica-tors, or by incorporating or not the severity of each situation.
In this study, the first two measures em-ployed did not consider the seriousness of each situation but only the occurrence of a negative event. Authors such as Crimmins 32favor the use of various dichotomous health measures, since they provide more specific information than those based on measures involving a continuum in severity, and are thus more efficient for imple-menting and monitoring health politics.
individ-ual’s personal perception of poor health or the inception of a chronic disease, the occurrence of these events is what determines the greatest loss in years of healthy life. In fact, the estimate based only on the presence of a long-term ill-ness that limits daily activities was what caused the greatest relative loss in healthy years for both sexes at all ages.
The third methodology employed in this study to estimate the healthy life expectancy attempted to establish a continuous degree of severity based on scores of functional limita-tions constructed with an analysis that reduced the different dimensions of the interviewee’s state of health to a single component. An ex-tension of the Sullivan method was also pro-posed which incorporates three situations de-rived from the presence, or lack thereof, of a long-term illness combined with the occur-rence of limitations to daily activities, in addi-tion to the degree of severity for each one of them, based on the functional limitation scores. However, the two healthy life estimates that in-volved adjustment by severity of limitations produce very similar results to the estimates based on self-rated health, especially at an ad-vanced ages.
The findings in this study highlight the con-sistency in the WHS’ results. It is observed, for all measures employed, that the proportion of healthy life years lost significantly increases with age and that, even though females have a longer life expectancy than males, they live, relatively, less years in good health. Similar to a study developed in Belgium 35, healthy life
ex-pectancy was greatest when estimated using poor self-rated health than when calculated from the presence of disabilities and illnesses.
What is most important to note is that, de-spite from the index’s sensitivity, all measures follow the same pattern, varying only in degree. It is observed that the differences between the various estimates of healthy life expectancy was greatest between younger females but was only relevant when the estimate was based on the presence of a disease or disability that lim-its daily functions.
Contrary to the multistate life table method, which employs longitudinal data, the Sullivan method has been criticized for not taking into consideration reversible health states 36,37. However, Mathers & Robine 38, employing vari-ous simulation models and possible scenarios, conclude that unless the situation is one of sud-den and radical change in the transition rate of the state of health, which is uncommon, the Sullivan method provides strong estimates for monitoring trends in healthy life expectancy.
This article attempts to introduce the Sulli-van method for calculating healthy life ex-pectancy to national Brazilian literature, in or-der to establish a debate around the various in-dicators of state of health, based not only on mortality information, but also considering the effects of morbidity. Whereas death is a single event, the loss of healthy life is hard to quantify. Hopefully, the different proposals for measur-ing well-bemeasur-ing, combined with to the simplicity and strength of the Sullivan method, may help stimulate this emergent debate in Brazil.
Resumo
Este estudo tem como objetivos apresentar a técnica proposta por Sullivan e estimar a expectativa de vida saudável, utilizando diferentes formas de mensurar o estado de saúde, com base em informações proveni-entes da Pesquisa Mundial de Saúderealizada no Bra-sil em 2003. Pela combinação de informação de mor-talidade e morbidade num único indicador, simplici-dade do cálculo e fácil interpretação dos resultados, o método de Sullivan é atualmente o mais usado para estimar expectativa de vida saudável. Os resultados mostraram que a maior perda de anos saudáveis é ob-tida quando há ocorrência de doença de longa dura-ção ou incapacidade que limitam as atividades habi-tuais, independentemente do grau de dificuldade em realizar as atividades cotidianas e a severidade das
li-mitações funcionais. As duas estimativas de expectati-va de vida saudável ajustadas pela severidade das li-mitações mostraram resultados muito similares àque-las estimadas com base na percepção do estado de saúde, especialmente para as idades avançadas. Ob-serva-se, para todas as medidas utilizadas, que a pro-porção de anos perdidos de vida saudável aumenta significativamente com a idade e que, embora as mu-lheres tenham uma expectativa de vida maior que a dos homens, elas vivem proporcionalmente menos anos com boa saúde.
References
1. Gold MR, Stevenson D, Fryback DG. HALYS and QALYS and DALYS, oh my: similarities and differ-ences in summary measures of population health. Annu Rev Public Health 2002; 23:115-34. 2. Molla MT, Madans JH, Wagener DK, Crimmins
EM. Summary measures of population health: Report of findings on methodologic and data is-sues. Hyattsville: National Center for Health Sta-tistics; 2003. (Healthy People 2010).
3. Comisión Económica para América Latina y el Caribe/Centro Latinoamericano y Caribeño de Demografia. América Latina y el Caribe: estima-ciones y proyecestima-ciones de población. 1950-2050. Santiago de Chile: Comisión Económica para Amé-rica Latina y el Caribe, Naciones Unidas; 2004. (Boletín Demográfico 73).
4. Field JF, Gold GM, editors. Summarizing popula-tion health: direcpopula-tions for the development and application of population metrics. Washington DC: National Academies Press; 1998.
5. Rogers A, Rogers RG, Belanger A. Longer life but worse health? Measurement and dynamics. Geron-tologist 1990; 30:640-9.
6. Verbrugge LM. Longer life but worsening health? Trends in health and mortality of middle-aged and older persons. Milbank Mem Fund Q Health Soc 1984; 62:475-519.
7. Olshansky SJ, Rudberg MA, Carnes BA, Cassel CK, Brody JA. Trading off longer life for worsening health: the expansion of morbidity hypothesis. J Aging Health 1991; 3:194-216.
8. Guzmán JM. Envejecimiento y desarrollo en Amé-rica Latina y el Caribe. Santiago de Chile: Co-misión Económica para América Latina y el Ca-ribe/Centro Latinoamericano y Caribeño de De-mografia; 2002. (Población y Desarrollo 28). 9. Triantafillou J, Mestheneos E, Levett J, Petsetakis
E. The health of older people in the European Union: current state and future trends. http:// www.sextant.gr/HOEreport/HOEreport.htm (ac-cessed on 14/Oct/2005).
10. Gruenberg EM. The failures of success. Milbank Mem Fund Q Health Soc 1977; 55:3-24.
11. Robine JM, Ritchie K. Healthy life expectancy: evaluation of global indicator of change in popu-lation health. BMJ 1991; 302:457-60.
12. Kenneth G, Manton KCL. Active life expectancy estimates for the U.S. elderly population: a multi-dimensional continuous-mixture model of func-tional change applied to completed cohorts, 1982-1996. Demography 2000; 37:253-66.
13. Sanders BS. Measuring community health levels. Am J Public Health Nations Health 1964; 54:1063-70. 14. Sullivan DF. A single index of mortality and
mor-bidity. HSMHA Health Rep 1971; 86:347-54. 15. Mathers CD, Sadana R, Salomon JA, Murray CJL,
Lopez AD. Healthy life expectancy in 191 coun-tries, 1999. Lancet 2001; 357:1685-91.
16. Mutafova M, van de Water HP, Perenboom RJ, Boshuizen HC, Maleshkov C. Health expectancy calculations: a novel approach to studying popu-lation health in Bulgaria. Bull World Health Organ 1997; 75:147-53.
17. Camargos MCS, Perpétuo IHO, Machado CJ. Life expectancy with functional disability in elderly persons in São Paulo, Brazil. Rev Panam Salud Pública 2005; 17:379-86.
18. Vasconcellos MTL, Silva PLN, Szwarcwald CL. Sampling design for the World Health Surveyin Brazil. Cad Saúde Pública 2005; 21 Suppl:S89-99. 19. Kaplan RM, Erickson P. Gender differences in
quality-adjusted survival using a Health-Utilities Index. Am J Prev Med 2000;18:77-82.
20. Arber S, Cooper H. Gender differences in health in later life: the new paradox? Soc Sci Med 1999; 48:61-76.
21. Jagger C. Health expectancy calculation by the Sullivan method: a practical guide. Leicester: Eu-ro-REVES/University of Leicester; 1997.
22. World Health Organization. International classi-fication of functioning, disability and health: ICF. Geneva: World Health Organization; 2001. 23. Mathers CD, Robine J. Health expectancy indicators:
a review of the work of REVES to date. In: Robine JM, Mathers CD, Bone MR, Romieu I, editors. Calcula-tion of health expectancies, harmonizaCalcula-tion, consen-sus achieved and future perspectives. France: John Libbey Eurotext/Les Editions INSERM; 1993. p. 1-21. 24. Robine JM, Jagger C, Van Oyen H. The EURO-RE-VES approach: a vision for Europe. Geneva: Statis-tical Office of the European Communities, World Health Organization; 2004. (Report n. 16). 25. Mathers CD, Iburg KM, Salomon JA, Tandon A,
Chatterji S, Ustun B, et al. Global patterns of healthy life expectancy in the year 2002. BMC Public Health 2004; 4:66.
26. Bossuyt N, Gadeyne S, Deboosere P, Van Oyen H. Socio-economic inequalities in health expectan-cy in Belgium. Public Health 2004; 118:3-10. 27. Valkonen T, Sihvonen AP, Lahelma E. Health
ex-pectancy by level of education in Finland. Soc Sci Med 1997; 44:801-8.
Acknowledgments
The present work had financial support from the Conselho Nacional de Desenvolvimento Científico e Tecnológico (CNPq; National Counsel for Scientific Development and Technology) and from the Depar-tamento de Ciência e Tecnologia (DECIT; Department of Science and Technology), Ministério da Saúde (Ministry of Health).
Contributors
28. Bone MR, Bebbington AC, Nicolaas G. Policy ap-plications of health expectancy. J Aging Health 1998; 10:136-53.
29. Mathers CD. Health expectancies: an overview and critical appraisal. In: Murray CJL, Salomon JA, Mathers CD, Lopez AD, editors. Summary sures of population health: concepts, ethics, mea-surement and applications. Geneva: World Health Organization; 2002. p. 177-204.
30. Nord E. A review of synthetic health indicators. Oslo: National Institute of Public Health; 1997. 31. Robine JM, Jagger C. Creating a coherent set of
indicators to monitor health across Europe: the Euro-REVES 2 project. Eur J Public Health 2003; 13:6-14.
32. Crimmins E. Health expectancies: what can we expect from summary indicators of population health? In: Murray CJL, Salomon JA, Mathers CD, Lopez AD, editors. Summary measures of popula-tion health: concepts, ethics, measurement and applications. Geneva: World Health Organization; 2002. p. 213-21.
33. Mathers CD, Murray CJ, Ezzati M, Gakidou E, Sa-lomon JA, Stein C. Population health metrics: crucial inputs to the development of evidence for health policy. Popul Health Metr 2003; 1:6.
34. Murray C, Frenk J. Summary measures of popula-tion health in the context of the WHO framework for health system performance assessment. Mur-ray CJL, Salomon JA, Mathers CD, Lopez AD, edi-tors. Summary measures of population health: concepts, ethics, measurement and applications. Geneva: World Health Organization; 2002. p. 1-12. 35. Van Oyen H, Bossuyt N, Deboosere P, Gadeyne S, Tafforeau J. Differences in health expectancy in-dicators in Belgium by region. Arch Public Health 2002; 60:341-62.
36. Brouard N, Robine JM. A method for calculation of health expectancy applied to longitudinal sur-veys of the elderly in France. In: Robine JM, Blanchet M, Dowd JE, editors. Health expectancy. London: Institut National de la Santé et de la Recherche Médicale; 1992. p. 87-8.
37. Bebbington AC. Expectation of life without dis-ability measured from the OPCS disdis-ability sur-veys. In Robine JM, Blanchet M, Dowd JE, editors. Health expectancy. London: Institut National de la Santé et de la Recherche Médicale; 1992. p 23-34. 38. Mathers CD, Robine JM. How good is Sullivan’s method for monitoring changes in population health expectancies? J Epidemiol Community Health 1997; 51:80-6.
Submitted on 04/May/2005