Correspondence:
Célia Landmann Szwarcwald Instituto de Comunicação e Informação Científica e Tecnológica em Saúde, Fundação Oswaldo Cruz Av. Brasil, 4365, Pavilhão Haity Moussatché, sala 225
21045-360 Rio de Janeiro, RJ, Brasil E-mail: [email protected]
Received: 29 Jun 2016 Approved: 23 Oct 2016
How to cite: Szwarcwald CL, Montilla DER, Marques AP, Damacena GN, Almeida WS, Malta DC. Inequalities in healthy life expectancy by Federated States. Rev Saude Publica. 2017;51 Suppl 1:7s.
Copyright: This is an open-access article distributed under the terms of the Creative Commons Attribution License, which permits unrestricted use, distribution, and reproduction in any medium, provided that the original author and source are credited.
http://www.rsp.fsp.usp.br/
Inequalities in healthy life expectancy by
Federated States
Célia Landmann SzwarcwaldI, Dália Elena Romero MontillaI, Aline Pinto MarquesI,
Giseli Nogueira DamacenaI, Wanessa da Silva de AlmeidaI, Deborah Carvalho MaltaII
I Instituto de Comunicação e Informação Científica e Tecnológica em Saúde. Fundação Oswaldo Cruz.
Rio de Janeiro, RJ, Brasil
II Departamento de Enfermagem Materno Infantil e Saúde Pública. Escola de Enfermagem.
Universidade Federal de Minas Gerais. Belo Horizonte, MG, Brasil
ABSTRACT
OBJECTIVES: To estimate the healthy life expectancy at 60 years by sex and Federated States and to investigate geographical inequalities by socioeconomic status.
METHODS: Healthy life expectancy was estimated by the Sullivan method, based on the information of the National Survey on Health, 2013. hree criteria were adopted for the deinition of “unhealthy state”: self-assessment of bad health, functionality for performing the activities of daily living, and the presence of noncommunicable disease with intense degree of limitation. he indicator of socioeconomic status was built based on the number of goods at household and educational level of the head of household. To analyze the geographical inequalities and socioeconomic level, inequality measures were calculated, such as the ratio, the diference, and the angular coeicient.
RESULTS: Healthy life expectancy among men ranged from 13.8 (Alagoas) to 20.9 (Espírito Santo) for the self-assessment criterion of bad health. Among women, the corresponding estimates were always higher and ranged from 14.9 (Maranhão) to 22.2 (São Paulo). As to the ratio of inequality by Federated State, the medians were always higher for healthy life expectancy than for life expectancy, regardless of the deinition adopted for healthy state. Regarding the diferences per Federated State, the healthy life expectancy was seven years higher in one state than in another. By socioeconomic status, diferences of three and four years were found, approximately, between the last and irst ifth, for men and women, respectively.
CONCLUSIONS: Despite the association of the mortality indicators with living conditions, the inequalities are even more pronounced when the welfare and the limitations in usual activities are considered, showing the necessity to promote actions and programs to reduce the socio-spatial gradient.
INTRODUCTION
he portion of the world’s older population (aged 60 years or older) increased from 8% in
1950 to 13% in 20131. Obeying to a faster pace of growth, the older population will represent
21% of the total in 20501. With the aging of the population in both developing and developed
countries, the noncommunicable diseases (NCD) became the most important health problem in most countries, generating disabilities and high degree of limitation of sick people in their work and leisure activities2.
he increased longevity in developed countries stressed the need for new health indicators
that included quality measures3. Once a long life does not necessarily mean a healthy life,
today, mortality indicators are considered insuicient to adequately characterize the state
of health of a population4.
In Brazil, over the past 30 years, sharp demographic changes occurred. With the aging of the population, the Country experiences an epidemiological transition, with important changes
in morbidity and mortality proile. he NCD have responded for more than 70% of deaths
and loss of quality of life, with a substantial portion of the total burden of diseases attributed to the occurrence of the NCD among older people5. Recent information showed that one in
two seniors have the diagnosis of at least one NCD6.
After the 2000s, diferent health indicators have been proposed to complement the studies on mortality, considering not only the proile of morbidity and mortality, but also the
functional limitations7. In national surveys on health, the self-perception of health and the
reported diagnosis of NCD have been widely used to establish diferences in morbidity among
population groups8. In addition, research has been focusing on the quality measurement of
the last years of life and, aiming to assess the assistance given and prevention programs, it has used health indicators that combine mortality and morbidity data9,10.
Among the health indicators that consider information of morbidity and mortality in a single measure, the healthy life expectancy (HALE) obtained by the Sullivan method11 has been the
most widely used indicator, by its simplicity and easy interpretation of results12. he HALE is
a measure of the population health to estimate the expected number of “healthy years” for
the individuals of a population in a given age. Deinitions of “healthy” are generally based
on self-assessment of health and presence of chronic disease or disability and functional or cognitive limitations13.
In Brazil, the HALE was estimated for the total adult population9,12,14, according to sex and
age group, considering self-assessment of health, presence of chronic disease, or problems
that limit their usual activities. However, the diferences per Federated State (FS) in terms of healthy longevity have not been surveyed yet. Knowing that the diferent living conditions
afect the regional pattern of morbidity and mortality in the Country15, this study aimed to
investigate the socio-spatial inequalities of HALE by FS in the Brazilian older population.
METHODS
he National Survey on Health (PNS) is a home-based and nationwide research held by the
Brazilian Ministry of Health and by the Oswaldo Cruz Foundation, in partnership with the
Brazilian Institute of Geography and Statistics (IBGE) in the years 2013 and 2014. he project was approved by the National Commission of Ethics in Research (Opinion 328,159, of 26 June 2013).
he sample of the PNS is a subsample of the Amostra Mestra do Sistema Integrado de Pesquisas
Domiciliares (SIPD – Master Sample of Integrated Household Surveys) of IBGE. he subsample
was selected by sampling by conglomerates in three stages, with stratiication of the primary sampling units (census tracts). In the second stage, in each census tracts, a ixed number of
At the end of the ieldwork, 81,254 households were visited. Of these, 69,994 households
were occupied. Exactly 64,348 household interviews and 60,202 individual interviews were conducted at the household with the selected resident.
he HALE is a measure of the population health that estimates the expected number of
“healthy years” (years of life in good health) for the individuals of a population in a given age.
Deinitions of “healthy” are generally based on self-assessment of state of health, reported
morbidity, and presence of functional or cognitive limitations12.
In this study, healthy life expectancy was estimated by Sullivan method11 in the older
population (60 years or more) by sex and FS. he method consists of estimating the proportion
of “years lived in good health” of the expected total number of years experienced by a cohort
according to the mathematical equation presented by Romero et al.12. Life expectancy at
60 years by sex and FS was provided by IBGEa.
To establish the “unhealthy state,” three measures were used: self-assessment of health, functionality of older people to perform the activities of daily living, and the presence of at
least one NCD with limitations resulting from the disease. he analysis of self-assessment
of health was based on the following question of the individual questionnaire: “In general,
how do you assess your health?” he answers ranged from 1 (very good) to 5 (very bad),
which were aggregated into two categories: very good, good or regular; bad or very bad, corresponding, respectively, to the “healthy” and “unhealthy” states.
Regarding the functionality of the older adults, we used the indicator of functional limitation to
perform activities of daily living (ADL): to eat alone, including holding a fork, cutting food and drinking from a cup; to shower alone, including getting in and out of the shower or bath; to go to the bathroom alone, including sitting and lifting the toilet; to get dressed alone, including putting on socks and shoes, closing the zipper, closing and opening buttons; to walk home alone from a room
to another of the house; to lie down or get up of the bed without help. he variable corresponding to the case of the older adult having great diiculty (“cannot” or “has great diiculty”) to perform
at least one of the ADL was used for the establishment of the “unhealthy state.”
As to the presence of NCD, the variable was composed by the answers to all questions regarding the diagnosis of chronic diseases, including hypertension, diabetes, heart disease, cerebrovascular accident (CVA), asthma, arthritis, chronic problem of column, work-related musculoskeletal disorder (WMSD), depression, other mental disease, lung disease, cancer, chronic kidney failure, or
other chronic physical or mental illness not previously speciied. In the case of airmative response
to any NCD, we asked questions about the degree of limitation to conduct the usual activities
because of the disease. he indicator regarding the presence of at least one NCD with intense or very intense limitation degree to conduct usual activities was adopted to deine the “unhealthy state.”
To analyze geographical inequalities of HALE at 60 years by FS, an indicator of socioeconomic
status (SES) was considered, adapted from the Brazilian Association of Research Companies,
using the number of goods at the household, educational level of the head of household, and
presence of maid paid monthly. he SES indicator was used in the form of points obtained
in each household, considering the mean by FS.
he outcomes considered in this study were life expectancy at 60 years, provided by IBGE; healthy life years at 60 years, calculated by the three deinitions of healthy state; and total number of years lived with bad health perception. he following measures of geographical inequalities were used:
ratio of inequalities, given by the ratio among the values found by FS and the minimum value;
diference, given by the diference among the values found by FS and the minimum value.
As to inequality by SES, the following measures were used17: angular coeicient of inequalities,
corresponding to the angular coeicient of the regression of each outcome with the SES indicator, ratio and diference among the estimates in the last and irst ifth of the SES indicator. To estimate the angular coeicient of inequality, we used the statistical procedure
a Instituto Brasileiro de Geografia
of linear regression using the SES indicator as the independent variable. Angular coeicients and the values of the statistical signiicance level for each outcome were estimated.
Because it is a survey with stratiication of primary sampling units and selection by conglomerates
in three stages, the complex sampling design was considered in all statistical analysis of the data.
RESULTS
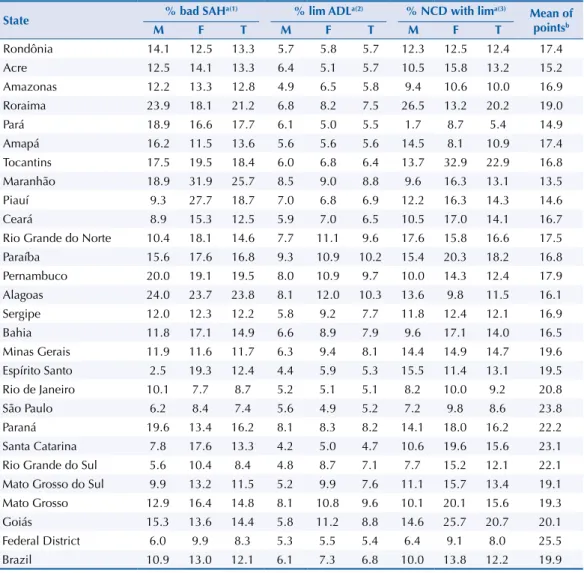
Table 1 shows the variables used for the deinition of the unhealthy state: proportion of older
people with self-assessment of bad or very bad health, the proportion of seniors with some
diiculty to carry out the activities of daily living, and proportion of seniors diagnosed with
some NCD and intense or very intense degree of limitation and for carrying out usual activities
because of the disease. he proportion of people with bad or very bad health self-assessment showed wide variation, from 2.5% to 24.0%, for males, and from 7.7% to 31.9%, for females,
with maximum values found in Alagoas and Maranhão, respectively, and the minimum, in
Espírito Santo and Rio de Janeiro, showing a clear North-South disparity.
Table 1. Proportion of older people in “unhealthy state” according to different definitions, per sex and State. National Survey on Health, 2013.
State % bad SAH
a(1) % lim ADLa(2) % NCD with lima(3)
Mean of pointsb
M F T M F T M F T
Rondônia 14.1 12.5 13.3 5.7 5.8 5.7 12.3 12.5 12.4 17.4
Acre 12.5 14.1 13.3 6.4 5.1 5.7 10.5 15.8 13.2 15.2
Amazonas 12.2 13.3 12.8 4.9 6.5 5.8 9.4 10.6 10.0 16.9
Roraima 23.9 18.1 21.2 6.8 8.2 7.5 26.5 13.2 20.2 19.0
Pará 18.9 16.6 17.7 6.1 5.0 5.5 1.7 8.7 5.4 14.9
Amapá 16.2 11.5 13.6 5.6 5.6 5.6 14.5 8.1 10.9 17.4
Tocantins 17.5 19.5 18.4 6.0 6.8 6.4 13.7 32.9 22.9 16.8
Maranhão 18.9 31.9 25.7 8.5 9.0 8.8 9.6 16.3 13.1 13.5
Piauí 9.3 27.7 18.7 7.0 6.8 6.9 12.2 16.3 14.3 14.6
Ceará 8.9 15.3 12.5 5.9 7.0 6.5 10.5 17.0 14.1 16.7
Rio Grande do Norte 10.4 18.1 14.6 7.7 11.1 9.6 17.6 15.8 16.6 17.5
Paraíba 15.6 17.6 16.8 9.3 10.9 10.2 15.4 20.3 18.2 16.8
Pernambuco 20.0 19.1 19.5 8.0 10.9 9.7 10.0 14.3 12.4 17.9
Alagoas 24.0 23.7 23.8 8.1 12.0 10.3 13.6 9.8 11.5 16.1
Sergipe 12.0 12.3 12.2 5.8 9.2 7.7 11.8 12.4 12.1 16.9
Bahia 11.8 17.1 14.9 6.6 8.9 7.9 9.6 17.1 14.0 16.5
Minas Gerais 11.9 11.6 11.7 6.3 9.4 8.1 14.4 14.9 14.7 19.6 Espírito Santo 2.5 19.3 12.4 4.4 5.9 5.3 15.5 11.4 13.1 19.5
Rio de Janeiro 10.1 7.7 8.7 5.2 5.1 5.1 8.2 10.0 9.2 20.8
São Paulo 6.2 8.4 7.4 5.6 4.9 5.2 7.2 9.8 8.6 23.8
Paraná 19.6 13.4 16.2 8.1 8.3 8.2 14.1 18.0 16.2 22.2
Santa Catarina 7.8 17.6 13.3 4.2 5.0 4.7 10.6 19.6 15.6 23.1 Rio Grande do Sul 5.6 10.4 8.4 4.8 8.7 7.1 7.7 15.2 12.1 22.1 Mato Grosso do Sul 9.9 13.2 11.5 5.2 9.9 7.6 11.1 15.7 13.4 19.1 Mato Grosso 12.9 16.4 14.8 8.1 10.8 9.6 10.1 20.1 15.6 19.3
Goiás 15.3 13.6 14.4 5.8 11.2 8.8 14.6 25.7 20.7 20.1
Federal District 6.0 9.9 8.3 5.3 5.5 5.4 6.4 9.1 8.0 25.5
Brazil 10.9 13.0 12.1 6.1 7.3 6.8 10.0 13.8 12.2 19.9
M: male; F: female; T: total; SAH: self-assessment of health; Lim: limitation; ADL: activities of daily living; NCD: noncommunicable disease.
a Unhealthy state definitions:
(1) Self-assessment of bad or very bad health. (2) Has difficulty or is unable to perform the ADL.
(3) Has at least one NCD with intense or very intense degree of limitation of usual activities because of the disease. b The mean was calculated by the number of points allocated to households of FS according to the number of
he proportion of seniors with some NCD and intense degree of limitation also varied
substantially according to the FS. However, by relying on the diagnosis of chronic illness,
the minimum and maximum values were found in the Northern States for both sexes. he
indicator that showed lower values and the lowest amplitude of variation by FS was the
proportion of people with some sort of functionality for ADL, with minimum values of 4.2% and 4.9%, and maximum of 9.3% and 12.0% between men and women, respectively (Table 1).
In Brazil, the lowest proportion of people living in an “unhealthy state” was obtained for the indicator of functionality issues, while the other two showed similar values. For any one of the three indicators considered, the proportion of women in “unhealthy state” is higher than among men (Table 1).
Table 1 also shows estimates of socioeconomic level indicator, calculated by the average
number of points awarded to households of the FS. he minimum value was 13.5 in Maranhão
and the maximum of 25.5 in the Federal District.
Table 2. Estimates of life expectancy (LE) and healthy life expectancy (HALE) at age 60 according to the different definitions of “unhealthy state,” per sex and State. National Survey on Health, 2013.
State LE
a bad HALE SAHb(1) HALE lim ADLb(2) HALE NCD with limb(3)
M F T M F T M F T M F T
Rondônia 17.9 20.6 19.1 15.4 18.0 16.6 16.9 19.4 18.0 15.7 18.0 16.8 Acre 19.4 22.6 20.9 17.0 19.5 18.2 18.1 21.5 19.7 17.3 19.1 18.2 Amazonas 18.5 21.6 20.0 16.2 18.7 17.4 17.6 20.2 18.8 16.8 19.3 18.0 Roraima 18.4 20.1 19.2 14.0 16.4 15.1 17.2 18.4 17.8 13.5 17.4 15.3 Pará 18.7 21.7 20.1 15.1 18.1 16.6 17.5 20.6 19.0 18.4 19.8 19.0 Amapá 19.9 22.6 21.3 16.7 20.0 18.4 18.8 21.4 20.1 17.0 20.8 18.9 Tocantins 19.7 22.1 20.8 16.2 17.8 17.0 18.5 20.6 19.5 17.0 14.8 16.1 Maranhão 18.0 21.8 19.9 14.6 14.9 14.8 16.4 19.9 18.2 16.2 18.3 17.3 Piauí 17.7 21.1 19.5 16.0 15.3 15.8 16.4 19.7 18.1 15.5 17.7 16.7 Ceará 19.5 22.5 21.1 17.8 19.0 18.5 18.4 20.9 19.7 17.5 18.7 18.1 Rio Grande do Norte 19.9 23.8 22.0 17.8 19.5 18.8 18.4 21.1 19.9 16.4 20.0 18.3 Paraíba 19.3 21.9 20.7 16.2 18.0 17.2 17.5 19.5 18.6 16.3 17.4 16.9 Pernambuco 18.5 21.8 20.3 14.8 17.7 16.4 17.0 19.4 18.4 16.6 18.7 17.8 Alagoas 18.1 21.7 20.0 13.8 16.5 15.2 16.6 19.1 17.9 15.7 19.5 17.7 Sergipe 18.3 21.8 20.2 16.1 19.1 17.7 17.2 19.8 18.6 16.1 19.1 17.7 Bahia 19.2 23.2 21.3 16.9 19.2 18.1 17.9 21.1 19.6 17.4 19.2 18.3 Minas Gerais 21.1 24.0 22.6 18.6 21.2 20.0 19.8 21.7 20.8 18.1 20.4 19.3 Espírito Santo 21.4 25.4 23.5 20.9 20.5 20.6 20.5 23.9 22.2 18.1 22.5 20.4 Rio de Janeiro 19.5 23.5 21.7 17.5 21.7 19.8 18.4 22.3 20.6 17.9 21.2 19.7 São Paulo 20.4 24.3 22.5 19.2 22.2 20.8 19.3 23.1 21.3 19.0 21.9 20.6 Paraná 20.4 23.5 22.0 16.4 20.3 18.4 18.7 21.5 20.2 17.5 19.2 18.4 Santa Catarina 20.9 25.1 23.1 19.2 20.7 20.0 20.0 23.9 22.0 18.6 20.2 19.5 Rio Grande do Sul 20.2 24.3 22.4 19.0 21.8 20.5 19.2 22.2 20.8 18.6 20.6 19.7 Mato Grosso do Sul 19.8 23.4 21.6 17.9 20.3 19.1 18.8 21.1 20.0 17.6 19.7 18.7 Mato Grosso 19.6 22.4 20.9 17.1 18.7 17.8 18.0 20.0 18.9 17.6 17.9 17.7 Goiás 19.7 22.2 20.9 16.7 19.1 17.9 18.6 19.7 19.1 16.8 16.5 16.6 Federal District 20.5 24.5 22.7 19.3 22.1 20.8 19.4 23.1 21.4 19.2 22.2 20.8 Brazil 19.9 23.4 21.8 17.7 20.4 19.1 18.6 21.7 20.3 17.9 20.2 19.1 M: male; F: female; T: total; SAH: self-assessment of health; Lim: limitation; ADL: activities of daily living; NCD: noncommunicable disease.
a Brazilian Institute of Geography and Statistics (IBGE) – Full board of mortality in Brazil, 2013. Brief analysis of
mortality in the periods 2012–2013 and 1980–2013. Research Directorate Coordination of Population and Social Indicators, 2014.
b Estimates of the HALE using data of the National Survey on Health, 2013, by the Sullivan method according to
the following definitions of unhealthy state:
(1) Self-assessment of bad or very bad health. (2) Has difficulty or is unable to perform the ADL.
Table 2 shows the estimates of life expectancy at 60 years and HALE by sex according to
the FS, considering the diferent deinitions of healthy state. For males, life expectancy at age 60 ranged from 17.7 (Piauí) to 21.4 (Espírito Santo), and was 19.9 in Brazil. he HALE
ranged from 13.8 (Alagoas) to 20.9 (Espírito Santo) for the self-assessment criterion of
bad health, and from 13.5 (Roraima) to 19.2 (Federal District) for the presence of NCD
with intense degree of limitation. For females, the corresponding estimates were always
higher, and ranged from 20.0 (Roraima) to 25.4 (Espírito Santo), from 14.9 (Maranhão) to
22.2 (São Paulo), and from 14.8 (Tocantins) to 22.50 (Espírito Santo), respectively. Due to little variation in the proportion of older people with limitations of functionality by FS in both sexes, the HALE estimated with these criteria follows a sociogeographical pattern similar to that of life expectancy at 60 years.
For the entire Country, the number of years lost by functional limitations in ADL was 1.2
among men, 1.7 among women, and 1.5 for the total. he highest number of lost years
corresponded to the presence of NCD with intense degree of limitation because of the disease, 3.2 among women, and 2.0 among men. Similar results were found for the estimates based on self-perception of health.
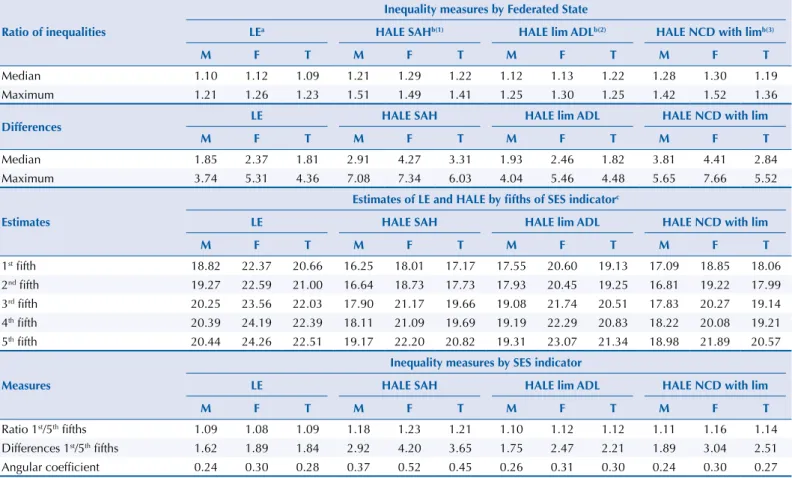
Table 3 shows measures of geographical inequalities and by SES for the outcomes
considered in the study. Regarding the ratio of inequality among the FS, the medians
of ratio were always higher for the HALE than for life expectancy, regardless of the
deinition adopted for healthy state. he maximum ratio of inequality surpassed 1.5, both
Table 3. Measures of geographical inequality and socioeconomic status (SES) in estimates of healthy life expectancy (HALE) at age 60 according to the different definitions of “unhealthy state” per sex. National Survey on Health, 2013.
Ratio of inequalities
Inequality measures by Federated State
LEa HALE SAHb(1) HALE lim ADLb(2) HALE NCD with limb(3)
M F T M F T M F T M F T
Median 1.10 1.12 1.09 1.21 1.29 1.22 1.12 1.13 1.22 1.28 1.30 1.19
Maximum 1.21 1.26 1.23 1.51 1.49 1.41 1.25 1.30 1.25 1.42 1.52 1.36
Differences LE HALE SAH HALE lim ADL HALE NCD with lim
M F T M F T M F T M F T
Median 1.85 2.37 1.81 2.91 4.27 3.31 1.93 2.46 1.82 3.81 4.41 2.84
Maximum 3.74 5.31 4.36 7.08 7.34 6.03 4.04 5.46 4.48 5.65 7.66 5.52
Estimates
Estimates of LE and HALE by fifths of SES indicatorc
LE HALE SAH HALE lim ADL HALE NCD with lim
M F T M F T M F T M F T
1st fifth 18.82 22.37 20.66 16.25 18.01 17.17 17.55 20.60 19.13 17.09 18.85 18.06
2nd fifth 19.27 22.59 21.00 16.64 18.73 17.73 17.93 20.45 19.25 16.81 19.22 17.99
3rd fifth 20.25 23.56 22.03 17.90 21.17 19.66 19.08 21.74 20.51 17.83 20.27 19.14
4th fifth 20.39 24.19 22.39 18.11 21.09 19.69 19.19 22.29 20.83 18.22 20.08 19.21
5th fifth 20.44 24.26 22.51 19.17 22.20 20.82 19.31 23.07 21.34 18.98 21.89 20.57
Measures
Inequality measures by SES indicator
LE HALE SAH HALE lim ADL HALE NCD with lim
M F T M F T M F T M F T
Ratio 1st/5th fifths 1.09 1.08 1.09 1.18 1.23 1.21 1.10 1.12 1.12 1.11 1.16 1.14
Differences 1st/5th fifths 1.62 1.89 1.84 2.92 4.20 3.65 1.75 2.47 2.21 1.89 3.04 2.51
Angular coefficient 0.24 0.30 0.28 0.37 0.52 0.45 0.26 0.31 0.30 0.24 0.30 0.27
M: male; F: female; T: total; SAH: self-assessment of health; Lim: limitation; ADL: activities of daily living; NCD: noncommunicable disease; LE: life expectancy.
a Brazilian Institute of Geography and Statistics (IBGE) – Full board of mortality in Brazil, 2013. Brief analysis of mortality in the periods 2012–2013 and
1980–2013. Research Directorate Coordination of Population and Social Indicators, 2014.
b Estimates of the HALE using data of the National Survey on Health, 2013, by the Sullivan method, according to the following definitions of unhealthy state: (1) Self-assessment of bad or very bad health.
(2) Has difficulty or is unable to perform the ADL.
(3) Has at least a grade or NCD with intense or very intense degree of limitation for usual activities because of the disease.
between male and female seniors, when the “unhealthy state” was deined by the bad self-assessment of health. As to the diferences by FS, the HALE was seven years higher
in one state than in another.
Considering the distribution of the SES indicator considering the older population of each
FS, diferences of three and four years were found, approximately, between the last and irst ifth, for men and women, respectively, in the HALE estimated with the bad or very bad
self-assessment criterion (Table 3).
Concerning the inequality coeicients by socioeconomic level, calculated by the angular coeicient of the regression models adjusted to four outcomes and having the SES indicator as independent variable, we observe positive and signiicant associations
both in life expectancy and in HALE, for both sexes. In addition, when considering the
self-assessment of bad health or functional limitations for the ADL for the deinition of
“unhealthy state,” the gradients by SES are more pronounced than those obtained for life expectancy at 60 years (Table 3 and Figure).
M: male; F: female; T: total; SAH: self-assessment of health; Lim: limitation; ADL: activities of daily living; NCD: noncommunicable disease.
a Brazilian Institute of Geography and Statistics – Full board of mortality in Brazil, 2013. Brief analysis of
mortality in the periods 2012–2013 and 1980–2013. Research Directorate Coordination of Population and Social Indicators, 2014.
b Estimates of the HALE using data of the National Survey on Health, 2013, by the Sullivan method according
to the following definitions of unhealthy state: (1) Self-assessment of bad or very bad health; (2) Has difficulty or is
unable to perform the ADL; (3) Has at least one NCD with intense or very intense degree of limitation to conduct
usual activities because of the disease.
c Number of points obtained in accordance with the goods at the household, educational level of the head of
household and monthly maid.
Figure. Predicted values of life expectancy (LE) and healthy life expectancy (HALE) according to the three definitions of “healthy state” and the indicator of socioeconomic status. National Survey on Health, 2013.
12.5 15.0 17.5 20.0 22.5 25.0 14
16 18 20 22 24
LEa HALE SAHb(1) HALE lim ADLb(2) HALE NCD limb(3)
SES indicator - Number of pointsc
Number of y
DISCUSSION
his article is the irst national study to show inequalities in healthy life expectancy by FS. Regarding the general aspects, the results were consistent with previous studies: although
women live longer than men, they live relatively less years in good health18. In addition to
the variation in life expectancy at birth, marked inequalities in healthy longevity were found among the states of more and less developed regions of Brazil.
To calculate the HALE, we used the Sullivan method, adopting three diferent criteria to deine the unhealthy state. he irst criterion was based on self-assessment of health, since
the expanded concept of health transcends the absence of death, disease and disability, and incorporates concepts of welfare and quality of life. Unlike the medical assessment of the
state of health, which identiies a disease by a set of signs, symptoms and laboratory data, the self-perception of health combines subjective, physical and emotional components of
welfare19. he second criterion was based on the functionality of the older adults, being
understood that the functional limitations to perform the daily activities constitute an important loss in quality of life. Finally, the third criterion was based on the occurrence of intense degree of limitation for carrying out the usual activities due to a NCD.
he results showed high ratio of inequality of HALE at 60 years by FS, always higher than those obtained for the life expectancy, regardless of the indicator used for the deinition of
a healthy state. For the HALE estimated based on bad perception of their own health, the ratio of inequalities reached values above 1.50, meaning that the expected number of years
lived in good health by the older population of a given state can be 50% higher than that of
other state in Brazil.
Regarding inequality coeicients of HALE according to the variable representative of SES, the gradients were all signiicant, both for men and women, and more pronounced
than those obtained for life expectancy, with the exception of estimates calculated by the presence of intense limitation because of some NCD. In the context of the comparison of
estimates of HALE by SES, unhealthy state deinitions based on morbidity do not work
well, because they depend on the access to diagnosis, admittedly uneven by region and area of residence (urban/rural)20.
With the current growth of longevity experienced by populations around the world, the proportion of unhealthy years also tends to increase, and the measures of healthy longevity
becomes even more important. Diferent techniques have been proposed to reine the simple
binary measures of state of health, such as the welfare composite index from Canada based on eight areas of health21. In the case of the HALE calculated with the self-assessment of bad
health, for example, the diferences by SES relect not only the inluence of the sociostructural
determinants, but also the consequences of having a health problem in areas socially disadvantage18. Despite this limitation, the recurring use of self-perception of health comes
from its validity, established by its association with objective measures of health problems6.
In this study, the HALE calculated based on bad self-assessment was the most sensitive to show both geographical inequalities, such as socioeconomic status.
Efects of socioeconomic inequalities on healthy longevity have been highlighted in national
and international studies, with results invariably worse in socially disadvantaged groups.
In Rio de Janeiro, among people aged 65 years or older, the HALE was two times lower in
the sector with the highest concentration of slum population than in the richest area of the city22. In England, in a study that combined health-related quality of life indicators with
mortality data, a diference of 11 years on HALE was found between the worst and the best
ifth socioeconomic status23. Comparative analysis of HALE at 50 years in European countries
from 2005 to 2010 showed growing inequality, explained, possibly by the worsening in living conditions and increased unemployed24.
One of the limitations of this study concerns the sample size of the PNS among individuals
at the age of 70 years. In addition, data on income of the PNS have not yet been disclosed,
restricting the studies on inequality by socioeconomic level to the indicator built from the goods at household and the level of education of the head of household.
With the results of this study, we concluded that not only the mortality indicators are associated with living conditions, but that inequities are even more pronounced when the welfare and the limitations in usual activities are considered, pointing to the necessity to promote actions and programs to decrease the socio-spatial gradient. In the current epidemiological context, the development of local strategies is essential not only to provide assistance to all people in need of care, but also to support the policies of prevention and the adoption of healthy behaviors, essential to achieve longevity with quality.
REFERENCES
1. United Nations, Department of Economic and Social Affairs, Population Division. World Population Ageing 2013. New York: United Nations Publications; 2013. (ST/ESA/SER.A/348). 2. Global Burden of Disease Study 2013 Collaborators. Global, regional, and national incidence,
prevalence, and years lived with disability for 301 acute and chronic diseases and injuries in 188 countries, 1990-2013: a systematic analysis for the Global Burden of Disease Study 2013.
Lancet. 2015;386(9995):743-800. https://doi.org/10.1016/S0140-6736(15)60692-4. 3. Asada Y, Ohkusa Y. Analysis of health-related quality of life (HRQL), its distribution, and
its distribution by income in Japan, 1989 and 1998. Soc Sci Med. 2004;59(7):1423-33.
https://doi.org/10.1016/j.socscimed.2004.01.025.
4. Luy M, Minagawa Y. Gender gaps: life expectancy and proportion of life in poor health.
Health Rep. 2014;25(12):12-9.
5. Schmidt MI, Duncan BB, Azevedo e Silva G, Menezes AM, Monteiro CA, Barreto SM, et al.
Chronic non-communicable diseases in Brazil: burden and current challenges. Lancet.
2011;377(9781):1949-61. https://doi.org/10.1016/S0140-6736(11)60135-9.
6. Theme Filha MM, Souza Junior PR, Damacena GN, Szwarcwald CL. Prevalence of chronic non-communicable diseases and association with self-rated health: National Health Survey, 2013.
Rev Bras Epidemiol. 2015;18 Supl 2:83-96. https://doi.org/10.1590/1980-5497201500060008. 7. Leite IC, Valente JG, Schramm JMA, Daumas RP, Rodrigues RN, Santos MF, et al. Burden
of disease in Brazil and its regions, 2008. Cad Saude Publica. 2015;31(7):1551-64.
https://doi.org/10.1590/0102-311X00111614.
8. Meireles AL, Xavier CC, Andrade ACS, Friche AAL, Proietti FA, Caiaffa WT. Self-rated health in urban adults, perceptions of the physical and social environment, and reported
comorbidities: The BH Health Study. Cad Saude Publica. 2015;31 Supl 1:120-35.
https://doi.org/10.1590/0102-311X00076114.
9. Camargos MCS, Gonzaga MR. Viver mais e melhor? Estimativas de expectativa de
vida saudável para a população brasileira. Cad Saude Publica. 2015;31(7):1460-72.
https://doi.org/10.1590/0102-311X00128914.
10. Campolina AG, Adami F, Santos JLF, Lebrão ML. A transição de saúde e as mudanças na expectativa
de vida saudável da população idosa: possíveis impactos da prevenção de doenças crônicas. Cad
Saude Publica. 2013;29(6):1217-29. https://doi.org/10.1590/S0102-311X2013000600018.
11. Sullivan DF. A single index of mortality and morbidity. HSMHA Health Rep. 1971;86(4):347-54.
https://doi.org/10.2307/4594169.
12. Romero DE, Leite IC, Szwarcwald CL. Healthy life expectancy in Brazil: applying the Sullivan method.
Cad Saude Publica. 2005;21 Supl 1:S7-18. https://doi.org/10.1590/S0102-311X2005000700002. 13. Mathers CD, Iburg KM, Salomon JA, Tandon A, Chatterji S, Ustün B, et al. Global
patterns of healthy life expectancy in the year 2002. BMC Public Health. 2004;4:66.
https://doi.org/10.1186/1471-2458-4-66.
14. Camargos MCS, Rodrigues RN, Machado CJ. Expectativa de vida saudável para idosos brasileiros,
2003. Cienc Saude Coletiva. 2009;14(5):1903-9. https://doi.org/10.1590/S1413-81232009000500032.
15. Victora CG, Barreto ML, Leal MC, Monteiro CA, Schmidt MI, Paim J, et al. Health conditions
and health-policy innovations in Brazil: the way forward. Lancet. 2011;377(9782):2042-53.
16. Souza Júnior PRB, Freitas MPS, Antonaci GA, Szwarcwald CL. Desenho da amostra
da Pesquisa Nacional de Saúde 2013. Epidemiol Serv Saude. 2015;24(2):207-16.
https://doi.org/10.5123/S1679-49742015000200003.
17. Schneider MC, Castillo-Salgado C, Bacallao J, Loyola E, Mujica OJ, Vidaurre M, et al. Métodos
de medición de las desigualdades de salud. Rev Panam Salud Publica. 2002;12(6):398-415.
https://doi.org/10.1590/S1020-49892002001200006.
18. Belon AP, Lima MG, Barros MB. Gender differences in healthy life expectancy among Brazilian
elderly. Health Qual Life Outcomes. 2014;12:88. https://doi.org/10.1186/1477-7525-12-88.
19. Blank N, Diderichsen F. The prediction of different experiences of longterm illness: a
longitudinal approach in Sweden. J Epidemiol Community Health. 1996;50(2):156-61.
https://doi.org/10.1136/jech.50.2.156.
20. Silva ZP, Ribeiro MCSA, Barata RB, Almeida MF. Perfil sociodemográfico e padrão de utilização
dos serviços de saúde do Sistema Único de Saúde (SUS), 2003-2008. Cienc Saude Coletiva.
2011;16(9):3807-16. https://doi.org/10.1590/S1413-81232011001000016.
21. Muhajarine N, Labonte R, Winquist BD. The Canadian Index of Wellbeing: key findings from the
healthy populations domain. Can J Public Health. 2012;103(5):e342-7.
22. Szwarcwald CL, Mota JC, Damacena GN, Pereira TGS. Health inequalities in Rio de Janeiro, Brazil: lower healthy life expectancy in socioeconomically disadvantaged areas.
Am J Public Health. 2011;101(3):517-23. https://doi.org/10.2105/AJPH.2010.195453.
23. Newton JN, Briggs AD, Murray CJ, Dicker D, Foreman KJ, Wang H, et al. Changes in health in England, with analysis by English regions and areas of deprivation, 1990-2013: a systematic
analysis for the Global Burden of Disease Study 2013. Lancet. 2015;386(10010):2257-74.
https://doi.org/10.1016/S0140-6736(15)00195-6.
24. Fouweather T, Gillies C, Wohland P, Van Oyen H, Nusselder W, Robine JM, et al. Comparison of socio-economic indicators explaining inequalities in Healthy Life Years at age 50 in Europe:
2005 and 2010. Eur J Public Health. 2015;25(6):978-83. https://doi.org/10.1093/eurpub/ckv070.