The Mini Mental State Examination
Review of cutoff points adjusted for schooling
in a large Southern Brazilian sample
Renata Kochhann
1,2, Juliana Santos Varela
2,
Carolina Saraiva de Macedo Lisboa
3, Márcia Lorena Fagundes Chaves
2,4Abstract – The increase in life expectancy can influence the prevalence of dementias in the population. Instruments that evaluate cognitive functions such as the Mini Mental State Examination (MMSE) are necessary for the investigation of dementia. The supposition that patient score on the MMSE can be influenced by academic level points to the need for establishing cut-off values that take into account educational level. The aim of this study was to review MMSE cut-off values adjusted for schooling in a large southern Brazilian sample. Method:
Demographic data and MMSE scores of 968 subjects, of which 162 were dementia patients and 806 healthy participants, were analyzed. The sample was grouped according to education. The cut-off values were established by ROC Curve analysis. Results: The total sample mean age was 70.6±7.3 years, and the mean years of education was 7.2±5.3. The cut-off score of 23 points (sensitivity=86%, specificity=83%) was observed as the optimal level to detect dementia on the MMSE instrument for the overall sample. Regarding level of schooling, the cut-off values were: 21 for the illiterate group (sensitivity=93%, specificity=82%), 22 for the low education group (sensitivity=87%, specificity=82%), 23 for the middle education group (sensitivity=86%, specificity=87%) and 24 for the high education group (sensitivity=81%, specificity=87%). Conclusions: The cut-off values revealed by this analysis, and adjusted for level of schooling, can improve the clinical evaluation of cognitive deficits.
Key words: Mini Mental State Examination, cognition, cognitive assessment, educational attainment, cutoffs.
Mini Exame do Estado Mental: revisão de pontos de corte ajustados para a escolaridade em uma grande amostra do sul do Brasil
Resumo – A elevação da expectativa de vida pode influenciar na prevalência das demências na população. Instrumentos que avaliem as funções cognitivas, como o Mini Exame do Estado Mental (MEEM), são necessários para a investigação de demência. A suposição de que o resultado do MEEM de um paciente pode ser influenciado pelo nível de escolaridade demonstra a necessidade do estabelecimento de pontos de corte que levem em consideração a escolaridade. O objetivo deste estudo foi revisar os pontos de corte do MEEM ajustados para a escolaridade em uma grande amostra do sul do Brasil. Método: Dados demográficos e escores do MEEM de 968 indivíduos, 162 pacientes com demência e 806 participantes saudáveis foram analisados. A amostra foi agrupada de acordo com a educação. Para estabelecer os pontos de corte foi utilizada a Curva ROC. Resultados:
A média de idade da amostra total foi 70,6±7,3 e a média de anos de estudo foi 7,2±5,3. O ponto de corte 23 (sensibilidade=86%), (especificidade=83%) foi o ponto que melhor detectou demência na amostra total. Considerando o nível de escolaridade, os pontos de corte foram: 21 no grupo de analfabetos (sensibilidade=93%, especificidade=82%), 22 no grupo de baixa escolaridade (sensibilidade=87%, especificidade=82%), 23 no grupo de média escolaridade (sensibilidade=86%, especificidade=87%) e 24 no grupo de alta escolaridade (sensibilidade=81%, especificidade=87%). Conclusões: Os pontos de corte, quando se considera a escolaridade, podem aperfeiçoar a avaliação clínica dos déficits cognitivos.
Palavras-chave: Mini Exame do Estado Mental, cognição, avaliação cognitiva, nível educacional, pontos de corte.
1Medical Sciences Post-Graduate Course, UFRGS School of Medicine. 2Dementia Clinic, Neurology Service, Hospital de Clínicas de Porto Alegre. 3Internal
Psychology Department, UNISINOS School of Psychology. 4Internal Medicine Department, UFRGS School of Medicine.
Márcia L.F. Chaves – Rua Ramiro Barcelos 2350 / sala 2040 - 90035-091 Porto Alegre RS - Brazil. Email: [email protected]
Disclosure: The authors report no conflicts of interest.
The significant increase in the elderly population in
recent years because of greater life expectancy, has led to
an increase in the prevalence of dementias.
1These diseases
occur mainly during the aging process and increase
expo-nentially as a function of age. The dementias affect around
5% of the population above 65 years of age and, among
individuals aged 80 years, this frequency may reach 20%
to 25% of the population.
2The dementias are syndromes
characterized by a decline in cognitive functions that leads
to a significant impairment in the activities of daily living,
representing a decline compared to previous superior level
of functioning.
3Instruments that evaluate cognitive functions, such as
the Mini Mental State Examination (MMSE) are necessary
for the corroboration of cognitive deficits.
4-6The MMSE
is a screening test that should be used in individuals with
suspected cognitive deficit, but it cannot be used to
diag-nose dementia. Dementia diagnosis should be made based
on classification systems such as the International
Statisti-cal Classification of Diseases and Related Health Problems
(ICD-10) and the Diagnostic and Statistical Manual of
Mental Disorders (DSM-IV).
Since it was developed, the MMSE has been studied
with different focus of interest. There are studies reporting
research data where the MMSE is a component of a
bat-tery of tests to detect dementia cases.
7-10Other studies have
focused on the performance of the MMSE in the general
population.
11-15In 1982, Anthony and coworkers
16showed the results of
sensitivity (87%) and specificity (82%) for the cutoff (23
case/24 non case) on the MMSE to detect dementia, and
the cutoff they proposed is still used worldwide.
17-21Tombaugh and coworkers (1992)
22published a review
of the MMSE. The authors showed that a higher level of
Cronbach’s Alfa coefficent (0.96) was obtained in a mixed
group of patients, while the intermediate values of 0.68 and
0.77 were found in samples drawn from the community.
The review concluded that the MMSE could be used to
eval-uate severity quantitatively of a cognitive deficit as well as
changes over time, as was suggested in its development, but
could not be used as a single tool for diagnosing dementia.
Fratiglioni and coworkers (1993)
23presented data
show-ing that people with lower levels of education had lower
scores on the MMSE, justifying the use of different cutoffs,
adjusted for schooling years. By applying this method, these
authors achieved no diagnostic mistakes in the dementia
cases. Applying this notion, other studies have taken into
account educational level or age to produce different
cut-offs for the detection of dementia. However, there are no
standard cutoffs for the MMSE with regards to education,
since each study suggested different cutoffs.
20,24-28In Brazil, because the number of individuals with lower
levels of education is large, adjusting cutoffs to schooling
is very important to decrease false positives.
3,20,21,26,28,29The
present study aimed to review cutoffs adjusted for
educa-tional level in a large southern Brazilian sample composed
of healthy participants and dementia patients.
Methods
Sample selection
A cross-sectional study was conducted in a sample of
162 dementia patients and 806 healthy participants. The
dementia patients were recruited from the Dementia
Clin-ic, Neurology Service, Hospital de Clínicas de Porto Alegre,
and fulfilled the DSM-IV criteria for dementia,
Alzheim-er’s disease and vascular dementia.
3Healthy participants
were randomly selected from different sectors of the same
hospital (relatives, caregivers and visitors). The inclusion
criteria for healthy participants were to be functionally
independent and cognitively healthy on the Clinical
De-mentia Rating scale (CDR=0).
30The exclusion criteria were
presence of any psychiatric or neurological disease and use
of psychoactive drugs. All participants underwent
evalu-ation with the Mini Mental State Examinevalu-ation (MMSE),
Brazilian version.
26The total sample comprised 633 women (65%), had a
mean age of 70.6±7.3 years (range: 60-92) and mean years
of education of 7.2±5.3 (range: 0-35). Forty percent of
de-mentia patients had mild dede-mentia (CDR=1), 43%
moder-ate dementia (CDR=2) and 17% severe dementia.
To review the cutoffs adjusted for schooling, the
partici-pants were subdivided into 4 groups: illiterate, lower
edu-cational level (1-5 years), middle eduedu-cational level (6-11
years) and higher educational level (
≥
12 years). These
cri-teria have been analyzed in a previous study,
31but for this
study illiterates formed a separate group.
The groups were composed of 15 dementia patients
and 57 healthy participants (illiterate group), 77 dementia
patients and 338 healthy participants (lower educational
level group), 43 dementia patients and 234 healthy
partici-pants (middle educational level group) and 27 dementia
patients and 177 healthy participants (higher educational
level group).
Mental state evaluation
The Mini Mental State Examination is a tool for cognitive
screening used worldwide for global evaluation.
6,7,24,32-34. It was
developed by Folstein et al. in 1975
35and has versions in
dif-ferent languages and countries.
7-9,11-13,17-19,24,25,34,36There are
also versions validated for the Brazilian population.
26,29,37was named “mini” because it focuses only on the
cogni-tive aspects of mental functions and excludes questions
about mood, abnormal mental phenomena and thought
patterns.
35The MMSE evaluates several cognitive domains:
tem-poral and spatial orientation, working and immediate
memory, attention and calculus, naming of objects,
repeti-tion of a sentence, execurepeti-tion of commands, comprehension
and writing task execution, comprehension and verbal task
execution, planning and praxis.
In all items, each correct answer scores one point and
each incorrect answer scores zero. The maximum score that
can be obtained is thirty and the minimum is zero. The
lower the score, the more significant is the impairment.
The MMSE was recommended as a screening tool for
global cognitive testing by the Brazilian Academy of
Neu-rology
38and by the American Academy of Neurology.
39Statistical analysis
Descriptive statistics (mean, SD, and relative frequency)
were calculated for demographic data and MMSE. Student’s
t test was used for comparison of parametric data, and the
Chi-square test for categorical data. ROC curves
(Receiver-Operating Characteristic Curves) were constructed to
es-tablish the cutoff points.
The statistical analysis was carried out with the
Statisti-cal Package for the Social Sciences
for Windows version 13.0
(SPSS Inc., Chicago, IL, USA.). Sensitivity, specificity,
posi-tive and negaposi-tive predicposi-tive values, and their 95%
confi-dence interval levels for cutoff points were calculated using
the Epicalc package from R project for Statistical
Comput-ing 2.8.1 (R Foundation, Auckland, New Zealand).
The study was approved by the Ethics Committee for
Medical Research of Hospital de Clínicas de Porto Alegre.
All subjects signed an informed consent before being
en-rolled in the study.
Results
The majority of the demographic variables were
sig-nificantly different between the dementia patients and the
healthy participants group. The age of dementia patients
and healthy participants were not significantly different in
the lower education, middle education and higher
edu-cation groups, Also, in the illiterate and higher eduedu-cation
groups, the sex of the dementia patients and the healthy
participants were also not significantly different.
Demo-graphic data of the sample is presented in Table 1.
According to the ROC curve analysis, the
Brazilian-Portuguese MMSE version presented high diagnostic
ac-curacy for identifying dementia in this sample (AUC=0.92,
95% CI=0.89-0.94) (Figure 1). The optimal cutoffs were
determined by finding the values that allowed the best
bal-ance between sensitivity and specificity. For the majority of
the cutoffs, the sensitivity was higher than the specificity
because MMSE is a mental state screening instrument.
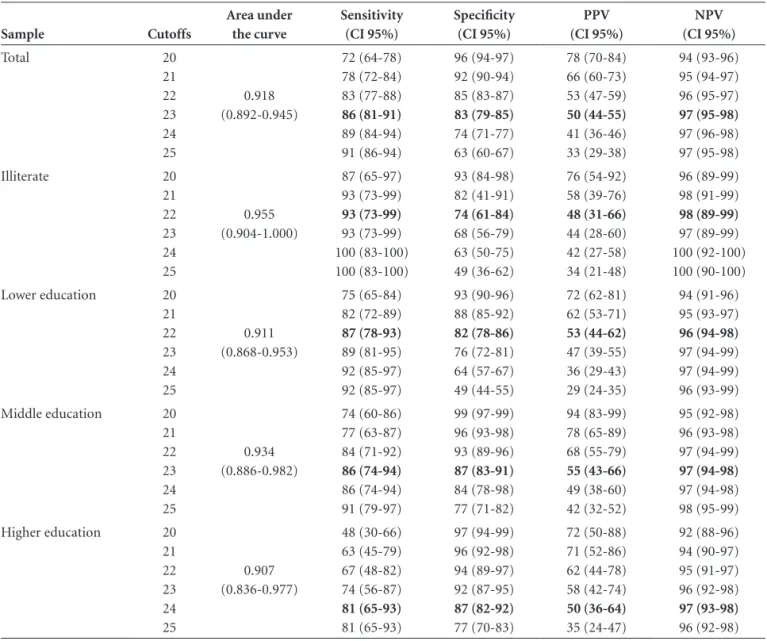
A range of possible cutoff values is shown in Table 2.
The cutoff of 23 in the total sample yielded a sensitivity of
86%, specificity of 83%, a 50% positive predictive value
and 97% negative predictive value. In the illiterate group,
the cutoff of 21 yielded sensitivity of 93%, specificity of
Table 1. Demographic data on dementia patients and healthy elderly participants in the total sample by educational level.
Sample Demographic variables Dementia patients Healthy participants P value
Total Age* (mean (SD)) Sex** Female (N (%))
Educational level* (mean (SD)) MMSE* (mean (SD))
72.1 (7.7) 84 (52) 6.1 (4.3) 16.7 (6.7)
70.3 (7.2) 549 (68) 7.4 (5.4) 26.3 (3.0)
0.005
<001
0.002
<001
Illiterate Age* (mean (SD)) Sex** Female (N (%)) MMSE* (mean (SD))
76.5 (7.3) 11 (73) 15.0 (5.7)
66.7 (6.3) 50 (88) 25.2 (3.3)
<001
0.168
<001
Lower education Age* (mean (SD)) Sex** Female (N (%)) MMSE* (mean (SD))
71.1 (6.7) 37 (48) 16.4 (6.4)
70.3 (7.1) 240 (71) 25.4 (3.1)
0.353
<001
<001
Middle education Age* (mean (SD)) Sex** Female (N (%)) MMSE* (mean (SD))
71.6 (8.7) 23 (53) 16.6 (7.1)
70.8 (7.1) 171 (73) 27.1 (2.6)
0.564
0.010
<001
Higher education Age* (mean (SD)) Sex** Female (N (%)) MMSE* (mean (SD))
73.2 (7.5) 13 (48) 18.6 (7.1)
70.9 (7.5) 88 (49) 27.4 (2.7)
0.155 0.879
<001
82%, a 58% positive predictive value and 98% negative
predictive value. In the lower education group, the cutoff
of 22 yielded sensitivity of 87%, specificity of 82%, a 53%
positive predictive value and 96% negative predictive value.
For the middle education group, the cutoff of 23 showed
sensitivity of 86%, specificity of 87%, a 55% positive
pre-dictive value and 97% negative prepre-dictive value. Finally, for
the higher education group, the cutoff of 24 showed
sensi-tivity of 81%, specificity of 87%, a 50% positive predictive
value and 97% negative predictive value.
Discussion
The present study was carried out to review cutoffs
adjusted for education in a southern Brazilian sample. A
ROC Curve was built to establish the MMSE cutoffs. The
cutoffs presented in the results showed the best balance of
sensitivity and specificity values. To determine most of the
cutoffs, we focused on the sensitivity, to keep the MMSE
characteristic of a screening instrument. However, for some
cutoffs we could not emphasize sensitivity because this lost
specificity without increment of PPV or NPV.
The best cutoff in the total sample was 23, with
sensi-tivity of 86% and specificity of 83%. This cutoff has been
used worldwide.
17-21The best cutoff for the illiterate group
was 21 and the best cutoffs for the lower, middle and higher
educational level groups were 22, 23 and 24, respectively.
The sensitivity values of these cutoffs were 93%, 87%, 86%
and 81%, respectively. The specificity values of these
cut-offs were 82% for the cutcut-offs 21 and 22, and 87% for the
cutoffs 23 and 24. These MMSE cutoff points showed good
diagnostic results for detecting dementia.
Most of the demographic variables differed significantly
Table 2. Cut-off score on the Mini Mental State Examination obtained from coordinates of the ROC curve, and corresponding sensitivity, specificity, Positive Predictive Value (PPV) and Negative Predictive Value (NPV).
Sample Cutoffs Area under the curve Sensitivity (CI 95%) Specificity (CI 95%) PPV (CI 95%) NPV (CI 95%) Total 20 21 22 23 24 25 0.918 (0.892-0.945) 72 (64-78) 78 (72-84) 83 (77-88) 86 (81-91) 89 (84-94) 91 (86-94) 96 (94-97) 92 (90-94) 85 (83-87) 83 (79-85) 74 (71-77) 63 (60-67) 78 (70-84) 66 (60-73) 53 (47-59) 50 (44-55) 41 (36-46) 33 (29-38) 94 (93-96) 95 (94-97) 96 (95-97) 97 (95-98) 97 (96-98) 97 (95-98) Illiterate 20 21 22 23 24 25 0.955 (0.904-1.000) 87 (65-97) 93 (73-99) 93 (73-99) 93 (73-99) 100 (83-100) 100 (83-100) 93 (84-98) 82 (41-91) 74 (61-84) 68 (56-79) 63 (50-75) 49 (36-62) 76 (54-92) 58 (39-76) 48 (31-66) 44 (28-60) 42 (27-58) 34 (21-48) 96 (89-99) 98 (91-99) 98 (89-99) 97 (89-99) 100 (92-100) 100 (90-100) Lower education 20
21 22 23 24 25 0.911 (0.868-0.953) 75 (65-84) 82 (72-89) 87 (78-93) 89 (81-95) 92 (85-97) 92 (85-97) 93 (90-96) 88 (85-92) 82 (78-86) 76 (72-81) 64 (57-67) 49 (44-55) 72 (62-81) 62 (53-71) 53 (44-62) 47 (39-55) 36 (29-43) 29 (24-35) 94 (91-96) 95 (93-97) 96 (94-98) 97 (94-99) 97 (94-99) 96 (93-99) Middle education 20
21 22 23 24 25 0.934 (0.886-0.982) 74 (60-86) 77 (63-87) 84 (71-92) 86 (74-94) 86 (74-94) 91 (79-97) 99 (97-99) 96 (93-98) 93 (89-96) 87 (83-91) 84 (78-98) 77 (71-82) 94 (83-99) 78 (65-89) 68 (55-79) 55 (43-66) 49 (38-60) 42 (32-52) 95 (92-98) 96 (93-98) 97 (94-99) 97 (94-98) 97 (94-98) 98 (95-99) Higher education 20
between the dementia patients and the healthy participants.
However, these characteristics did not influence the
estab-lishment of the coordinates in the ROC curve analysis.
The present study showed results that corroborated
the need for different cutoffs which take into account the
educational level when evaluating cognitive deficits. This
differentiation is important to prevent mistaken diagnosis
of dementia cases.
23,26Misdiagnosis of healthy individuals
as dementia patients may cause distress for the subject and
their family, besides unnecessary expenses.
Examining previous investigations conducted in Brazil,
which also considered the educational level and reported
sensitivity and specificity for different cutoffs, reveals that
each study used different tests for the determination of
the cutoff points, and the division of the educational
lev-els was also different. Bertolucci and coworkers
26used the
Kolmogorov-Smirnov test to select the cutoff points. Their
results were: 13 for the illiterate group (Sensitivity=82.4%,
Specificity=97.5%), 18 for lower educational level
group (Sensitivity=75.6%, Specificity=96.6%) and 26
for middle educational level group (Sensitivity=80%,
Specificity=95.6%). Almeida
20used contingence 2x2 tables
to determine the values of sensitivity and specificity for the
cutoffs and suggested a cutoff of 19/20 for illiterate elderly
people (Sensitivity=80%, Specificity=71%) and 23/24 for
elderly with some level of education (Sensitivity=84%,
Specificity=60%). Lourenço and Veras
34used, as did the
present study, a ROC curve to select the cutoff points,
suggesting a cutoff of 18/19 for illiterate individuals
(Sensitivity=73.5%, Specificity=73.9%) and 24/25 for
in-dividuals with some educational level (Sensitivity=75%,
Specificity=69.7%).
A limitation of our study was the small number of
de-mentia patients in the sample. When the sample was
sub-divided by educational level, few dementia patients fell into
each group, especially in the middle and higher education
groups, compared to the great number of healthy elders.
Besides educational attainment, cognitive evaluation
performance may be influenced by a number of other
fac-tors such as previous abilities, social and cultural contexts,
language, interviewer training, and the environment in
which the test is run.
It is important to note that elderly individuals’
com-plaints on cognitive problems are not predictive of objective
cognitive decline
40and that subjects with an objective
de-cline may not present a cognitive complaint.
41Therefore, it is
important that the evaluation of cognitive aspects become a
part of the routine medical evaluation of elderly patients.
40,41As we showed in our previous study
31, primary
edu-cation in Brazil is highly heterogeneous with regional
characteristics, a factor interfering in studies that evaluate
cognitive performance. The sociological studies and
educa-tional evaluations have shown that the educaeduca-tional systems
reflect social inequalities, and result in different learning
outcomes for the same number of years of schooling.
42This
characteristic ultimately limits the use of universal cutoff
points and raises the importance of regional studies.
Acknowledgments –
Renata Kochhann received
sup-ported from CAPES (Brazil). We thank the CAPES for
providing the scholarship to Renata Kochhann.
References
1. Charchat H, Nitrini R, Caramelli P, Sameshima K. Investiga-ção de marcadores clínicos dos estágios iniciais da doença de Alzheimer com testes neuropsicológicos computadorizados. Psicol Reflex Crít 2001;14:305-316.
2. Von Strauss EM, Viitanen D, De Ronchi D, et al. Aging and the occurrence of dementia. Arch Neurol 1999;56:587-592. 3. Manual diagnóstico e estatístico de transtornos mentais. 4.
ed. Porto Alegre: Artes Médicas; 1995.
4. Almeida OP. Instrumentos para avaliação de pacientes com demência. Rev Psiq Clín 1999;26:78-89.
5. Argimon IIL, Timm LA, Rigoni MS, Oliveira MS. Instrumen-tos de avaliação de memória em idosos: uma revisão. Rev Bras Ciên Envelh Hum 2005;(jul./dez):28-35.
6. Bustamante SEZ, Bottino CMC, Lopes MA, et al.
Instrumen-Diagonal segments are produced by ties.
Se
ns
iti
vi
ty
0.0 1.0
0.8
0.6
0.4
0.2
0.0
0.2 0.4 0.6 0.8 1.0
1 - Specificity ROC Curve
tos combinados na avaliação de demência em idosos: resulta-dos preliminares. Arq Neuropsiquiatr 2003;61:601-606. 7. Jacqmin-Gadda H, Fabrigoule C, Commenges D, Letenneur
L, Dartigues JF. A cognitive screening battery for dementia in the elderly. J Clin Epidemiol 2000;53:980-987.
8. Ardila A, Ostrosky-Solis F, Rosselli M, Gómez C. Age-related cognitive decline during normal aging: the complex effect of education. Arch Clin Neuropsychol 2000;15:495-513. 9. Köhler L, Siegfried W, Schäufele M. Proxy screening tools
im-prove the recognition of dementia in old-age homes: results of a validation study. Age Ageing 2007;36:549-554.
10. Chaves MLF, Ilha D, Maia ALG, Motta E, Lehmen R, Oliveira LM. Diagnosing dementia and normal aging: clinical rele-vance of brain ratios and cognitive performance in a Brazilian sample. Braz J Med Biol Res 1999;32:1133-1143.
11. Grigoletto F, Zappalà G, Anderson DW, Lebowitz B. Norms for the Mini-Mental State Examination in a healthy popula-tion. Neurology 1999;53:315-320.
12. Zhou DF, Wu CS, Qi H, et al. Prevalence of dementia in ru-ral China: Impact of age, gender and education. Acta Neurol Scand 2006;114:273-280.
13. Chatfield M, Matthews FE, Brayne C and Medical Research Council Cognitive Function and Ageing Study. Using the Mini-Mental State Examination for tracking cognition in the older population based on longitudinal data. J Am Geriatr Soc 2007;55:1066-1071.
14. Espino DV, Lichtenstein MJ, Palmer RF, Hazuda HP. Evalua-tion of the Mini-Mental State ExaminaEvalua-tion’s internal consis-tency in a community-based sample of Mexican-American and European-American elders: results from the San Antonio longitudinal study of aging. J Am Geriatr Soc 2004;52:822-827. 15. Laks J, Baptista EMR, Contino ALB, Paula EO, Engelhardt E. Mini-Mental State Examination norms in a community-dwelling sample of elderly with lower schooling in Brazil. Cad Saúde Públ 2007;23:315-319.
16. Anthony JC, LeResche L, Niaz U, Von Korff MR, Folstein MF. Limits of the ‘Mini-Mental State’ as a screening test for de-mentia and delirium among hospital patients. Psychol Med 1982;12:397-408.
17. Di Carlo A, Baldereschi M, Amaducci L, et al. Incidence of dementia, Alzheimer’s disease, and vascular dementia in Italy: The ILSA study. J Am Geriatr Soc 2002;50:41-48.
18. Aevarsson O, Skoog I. A longitudinal population study of the Mini-Mental State Examination in the very old: relation to dementia and education. Dement Geriatr Cogn Disord 2000; 11:166-175.
19. Black SA, Espino DV, Mahurin R, et al. The influence of non-cognitive factors on the Mini-Mental State Examination in Older Mexican-Americans: findings from the hispanic EPESE. J Clin Epidemiol 1999;52:1095-1102.
20. Almeida OP. The Mini-Mental State Examination and the
di-agnosis of dementia in Brazil. Arq Neuropsiquiatr 1998;56: 605-612.
21. Machado JC, Ribeiro RCL, Leal PFG, Cotta RMM. Avaliação do declínio cognitivo e sua relação com as características so-cioeconômicas dos idosos em Viçosa-MG. Rev Bras Epidemiol 2007;10:592-605.
22. Tombaugh TN, McIntyre NJ. The Mini-Mental State Exami-nation: a comprehensive review. J Am Geriatr Soc 1992;40: 922-935.
23. Fratiglioni L, Jorm AF, Grut M, et al. Predicting dementia from the Mini-Mental State Examination in an elderly population: the role of education. J Clin Epidemiol 1993; 46:281-287. 24. Kahle-Wrobleski K, Corrada MM, Li B, Kawas CH. Sensitiv-ity and specificSensitiv-ity of the Mini-Mental State Examination for identifying dementia in the oldest-old: the 90+ study. J Am Geriatr Soc 2007;55:284-289.
25. Rakusa M, Granda G, Kogoj A, Mlakar J, Vodusek DB. Mini-Mental State Examination: standardization and validation for the elderly Slovenian population. Eur J Neurol 2006;13:141-145. 26. Bertolucci PHF, Brucki SMD, Campacci SR, Juliano Y. O mini-exame do estado mental em uma população geral: impacto da escolaridade. Arq Neuropsiquiatr 1994;52:1-7.
27. Uhlmann RF, Larson EB. Effect of education on the Mini-Mental State Examination as a screening test for dementia. J Am Geriatr Soc 1991;39:876-880.
28. Brucki SMD, Nitrini R, Caramelli P, Bertolucci PHF, Okamoto IH. Sugestões para o uso do Mini-Exame do Estado Mental no Brasil. Arq Neuropsiquiatr 2003;61:777-781.
29. Brito-Marques PR, Cabral-Filho JE. The role of education in Mini-Mental State Examination: a study in Northeast Brazil. Arq Neuropsiquiatr 2004;62:206-211.
30. Chaves ML, Camozzato A, Godinho C, et al. Validity of the Clinical dementia rating scale for the detection and staging of dementia in Brazilian patients. Alz Dis Assoc Disord 2007; 21:210-217.
31. Kochhann R, Cerveira MO, Godinho C, Camozzato A, Chaves MLF. Evaluation of Mini-Mental State Examination scores ac-cording to different age and education strata and sex. Dement Neuropsychol 2009;3:88-93.
32. Holsinger T, Deveau J, Boustani M, Williams JW. Does this patient have dementia? JAMA 2007;297:2391-2404.
33. Leon J, Pearlman O, Doonan R, Simpson GM. A Study of bedside screening procedures for cognitive deficits in chronic psychiatric inpatients. Compreh Psychiatry 1996;37:328-335. 34. Lourenço RA, Veras RP. Mini-Mental State Examination: psy-chometric characteristics in elderly outpatients. Rev Saúde Pública 2006;40:1-8.
35. Folstein MF, Folstein SE, McHugh PR. “Mini-Mental State”: a practical method for grading the cognitive state of patients for the clinician. J Psychiatr Res 1975;12:189-198.
of education and gender on the attention items of the Mini-Mental State Examination in Spanish speaking Hispanic el-ders. Arch Clin Neuropsychol 2006;21:677-686.
37. Chaves MLF, Izquierdo IA. Differential diagnosis between de-mentia and depression: a study of efficiency increment. Acta Neurol Scand 1992;85:378-382.
38. Nitrini R, Caramelli P, Bottino CMC, Damasceno BP, Brucki SMD, Anghinah R. Diagnóstico de doença de Alzheimer no Brasil. Avaliação cognitiva e funcional: aDepartamento Científico de Neurologia Cognitiva e do Envelhecimento da Academia Brasileira de Neurologia. Arq Neuropsiquiatr 2005; 63:720-727.
39. Petersen RC, Stevens JC, Ganguli M, Tangalos EG, Cum-mings JL, DeKosky ST. Practice parameter: early detection of dementia: mild cognitive impairment (an evidence-based review) report of the quality standards subcommittee of
the American Academy of Neurology. Neurology 2001;56: 1133-1142.
40. Kochhann R, Camozzato AL, Godinho C, Cerveira MO, For-ster LMK, Chaves MLF. Cognitive complaints compared to performance on a mental status screening test in elderly out-patients. Dement Neuropsychol 2008;2:46-51.
41. Vitiello APP, Ciríaco JGM, Takahashi DY, Nitrini R, Caramelli P. Avaliação cognitiva breve de pacientes atendidos em am-bulatório de neurologia geral. Arq Neuropsiquiatr 2007;65: 299-303.