CLINICAL SCIENCE
A proton nuclear magnetic resonance-based
metabonomics study of metabolic profiling in
immunoglobulin a nephropathy
Weiguo Sui,ILiping Li,I,IIWenti Che,IGuimai Zuo,IJiejing Chen,IWuxian Li,III Yong DaiI,IV
I181stHospital Guangxi, Central Laboratory, Laboratory of Metabolic Diseases Research, Guangxi Province, China.IIGuangxi Normal University, the Life Science College, Guangxi Province, China.IIIKey Laboratory of Laboratory Medical Diagnostics of Education Ministry, Chongqiong Medical University, Chongqing, China.IVClinical Medical Research Center, the Second Clinical Medical College of Jinan University (Shenzhen People’s Hospital), Shenzhen, Guangdong Province, China.
OBJECTIVES: Immunoglobulin A nephropathy is the most common cause of chronic renal failure among primary glomerulonephritis patients. The ability to diagnose immunoglobulin A nephropathy remains poor. However, renal biopsy is an inconvenient, invasive, and painful examination, and no reliable biomarkers have been developed for use in routine patient evaluations. The aims of the present study were to identify immunoglobulin A nephropathy patients, to identify useful biomarkers of immunoglobulin A nephropathy and to establish a human immunoglobulin A nephropathy metabolic profile.
METHODS: Serum samples were collected from immunoglobulin A nephropathy patients who were not using immunosuppressants. A pilot study was undertaken to determine disease-specific metabolite biomarker profiles in three groups: healthy controls (N = 23), low-risk patients in whom immunoglobulin A nephropathy was confirmed as grades I-II by renal biopsy (N = 23), and high-risk patients with nephropathies of grades IV-V (N = 12). Serum samples were analyzed using proton nuclear magnetic resonance spectroscopy and by applying multivariate pattern recognition analysis for disease classification.
RESULTS: Compared with the healthy controls, both the low-risk and high-risk patients had higher levels of phenylalanine,myo-Inositol, lactate, L6 lipids ( = CH-CH2-CH = O), L5 lipids (-CH2-C = O), and L3 lipids (-CH2-CH2-C = O)
as well as lower levels of b-glucose, a-glucose, valine, tyrosine, phosphocholine, lysine, isoleucine, glycerolpho-sphocholine, glycine, glutamine, glutamate, alanine, acetate, 3-hydroxybutyrate, and 1-methylhistidine.
CONCLUSIONS:These metabolites investigated in this study may serve as potential biomarkers of immunoglobulin A nephropathy. Point scoring of pattern recognition analysis was able to distinguish immunoglobulin A nephropathy patients from healthy controls. However, there were no obvious differences between the low-risk and high-risk groups in our research. These results offer new, sensitive and specific, noninvasive approaches that may be of great benefit to immunoglobulin A nephropathy patients by enabling earlier diagnosis.
KEYWORDS: Immunoglobulin A Nephropathy; Metabonomics; Biomarkers; Proton Nuclear Magnetic Resonance Spectroscopy; Orthogonal Partial Least-Squares Discriminant Analysis.
Sui W, Li L, Che W, Zuo G, Chen J, Li W, Dai Y. A proton nuclear magnetic resonance-based metabonomics study of metabolic profiling in immunoglobulin a nephropathy. Clinics. 2012;67(4):363-373.
Received for publication onNovember 28, 2011;First review completed onNovember 28, 2011;Accepted for publication onDecember 26, 2011
E-mail: [email protected]
Tel.: 86 0755-25626750
INTRODUCTION
Immunoglobulin A nephropathy (IgAN) is the most common primary glomerulopathy worldwide; it is a mesangial proliferative glomerulonephritis characterized by diffuse mesangial deposition of immunoglobulin A (1).
The underlying mechanism of IgAN is poorly understood, and the outcomes of patients vary greatly. Variations in the methods used to treat IgAN patients account for less than half of the variability in outcomes (2). Determining an accurate diagnosis poses great challenges. Multiple observa-tional cohort studies have identified several risk factors associated with the progression of IgAN (3,4). Five clinical features, namely high proteinuria, hypertension, impaired renal function, hypoproteinemia, and hyperuricemia, are independent predictors of an unfavorable renal outcome (5). However, the threshold above which the risk develops is still debated. IgAN presents with variable clinical symptoms and pathological patterns, making it difficult to predict the risk of Copyrightß2012CLINICS– This is an Open Access article distributed under
the terms of the Creative Commons Attribution Non-Commercial License (http:// creativecommons.org/licenses/by-nc/3.0/) which permits unrestricted non-commercial use, distribution, and reproduction in any medium, provided the original work is properly cited.
progression to end-stage renal failure in individuals. Despite the fact that the progression of IgAN is generally slow, up to 15-40% of patients with IgAN develop end-stage renal disease within 20 years (6). As a "gold standard," renal biopsy is currently the primary diagnostic tool for renal disease, as well as for treatment and prognosis. Therefore, renal biopsy has been quite helpful in the understanding of the different types of human renal diseases and has also provided insight into their pathogenesis (7). Nevertheless, renal biopsy requires an inconvenient, invasive, and painful examination that is lacking in sensitivity, specificity and reproducibility and that suffers from inappropriate categor-ization and can even result in some complications (4,8). Additionally, general physicians find it difficult to perform biopsies. Thus, although both the clinical and histologic features of IgAN are highly variable (9), a novel and convenient strategy for predicting diagnosis from a biopsy-based pathological evaluation has not been well established (4). Neither a biomarker nor a biomarker profile is generally accepted in clinical practice. Therefore, identifying definite, as well as sensitive, biomarkers for early diagnosis would be of great significance for making diagnostic and treatment decisions.
Metabonomics is a well-established field in systems biology, which refers to the study of individual metabolic profiles and to their changes over time due to disease, toxicity and nutritional, environmental, and genetic alterations (10-12). In a process that is known as ‘‘metabolic fingerprinting,’’ global metabolite profiles of complex samples are used to identify potential biomarkers, and this process can provide new and unexpected insights into biological processes (13). Nuclear magnetic resonance (NMR) spectroscopy appears to be a cost-effective, useful technique for providing routine care and screening (14) and is well suited for the analysis of different types of biological fluids for the evaluation of individual metabolomes (15). Thus, proton-NMR (H-NMR) spectroscopic analysis allows for the simultaneous detection, identification, and quantification of hundreds of low-mole-cular-weight metabolites (max. 20 kDa) within a biological matrix (16) for the detection of dynamic changes in global metabolism and, specifically, of noninvasive blood markers, which represents a novel and robust method for assessing organ response to pathophysiologic stimuli (17-18). Due to its usefulness in evaluating systemic responses to any subtle metabolic perturbation, 1H NMR-based metabonomics has been extensively applied for the diagnosis and evaluation of cancer (19-21), diabetes (22), neurological diseases (23), heart disease (17), and cerebral infarction (24). To date, no NMR-based metabolomic studies of IgAN have been reported.
In the present work, we investigated the perturbed metabolic pattern in serum derived from IgAN patients and identified potential biomarkers of this disease using high-resolution NMR spectroscopy coupled with multi-variate statistical analysis. The integration of metabolic data could provide a systematic approach for the study of metabolic profiles associated with IgAN and could facilitate a detailed examination of the underlying molecular mechanisms of the disease. We sought to determine whether we could identify the metabolic phenotypes and characterize the metabolic changes related to the degree of IgAN, whether we could distinguish valuable biomarkers for disease diagnosis, and most importantly, whether understanding the pathogenetic process of IgAN on a systemic, metabolic level could hold the key to designing
therapies to arrest the development of IgAN and prevent its later manifestations. The results highlight the possibility for "metabolic fingerprinting" to become a new diagnostic method with improved sensitivity and specificity.
MATERIALS AND METHODS
Subjects
Before starting this study, the patients and controls were informed of the study protocol and signed written consent forms, which were approved by the Regional Ethics Committee of the 181st Hospital Guilin, Guangxi.
For this study, 35 IgAN patients and 23 age- and sex-matched healthy controls were recruited from the Nephrology Department of the 181st Hospital Guilin, Guangxi, China, from August 2010 to December 2010. All patients with biopsy-proven primary IgAN were reviewed. The subjects were classified into three groups: a control group consisting of 23 healthy subjects, a low-risk group consisting of twenty-three IgAN patients with diseases of grades I-III based on renal biopsies stained for IgAN-A, and a high-risk group composed of twelve IgAN patients with diseases of grades IV-V based on biopsies stained for IgAN-B. The inclusion criteria for IgAN were (1) patient age ranging from 18 to 60 years and evidence of predominant mesangial IgA deposits from a renal biopsy, and (2) absence of corticosteroid or immunosuppressive therapy in the previous 10 weeks in both the patients and controls. The exclusion criteria were (1) presence of a secondary cause of IgAN, such as systemic lupus erythematous, Scho¨nlein-Henoch purpura, chronic liver disease, malignancies, active peptic-ulcer dis-ease and other autoimmune disorders; (2) diagnosis of diabetes mellitus, acute interstitial nephritis, Alport’s syn-drome, acute myocardial infarction or stroke; (3) evidence or suspicion of severe uncontrolled hypertension (systolic blood pressure $220 mmHg and/or diastolic blood pressure $120 mmHg); and (4) history of alcoholism, smoking or oral contraception within the previous six months.
Approximately 4 mL of peripheral venous blood was collected in separate biochemistry tubes from the IgAN patients and healthy volunteers in the morning following a 12-h fasting period. The blood was allowed to clot for 60 min at room temperature and was centrifuged at 20006g for 10 min. The
supernatants were then divided into 0.5-mL polyethylene tubes and were stored at –80˚C until the NMR analysis was performed.
Clinical chemistry and histopathology
Clinical chemistry analyses of serum samples were conducted, using an automatic chemistry analyzer (MOL-300, Heal Force, China) with enzymatic methods using commercially available kits, for the measurement of several serum parameters, including proteinuria, alanine amino-transferase, aspartate aminoamino-transferase, total protein, albu-min, globulin, glucose, urea nitrogen, creatinine, uric acid, cholesterol, triglyceride, HDL cholesterol, and LDL choles-terol. The values were expressed as the means ¡ SDs.
Statistical comparisons were performed using SPSS 11.5 software (SPSS Inc., Chicago, IL, USA), and differences were considered significant whenp,0.05.
thickness were paraffin-embedded and stained with Mayer’s hematoxylin and eosin for direct immunofluorescence observations. The pathological diagnosis of IgAN was made according to the previous World Health Organization diagnostic system and its reference standard of clinical type based on Lee’s classification scheme (45).
Proton nuclear magnetic resonance spectroscopy For the NMR experiments, the serum samples were thawed at room temperature and centrifuged at 30006g for
5 minutes at 4˚C. The supernatants were then adjusted to pH 7.4 with sodium phosphate buffer solutions and mixed with 100mL of deuterium oxide solution to calibrate the NMR spectrometer. Finally, an aliquot of the prepared mixture (500mL) was transferred to a 5-mm NMR tube (Wilmad, Buena, NJ, USA).
The1H NMR spectra were acquired using a Varian Unity INOVA-600 MHz NMR spectrometer (Varian Inc., Palo Alto, CA, USA) operating at a 599.93-MHz frequency and a temperature of 300 K. The spectra were acquired using a conventional presaturation pulse sequence with a NOESYPR 1-D solvent suppressor (RD-90˚-t1-90˚-tm
-90˚-ACQ). Standard two-dimensional (2-D) total correlation spectroscopy (TOCSY) NMR spectra were also acquired for spectral assignment purposes in the selected samples.1H-1H
TOCSY experiments were performed using the tntocsy pulse sequence. For each sample, the free-induction decays were collected with 128 transients into 32K data points using a spectral width of 8000 Hz with a relaxation delay of 2.1 s, an acquisition time of 1 s and a mixing time of 100 ms. All of the spectra were multiplied by an exponential weighting function corresponding to a line-broadening of 1.0 Hz prior to Fourier transformation (25).
Data reduction and multivariate pattern recognition analysis
All of the NMR spectra were phased, baseline-corrected, and data-reduced to 225 integrated regions of d0.002 in
width, corresponding to the region of d0.5 to d9.0, using
TopSpin software (Varian 3.0, Bruker Biospin, Germany). The1H-NMR spectra of the serum samples were referenced to the internal lactic acid CH3resonance at 1.33 ppm. Then,
the region of water resonance (d4.37-6.88) was excluded to
eliminate the baseline effects of an imperfect water signal. The remaining bins were integrated and normalized for use in further analysis. The normalized data were imported into the SIMCA-P software package, version 11.0 (Umetrics AB, Umea, Sweden).
Unsupervised principal components analysis (PCA), supervised projection to partial least squares-discriminant analysis (PLS-DA), and orthogonal partial least squares-discriminant analysis (OPLS-DA) were performed for class discrimination and biomarker identification. First, PCA, based on a mean center-scaling model, was performed to examine the intrinsic variation in the dataset. The data were visualized with the score plots of the first two principal components (PC1 and PC2) to provide the most efficient two-dimensional representation of the information (21). As an extension of PLS-DA and featuring integrated orthogonal signal correction (OSC), OPLS-DA can remove variability not relevant to class separation. OPLS-DA was used to maximize the covariance between the measured data (X variable, peak intensities in NMR spectra) and the response variable (Y variable, predictive classifications) (21) and to
simultaneously remove uncorrelated variations between the X and Y variables or X variables that were orthogonal to Y variables (26). A scores plot combining the reliability and correlation from the OPLS-DA model helped to identify differential metabolites among the groups (27). The relevant metabolites for each separation model and their differences among the groups are shown as coefficient of variation plots. With a significance level of 0.05, a correlation coefficient (Corr(t,X)) of ¡0.497 was adopted as a cutoff value to select the variables that were most correlated with the OPLS-DA discriminant scores. The correlation coeffi-cients were calculated using Pearson linear correlation coefficients incorporated into MATLAB R2007a software (MathWorks, Inc., Natick, MA, USA).
Both the PLS-DA and OPLS-DA models were based on a unit variance scaling strategy. A 10-fold cross-validation was employed to obtain Q2and R2values. R2is defined as the proportion of variance in the data explained by the models and indicates goodness of fit, while Q2is defined as the proportion of variance in the data predictable by the model and indicates predictability (24). To further validate the quality of the PLS-DA model and to investigate the predictability of the OPLS-DA model, permutation tests, consisting of random permutation class membership and the performance of 200 iterations, were conducted (28). These tests compared the goodness of fit of the original model with the goodness of fit of several models based on data in which the order of the Y observations were randomly permuted while the X matrix was kept intact (29).p-values were generated by an unpairedt-test, and a p-value of,0.05 was considered statistically significant.
RESULTS
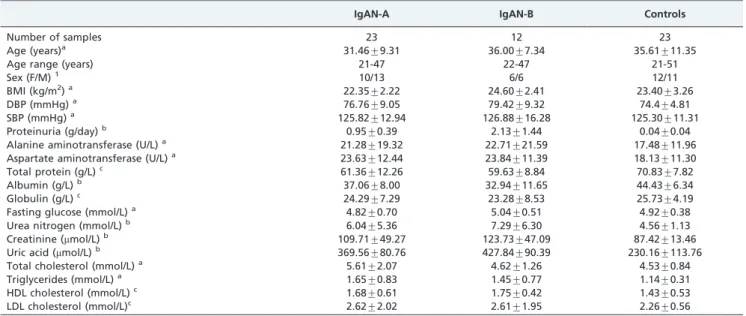
Clinical chemistry analysis and histopathology The percentages of IgAN patients with microscopic hematuria, hypertension, hyperlipidemia, and chronic renal failure were 97.01, 27.74, 13.26, and 20.32%, respectively. A total of 80.44% of long-term hypertension patients (blood pressure .140/90 mmHg) were required to undergo anti-hypertensive therapy to maintain normotension before under-going renal biopsy. The demographic features and body fluid parameters determined by biochemical analyses of all of the patients and healthy volunteers are shown in Table 1. No significant differences in age, sex distribution, BMI, or systolic and diastolic blood pressures were found among the three groups. The serum levels of total protein, albumin and globulin were lower in the IgAN patients than in the healthy controls, whereas the urea nitrogen, creatinine, and uric acid levels were higher in IgAN patients than in the healthy controls. Furthermore, proteinuria was significantly higher in the IgAN-B patients compared with the IgAN-A patients.
most common disease types. The classes of the IgAN pathological grades were predominantly II, III, and IV, while grades I and V were rare. This result may have occurred because grade I corresponded to the earliest stage of kidney disease and was hidden in the clinic due to untimely treatment or insufficient medical attention, and grade V was the most severe stage of renal disease that always progressed to renal failure, often requiring dialysis treatment in the clinic. Therefore, these patients rarely underwent biopsy.
Qualitative proton nuclear magnetic resonance analysis of serum samples
Figure 1 depicts the typical1H CPMG spectra of serum
samples obtained from healthy individuals and from IgAN-A and IgIgAN-AN-B patients. The1H-NMR signals of all common metabolites, including amino acids, organic acids, and carbohydrates, were assigned according to previous pub-lications (30). The spectral profiles were generally similar, making accurate visual comparison difficult, but some relative intensity differences could be observed among the three groups. As shown in Figure 1, predominantly
endogenous compounds were identified from the spectra comprising numerous lipoprotein fractions, some of which were derived from the glycerol of lipids, glycerolpho-sphocholine, density lipoprotein (L), and very low-density lipoprotein (VLDL). The sharp peaks arose from sugar signals, including n-acetyl glycoprotein, a-glucose, and b-glucose. There were also a large number of amino acid signals, such as methylhistidine, alanine, glutamine, glutamate, glycine, isoleucine, leucine, lysine, phenylala-nine, tyrosine, and valine, as well as signals from acetate, citrate, creatine, lactate, phosphocholine, pyruvate, acetone, creatinine,myo-Inositol, and methylamine.
Metabonomic analysis of human serum in controls and IgAN patients
Unsupervised PCA was applied to examine the intrinsic variation in the serum data sets. Figure 2 shows the two-dimensional PCA scores plots based on the1H CPMG NMR spectra of the serum obtained from different groups. More samples were present in the 95% confidence interval of the modeled variation. We found that the control samples were very homogeneous and that their distributions of PCA score plots were relatively close. The IgAN patients and healthy controls, although scattered, were located in different clusters, demonstrating a relatively clear distinction, while the score plots showed slight separations between the IgAN-A and IgAN-B groups and the serum (R2X = 79.5%; Q2Y = 0.760) models.
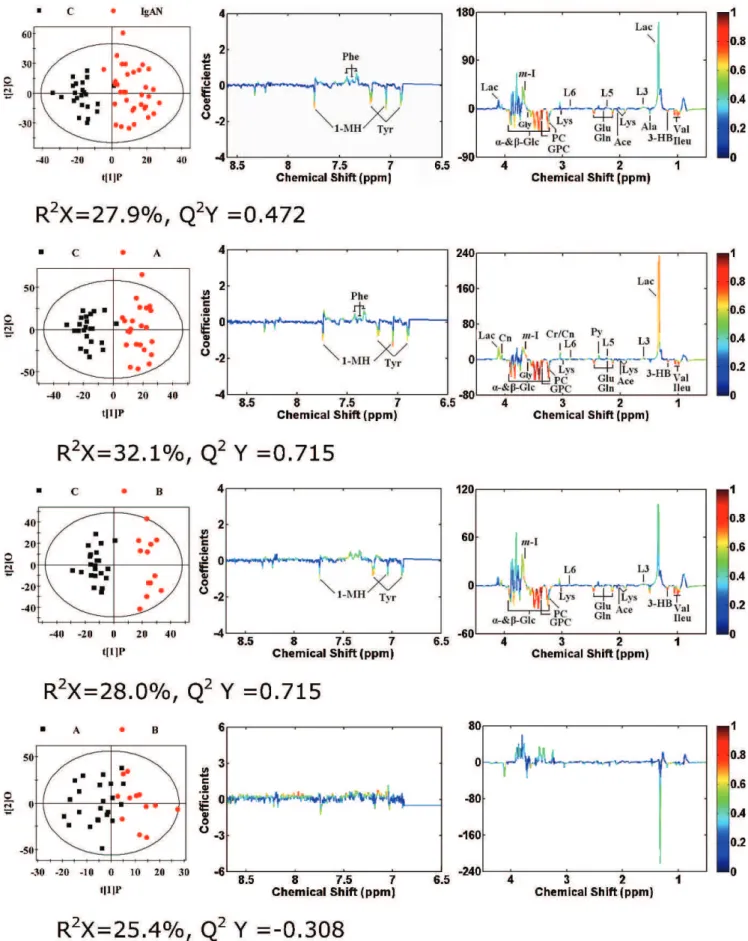
PLS-DA, which is more focused on detecting variation than the PCA approach, was further performed to investi-gate subtle metabolic differences among the groups. The parameters used to assess modeling quality, including R2X, R2Y, and Q2Y, are displayed under each picture in Figure 3. The model parameters for the explained variation,R2, and the predictive capability, Q2, were significantly higher
(R2, Q2.0.5) in the serum, indicating excellent models.
Table 1 -Demographic and clinical patient characteristics.
IgAN-A IgAN-B Controls
Number of samples 23 12 23
Age (years)a 31.46¡9.31 36.00¡7.34 35.61¡11.35
Age range (years) 21-47 22-47 21-51
Sex (F/M)1 10/13 6/6 12/11
BMI (kg/m2)a 22.35¡2.22 24.60¡2.41 23.40¡3.26
DBP (mmHg)a 76.76
¡9.05 79.42¡9.32 74.4¡4.81
SBP (mmHg)a 125.82¡12.94 126.88¡16.28 125.30¡11.31
Proteinuria (g/day)b 0.95
¡0.39 2.13¡1.44 0.04¡0.04
Alanine aminotransferase (U/L)a 21.28¡19.32 22.71¡21.59 17.48¡11.96
Aspartate aminotransferase (U/L)a 23.63
¡12.44 23.84¡11.39 18.13¡11.30
Total protein (g/L)c 61.36¡12.26 59.63¡8.84 70.83¡7.82
Albumin (g/L)b 37.06
¡8.00 32.94¡11.65 44.43¡6.34
Globulin (g/L)c 24.29¡7.29 23.28¡8.53 25.73¡4.19
Fasting glucose (mmol/L)a 4.82¡0.70 5.04¡0.51 4.92¡0.38
Urea nitrogen (mmol/L)b 6.04¡5.36 7.29¡6.30 4.56¡1.13
Creatinine (mmol/L)b 109.71¡49.27 123.73¡47.09 87.42¡13.46
Uric acid (mmol/L)b 369.56
¡80.76 427.84¡90.39 230.16¡113.76
Total cholesterol (mmol/L)a 5.61¡2.07 4.62¡1.26 4.53¡0.84
Triglycerides (mmol/L)a 1.65
¡0.83 1.45¡0.77 1.14¡0.31
HDL cholesterol (mmol/L)c 1.68¡0.61 1.75¡0.42 1.43¡0.53
LDL cholesterol (mmol/L)c 2.62
¡2.02 2.61¡1.95 2.26¡0.56
Data are presented as the means¡SDs.
1Categorical variables are expressed in percentages.
aThere was no significant difference in demographic data among the IgAN-A, IgAN-B and control groups (p .0.05). bSignificantly higher between the IgAN and control groups, as well as between the IgAN-A and IgAN-B groups (p
,0.001). cSignificantly lower between the IgAN and control groups, as well as between the IgAN-A and IgAN-B groups (p,0.05).
Table 2 -Brief summary of histologic changes in 35 cases of IgAN according to Lee9s classification system.
Pathology category I II III IV V
Mesangial proliferative Slight 3 6 1 0 0
Moderate 0 4 2 2 0
Severe 0 0 1 1 0
FSGS 0 0 6 4 2
MGN 0 0 0 2 0
SGN 0 0 0 0 1
Total 3 10 10 9 3
The PLS-DA scores plot (Figure 3a) showed that the cluster of IgAN patients was located further away from the cluster of healthy controls (R2X = 28.5%, R2Y = 0.836, Q2Y = 0.724), indicating that the metabolic profile of the IgAN patients was quite different from that of the healthy controls. Furthermore, Figure 3(b) shows a clear distinction between the IgAN-A patients and healthy controls (R2X = 32.1%, R2Y = 0.866, Q2Y = 0.741). Similarly, Figure 3(c) reveals the scores plot of the IgAN-B patients and healthy controls, which were also located in different clusters, demonstrating well-pronounced discrimination (R2X = 28.0%, R2Y = 0.906, Q2Y = 0.671). In Figure 3(d), some samples from IgAN-A patients are relatively mixed into the cluster of IgAN-B samples, which indicates that the metabolic profiles of those groups were quite similar (R2X = 25.4%, R2Y = 0.573, Q2Y = -0.160). The goodness of fit (R2and Q2) of the original PLS-DA models and of the cluster of 200 Y-permutated models can be visualized in validation plots (Figure 3, left panel). The validation plots clearly show that the original PLS-DA models were valid, as the Q2regression line had a negative intercept, and all of the permuted R2values on the left were lower than the original points on the right.
An OPLS-DA model was constructed in which one PLS component and one orthogonal component were calculated using the spectral data scaled to that used by Pareto (31). OSC filters were developed to remove the strong structured variation in X that was not correlated with Y. That is, OSC filters removed the structured Y-orthogonal variation from X in such a way that the filters could be applied to further data (32). The OPLS-DA models used to compare the spectral data between the groups were built using the NMR data as the X matrix and group information (i.e., control or IgAN patient groups) as the Y matrix (31). In the OPLS-DA model score plots, a clear differentiation between healthy individuals and IgAN patients (Figure 4a, left panel) can be seen. Additionally, a significant biochemical distinction between the IgAN-B group and control group (Figure 4b, left panel) is evident, as well as between the IgAN-A group and control group (Figure 4c, left panel). Some degree of
separation between the IgAN-A patients and IgAN-B patients can also be observed (Figure 4d, left panel).
The OPLS-DA loading plots (Figure 4, middle and right panels) were generated to identify the metabolites responsible for the differentiation in the score plots. The color map shows the significance of metabolite variations between the two classes. Peaks in the positive direction indicate metabolites that are more abundant in the groups in the positive direction of the first principal component (t[1]P). Consequently, metabo-lites that are more abundant in the groups in the negative direction of the first primary component are presented as peaks in the negative direction. In addition, the signals in the spectrum are associated with the significance of metabolites in characterizing the NMR data for a given group and the color-scaling map on the right-hand side of each loading plot. This was a function of variable importance in OPLS-DA loading plots (Figure 4) providing information about the magnitude of the importance of the metabolites in explaining the scores. For instance, red indicates a more significant contribution to the separation between the groups than blue. Based on the results of the OPLS-DA loading plot, in which the targeted profile can be observed, the serum of IgAN patients was characterized by higher levels of lactate, myo-Inositol, phenylalanine, and L6 ( = CH-CH2-CH = ), L5 (-CH2-C = O) and L3 (-CH2-CH2-C = O)
lipids, as well as by lower levels ofb-glucose,a-glucose, valine, tyrosine, phosphocholine, lysine, isoleucine, glycerolphospho-choline, glycine, glutamine, glutamate, alanine, acetate, 3-hydroxybutyrate, and 1-methylhistidine, compared with healthy individuals (Figure 4a, middle and right panels). Compared with the control group, the IgAN-A and IgAN-B groups had very similar levels of metabolic changes. Increased levels of pyruvate, phenylalanine, lactate, L5 lipids (CH2
-C = O), creatinine, and creatine and decreased levels of glycine were marked in the IgAN-A patients, while obvious differ-ences were not observed in the IgAN-B group (Figure 4b, c, middle and right panels). Overall, the high-risk patients had relatively higher or lower statistically significant differences in 24 variable metabolites than the low-risk patients. Intriguingly, it was difficult to differentiate the low-risk group from the
Figure 1 -600-MHz1H NMR spectra (d0.4-4.7 andd5.2-9.0) of serum obtained from the (A) control, (B) IgAN-A and (C) IgAN-B groups. The region ofd5.2-9.0 (in the dashed box) was magnified 8 times compared with the corresponding region ofd0.4-4.7 for the purpose of clarity. Key: 1-MH: 1-Methylhistidine; Ace: Acetate; Acet: Acetone; Ala: Alanine; Ci: Citrate; Cr: Creatine; Cn: Creatinine; GL: Glycerol of lipids; Gln: Glutamine; Glu: Glutamate; Gly: Glycine; GPC: Glycerolphosphocholine; Ileu: Isoleucine; L1: LDL&VLDL, CH3-(CH2)n-; L2:
LDL&VLDL, CH3-(CH2)n-; L3: -CH2-CH2-C = O; L4: -CH2-CH = CH-; L5: -CH2-C = O; L6: = CH-CH2-CH = ; L7: -CH = CH-; Lac: Lactate; Leu:
high-risk group using OPLS-DA score plots (Figure 4d, middle and right panels).
External validation was performed to test the reliability of the PLS-DA model. For our applications, the sensitivity, specificity and classification rate of the established models in correctly assigning diagnostic groups are shown in Table 3.
To further investigate the significance of these metabo-lites, a combination of statistical approaches was necessary (33). Thus, according to the cutoff value of the correlation coefficient, a total of 24 variables proposed as candidate biomarkers, contributing to the determination of the metabolic profiles for each model, are summarized in Table 4, along with the relative concentrations of the metabolites in the various groups.
DISCUSSION
IgAN is a complex trait and a significant cause of renal insufficiency in different cohort populations. Many researchers have elucidated the causal mechanisms under-lying IgAN in various fields. Nakamaki et al. (33) suggested that endothelin-1 is a major disease-promoting factor in renal disease. It has been documented that the deposition of polymeric IgA triggers glomerular immuno-inflammatory injury and that subsequent proteinuria may further induce tubulointerstitial lesions, thereby contributing to the pro-gression of IgA nephropathy (34). Suzuki et al. (35) described the characteristics of IgG autoantibodies in the abnormally glycosylated IgA1 secreted by immortalized B cells derived from patients with sporadic forms of IgA nephropathy, which may offer new insights into disease pathogenesis and may lead to new methods of diagnosis, monitoring, and therapy for patients with IgA nephropathy. Many IgAN studies have been published, but most have suffered from small sample sizes and methodological problems, and none of the results have been convincingly validated. Therefore, the molecular basis of IgA nephro-pathy is still not fully understood.
In our study, NMR-based metabolomic analysis technol-ogy was used for the first time to identify the characteristics of metabolite profiles from the serum samples of IgAN patients and from age- and sex-matched healthy controls. Using a comprehensive NMR screening process, we aimed to assess the potential of the technique as a diagnostic tool for the disease and to identify the characteristics of metabolites. The discovery of distinctive patterns in the metabolite profiles associated with different renal condi-tions could be of great diagnostic significance. The PCA score plots achieved good separation between the IgAN patients and healthy controls, and the IgAN-A and IgA-B samples manifested similar global differences in metabolic profiles. The results support the hypothesis that the metabolic fingerprinting of serum could be useful in distinguishing IgAN patients from healthy individuals. Upon testing of these results, the OPLS-DA models showed considerable R2 and Q2 values. Importantly, the results
showed high sensitivity and specificity for diagnosing patients with IgAN. However, this technique was not sensitive enough to differentiate between high and low disease risk. This finding suggests that the diseases may share, to some extent, the same metabolic pathway in their pathogenesis. Nevertheless, potential biomarkers, including
b-glucose,a-glucose, valine, tyrosine, pyruvate, phenylala-nine, phosphocholine,myo-Inositol, lysine, lactate, L6 lipids ( = CH-CH2-CH = ), L5 lipids (-CH2-C = O), L3 lipids (-CH2
-CH2-C = O), isoleucine, glycerolphosphocholine, glycine,
glutamine, glutamate, creatinine, creatine alanine, acetate, 3-hydroxybutyrate and 1-methylhistidine, as detected in this study, might explain the pathogenesis of IgAN and warrant further investigation in a systemic review.
Similar to how genes and proteins are normally asso-ciated with specific pathways and processes, so are metabolites. Changes in the relative concentrations of certain ‘‘universal’’ metabolites, such as glucose, lactate, and citrate, reflect changes in cell viability (apoptosis), levels of oxygenation (anoxia, ischemia, and oxidative stress), local pH, and general homeostasis (36). Among these metabolites,
Figure 2 -PCA scores plotted based on1H CPMG NMR spectra of serum obtained from the different groups. Left panel: C: control
group, black box (&); IgAN group, red dot (
N
). Right panel: C: control group, black box (&); A: IgAN-A group, red dot (we observed significantly elevated levels of lactate and pyruvate in the serum of IgAN-A patients, while neither could be detected in IgAN-B patients. Graham et al. (37) suggested that lactate arises from a shift toward anaerobic
glycolysis in potentially viable cells that continue to metabolize glucose under local hypoxic conditions. Alternatively, high levels of lactate may arise from inflammatory and phagocytic cell infiltration in tissue. Additionally, these are types of energy metabolism pro-cesses, especially anaerobic glycolysis. Because an increase in anaerobic cell respiration occurs under renal damage, there is an increased concentration of lactate and pyruvate in IgAN-A serum due to anaerobic glycolysis of serum glucose. In combination with a lower level of glucose, this result indicates up-regulated glycolysis. Furthermore, pos-sibly due to the reduced utilization of pyruvate in the Krebs cycle, citrate levels also decrease. Glucose and pyruvate can obviously be quite informative with regard to cell function or cell stress and, therefore, organ function.
IgAN causes perturbations in the Krebs cycle, as well as increased protein degradation from cell necrosis, leading to altered concentrations of free amino acids in serum. In this study, the significantly decreased amounts of valine, tyrosine, lysine, isoleucine glycine, glutamate, and alanine may be associated with reduced translation from citrate,a -ketoglutarate, succinyl-CoA and fumarate, which are inter-mediates of the Krebs cycle. Such results may indicate that protein is degraded into amino acids to regulate biological functions, such as gene transcription, cell cycle progression, and inflammatory and autoimmunity responses. The results are also indicative of alterations in energy metabolism as well as impairment in mitochondrial function (38). This finding is consistent with our report (Table 1) of decreased levels of total protein, albumin, and globulin in serum clinical chemistry assays. The lower level of glutamine may result from the inadequacy ofa-ketoglutarate, which fluxes out of the mitochondria and is converted into glutamate in the cytosol.
Other types of metabolites are specifically associated with tissue remodeling, muscle atrophy and myofibrillar break-down (e.g., methylhistidine, creatine, creatinine, and gly-cine). Changes in the levels of these metabolites can provide important information regarding the extent of tissue repair or tissue damage (39,40). Thus, an elevation in creatine/ creatinine levels is indicative of damage to the renal parenchyma or of kidney necrosis, which is also in accordance with clinical chemistry assays. Moreover, the lower concentrations of 1-methylhistidine, which is meta-bolized into histidine, might be closely related to protein energy wasting, inflammation and oxidative stress (41).
Phosphorylcholine is a precursor of glycerolphosphor-ylcholine, which is an essential component of membrane structures. The decreased serum levels of phosphorylcho-line in both the IgAN-A and IgAN-B patients might be related to the augmented utilization of glycerolphosphor-ylcholine in impaired cells and organelle membranes. More recent evidence has demonstrated that the proportion of PC/GPC can be used as a measurement of enhanced cell proliferation in cancerous tissues (42).
Myo-Inositol, L6 lipids ( = CH-CH2-CH = ), L5 lipids
(-CH2-C = O), and L3 lipids (-CH2-CH2-C = O) are involved
in lipid metabolism. In our study, clinical chemistry assays indicated slightly higher levels of free fatty acids and no significant differences in levels of triglycerides or total cholesterol between the IgAN and control groups, as well as between the IgAN-A and IgAN-B groups. NMR spectra showed enhanced serum levels of VLDL/LDL and unsatu-rated lipids in the IgAN patients. The enhanced lipid levels
Figure 4 -OPLS-DA score plots (left panel) derived from1H NMR spectra of serum and corresponding coefficient loading plots (middle
can most likely be attributed to the lower activity of the lipoprotein lipase. Additionally, the increase in lipid metabolism is enhanced in response to kidney injury when IgAN occurs (21). The increase in acetate, which is the end product of lipid metabolism, further supports the above-mentioned hypothesis. Furthermore, our work demon-strated that the concentrations of serum 3-hydroxybutyrate in the renal tissue of IgAN patients were significantly lower than those in the renal tissue of controls, which may confirm the shift in energy metabolism toward the formation and utilization of ketone bodies.
In summary, the systemic changes in endogenous metabolites from IgAN patients mainly influenced energy, amino acid, lipid, and nucleotide metabolism. As shown in Figure 5, the number of metabolic pathways involved in IgAN highlights the complexity of the metabolic response to IgAN. Metabolite profiling, obtained from 1H-NMR-based
metabonomic analysis of IgAN serum samples, clearly distinguished IgAN patients from healthy controls, which may be a minimally invasive method for detecting IgAN before symptoms develop, suggesting that the utilization of
metabonomics in serum may assist in early diagnosis, more appropriate therapy and better clinical management.
Although we identified disease-specific metabolite pro-files, the future use of metabolite biomarkers in the clinical environment requires optimization to improve their accu-racy. The limitations of this study must also be recognized (43,44). First, metabolic investigations can be helpful for the differentiation of healthy controls from IgAN patients, but they are not sensitive enough to be used to draw conclusions about the dynamic processes of high and low risk for this disease. Moreover, different histological classifications subjectively present selection bias to a certain degree when screening patients. Histological classification must be validated in different cohorts. Furthermore, this study was not specifically designed to answer the question of whether medical treatment consisting of diuretics, angioten-sin-converting enzyme inhibitors and/or angiotensin II receptor blockers, n-3 polyunsaturated fatty acids, and hypolipidemic agents should be administered to IgAN patients. We did not evaluate the associations between therapeutic interventions and metabolite changes in this
Table 3 -Sensitivity, specificity and classification rate calculated for the cross-validated OPLS-DA model applied to the spectra of serum samples from healthy controls and patients with IgAN.
IgANvs. control IgAN-Avs. control IgAN-Bvs. control IgAN-Avs. IgAN-B
Sensitivity (%) 88.6 92.3 95.4
-Specificity (%) 97.1 100 100
-Classification rate (%) 93.1 97.0 98.2
-Table 4 -Summary of the1H NMR-detected statistically significant changes in the relative levels of serum metabolites for IgAN patients compared with the healthy controls.
Metabolites ra
C-IgAN C- A C- B A-B
b-Glucose: 3.25 (ddb), 3.41 (t), 3.46 (m), 3.49 (t), 3.90 (dd), 4.65 (d) -0.784 -0.859 -0.797 -a-Glucose: 3.42 (t), 3.54 (dd), 3.71 (t), 3.73 (m), 3.84 (m), 5.23 (d) -0.812 -0.843 -0.871
-Valine: 0.99 (d), 1.04 (d) -0.816 -0.799 -0.811
-Tyrosine: 6.89 (d), 7.19 (d) -0.619 -0.638 -0.652
-Pyruvate: 2.37 (s) - 0.426 -
-Phenylalanine: 7.32 (d), 7.37 (t), 7.42 (dd) 0.436 0.473 -
-Phosphocholine: 3.21 (s), 3.35 (s) -0.791 -0.747 -0.798
-myo-Inositol: 3.65 (dd) 0.513 0.671 0.672
-Lysine: 1.72 (m), 1.90 (m), 3.02 (t), 3.76 (m) -0.577 -0.546 -0.560
-Lactate: 1.33 (d), 4.11 (q) 0.445 0.611 -
-L6 lipid, = CH-CH2-CH = : 2.78 (br) 0.422 0.555 0.617
-L5 lipid, -CH2-C = O: 2.24 (br) 0.433 0.514 -
-L3 lipid, -CH2-CH2-C = O: 1.58 (br) 0.527 0.610 0.561
-Isoleucine: 0.94 (t), 1.01 (d) -0.650 -0.604 -0.644
-Glycerolphosphocholine: 3.22 (s), 3.36 (s) -0.876 -0.858 -0.878
-Glycine: 3.56 (s) -0.524 -0.477 -
-Glutamine: 2.14 (m), 2.45 (m), 3.78 (t) -0.762 -0.796 -0.707
-Glutamate: 2.10 (m), 2.35 (m), 3.78 (t) -0.762 -0.751 -0.697
-Creatinine: 3.04 (s), 4.06 (s) - 0.506 -
-Creatine: 3.04 (s), 3.93 (s) - 0.417 -
-Alanine: 1.48 (d) -0.451 - -
-Acetate: 1.92 (s) -0.519 -0.454 -0.563
-3-Hydroxybutyrate: 1.18 (d) -0.834 -0.823 -0.843
-1-Methylhistidine: 7.05 (s), 7.75 (s) -0.692 -0.674 -0.608
-OPLS-DA coefficients derived from the NMR data of metabolites in serum obtained from different groups.
aCorrelation coefficients and positive and negative signs indicate positive and negative correlations in the concentrations, respectively. The correlation coefficient of |r|.0.404 was used as the cutoff value for statistical significance based on the discrimination significance at the level ofp= 0.05 anddf (degree of freedom) = 22 (for C-IgAN and C-A), and it was |r|.0.553 at the level ofp= 0.05 fordf= 11 (for C-B and A-B). ‘‘-’’ means that the correlation coefficient |r| is less than the cutoff value.
cohort of patients. Finally, given our relatively small sample size, especially the IgAN-B sample size, our observations still remain to be verified in larger studies. Further studies with larger numbers of patients and controls, including other distinctive types of IgAN diseases, will be crucial to validating this model and to assuring its use in routine practice. Additionally, to explore the potential of this model, follow-up work is required, which should include long-term studies of large numbers of patients with early IgAN diagnoses. It is also necessary to validate these biomarkers in another cross-sectional study with a separate population, and it would be of interest to perform a longitudinal study to determine the predictive power of this model with regard to disease progression.
In conclusion, this study showed that one potential use of metabonomics might be the development of a more sensitive, reliable and successful method of diagnosis than the invasive puncture procedure for distinguishing IgAN patients from healthy controls. Nevertheless, the model of the high-risk IgAN group versus the low-risk group was not perfect; that is, the1H NMR-based metabonomic analysis of serum samples revealed some characteristic metabolic features, but not processes, of the pathological changes associated with IgAN. Further NMR-based metabonomic studies of various IgAN models could provide insight into the molecular mechanisms involved in the pathogenesis of IgAN and could offer invaluable information that could be used in the development of a novel diagnostic technique and better IgAN treatments.
ACKNOWLEDGMENTS
This project was funded by grant support received from the Natural Science Foundation of Guangxi, China, which is gratefully acknowledged (fund number 2010GXNSFA013273). We are also thankful to the patients and healthy volunteers who participated in this study.
AUTHOR CONTRIBUTIONS
Sui W collected data and wrote the paper. Li L performed the research and wrote the paper. Che Wand Chen J analyzed the data. Zuo G and Li W revised the paper. Dai Y designed the research protocol and revised the paper.
REFERENCES
1. D’Amico G. The commonest glomerulonephritis in the world: IgA nephropathy. Q J Med. 1987;64(245):709-27.
2. Bartosik LP, Lajoie G, Sugar L, Cattran DCPredicting progression in IgA nephropathy. Am J Kidney Dis. 2001;38(4):728-35, http://dx.doi.org/ 10.1053/ajkd.2001.27689.
3. Coppo R, D’Amico G. Factors predicting progression of IgA nephro-pathies. J Nephrol. 2005;18(5):503-12.
4. Yamamoto R, Imai E. A novel classification for IgA nephropathy. Kidney International. 2009;76(3):477-80, http://dx.doi.org/10.1038/ki.2009.206. 5. Le W, Liang S, Hu Y, Deng K, Bao H, Zeng C, et al. Long-term renal
survival and related risk factors in patients with IgA nephropathy: results from a cohort of 1155 cases in a Chinese adult population. Nephrol Dial Transplant. 2011;29: [Epub ahead of print].
6. Laville M, Alamartine E. Treatment options for IgA nephropathy in adults: a proposal for evidence-based strategy. Nephrol Dial Transplant. 2004;19(8):1947-51, http://dx.doi.org/10.1093/ndt/gfh309.
7. Carvalho E, do Sameiro Faria M, Nunes JP, Sampaio S, Valbuena C. Renal diseases: a 27-year renal biopsy study. J Nephrol. 2006;19(4):500-7. 8. Weiguo Sui, Yong Dai, Yue Zhang, Jiejing Chen, Huaying Liu, He Huang, et al. Proteomic profiling of immunoglobulin A nephropathy in serum using magnetic bead based sample fractionation and matrix-assisted laser desorption/ionization-time of flight mass spectrometry. Saudi Med J. 2010;31(12):2-3.
9. Peters HP, van den Brand JA, Wetzels JF. Urinary excretion of low-molecular-weight proteins as prognostic markers in IgA nephropathy. Neth J Med. 2009;67(2):54-61.
10. Lindon JC, Nicholson JK. Analytical technologies for metabonomics and metabolomics, and multi-omic information recovery. Trends Anal. Chem. 2008;27(3):194–204, http://dx.doi.org/10.1016/j.trac.2007.08.009. 11. Coen M, Holmes E, Lindon JC, Nicholson JK. NMR-based metabolic
profiling and metabonomic approaches to problems in molecular toxicology. Chem Res Toxicol. 2008;21(1):9–27, http://dx.doi.org/ 10.1021/tx700335d.
12. Holmes E, Loo RL, Stamler J, Bictash M, Yap IK, Chan Q, et al. Human metabolic phenotype diversity and its association with diet and blood pressure. Nature. 2008;453(7193):396–400, http://dx.doi.org/10.1038/ nature06882.
13. Kaddurah-Daouk R, Krishnan KR. Metabolomics: a global biochemical approach to the study of central nervous system diseases. Neuropsychopharmacology. 2009;34(1):173–86, http://dx.doi.org/ 10.1038/npp.2008.174.
14. Ala-Korpela M. Potential role of body fluid 1H NMR metabonomics as a prognostic and diagnostic tool. Expert Rev Mol Diagn. 2007;7(6):761-73, http://dx.doi.org/10.1586/14737159.7.6.761.
15. Pradat PF, Dib M. Biomarkers in amyotrophic lateral sclerosis: facts and future horizons. Mol Diagn Ther. 2009;13(2):115-25.
16. Serkova N, Klawitter J, Niemann CU. Organ-specific response to inhibition of mitochondrial metabolism by cyclosporine in the rat. Transpl Int. 2003;16(10):748-55, http://dx.doi.org/10.1111/j.1432-2277.2003.tb00235.x.
17. Brindle JT, Antti H, Holmes E, Tranter G, Nicholson JK, Bethell HW, et al. Rapid and noninvasive diagnosis of the presence and severity of coronary heart disease using 1H-NMR-based metabonomics. Nat Med. 2002;8(12):1439-44, http://dx.doi.org/10.1038/nm1202-802.
18. Beckwith-Hall BM, Holmes E, Lindon JC, Gounarides J, Vickers A, Shapiro M, et al. NMR-based metabonomic studies on the biochemical effects of commonly used drug carrier vehicles in the rat. Chem Res Toxicol. 2002;15(9):1136-41, http://dx.doi.org/10.1021/tx020020+. 19. Ludwig C, Ward DG, Martin A, Viant MR, Ismail T, Johnson PJ, et al. Fast
targeted multidimensional NMR metabolomics of colorectal cancer. Magn Reson Chem. 2009;47(Suppl 1):S68-73, http://dx.doi.org/10.1002/mrc.2519. 20. Tiziani S, Lopes V, Gu¨nther UL. Early stage diagnosis of oral cancer
using 1H NMR-based metabolomics. Neoplasia. 2009;11(3):269-76. 21. Gao H, Lu Q, Liu X, Cong H, Zhao L, Wang H, et al. Application of 1H
NMR-based metabonomics in the study of metabolic profiling of human hepatocellular carcinoma and liver cirrhosis. Cancer Sci. 2009;100(4):782-5, http://dx.doi.org/10.1111/j.1349-7006.2009.01086.x.
22. Maher AD, Crockford D, Toft H, Malmodin D, Faber JH, McCarthy MI, et al. Optimization of human plasma 1H NMR spectroscopic data processing for high-throughput metabolic phenotyping studies and detection of insulin resistance related to type 2 diabetes. Anal Chem 2008;80(19):7354-62, http://dx.doi.org/10.1021/ac801053g.
23. Quinones MP, Kaddurah-Daouk R. Metabolomics tools for identifying biomarkers for neuropsychiatric diseases. Neurobiol Dis. 2009;35(2):165-76, http://dx.doi.org/10.1016/j.nbd.2009.02.019.
24. Jung JY, Lee HS, Kang DG, Kim NS, Cha MH, Bang OS, et al.1 H-NMR-Based Metabolomics Study of Cerebral Infarction. Stroke. 2011;42(5): 1282-8, http://dx.doi.org/10.1161/STROKEAHA.110.598789.
25. Kang SM, Park JC, Shin MJ, Lee H, Oh J, Ryu do H, et al. (1)H nuclear magnetic resonance based metabolic urinary profiling of patients with ischemic heart failure. Clin Biochem. 2011;44(4):293-9, http:// dx.doi.org/10.1016/j.clinbiochem.2010.11.010.
26. Larsen FH, van den Berg F, Engelsen SB. An exploratory chemometric study of 1H NMR spectra of table wines. J Chemometr. 2006;20(4):198– 208, http://dx.doi.org/10.1002/cem.991.
27. Wiklund S, Johansson E, Sjo¨stro¨m L, Mellerowicz EJ, Edlund U, Shockcor JP, et al. Visualization of GC/TOF-MS-based metabolomics data for identifica-tion of biochemically interesting compounds using OPLS class models. Anal Chem.2008;80(1):115-22, http://dx.doi.org/10.1021/ac0713510.
28. Ni Y, Su M, Lin J, Wang X, Qiu Y, Zhao A, et al. Metabolic profiling reveals disorder of amino acid metabolism in four brain regions from a rat model of chronic unpredictable mild stress. FEBS Lett. 2008;582(17):2627-36, http://dx.doi.org/10.1016/j.febslet.2008.06.040. 29. Aarøe J, Lindahl T, Dumeaux V, Saebø S, Tobin D, Hagen N, et al. Gene
expression profiling of peripheral blood cells for early detection of breast cancer. Breast Cancer Res. 2010;12(1):R7, http://dx.doi.org/10.1186/bcr2472.
30. Wishart DS, Lewis MJ, Morrissey JA, Flegel MD, Jeroncic K, Xiong Y, et al. The human cerebrospinal fluid metabolome. J Chromatogr B Analyt Technol Biomed Life Sci. 2008;871(2):164-73.
31. Kang SM, Park JC, Shin MJ, Lee H, Oh J, Ryu do H, et al.1H nuclear magnetic resonance based metabolic urinary profiling of patients with ischemic heart failure. Clinical Biochemistry. 2011;44(4):293-9, http:// dx.doi.org/10.1016/j.clinbiochem.2010.11.010.
32. Grove H, Jørgensen BM, Jessen F, Søndergaard I, Jacobsen S, Hollung K, et al. Combination of statistical approaches for analysis of 2-DE data gives complementary results. J Proteome Res. 2008;7(12):5119-24, http:// dx.doi.org/10.1021/pr800424c.
33. Nakamaki S, Satoh H, Kudoh A, Hayashi Y, Hirai H, Watanabe T. Adiponectin reduces proteinuria in streptozotocin-induced diabetic Wistar rats. Exp Biol Med (Maywood). 2011;236(5):614-20, http:// dx.doi.org/10.1258/ebm.2011.010218.
34. Rifai A, Dworkin LD. IgA nephropathy: markers of progression and clues to pathogenesis. Kidney Int. 2008;73(12):1338–40, http:// dx.doi.org/10.1038/ki.2008.158.
35. Suzuki H, Moldoveanu Z, Hall S, Brown R, Vu HL, Novak L, et al. IgA1 secreting cell lines from patients with IgA nephropathy produce aberrantly glycosylated IgA1. J Clin Invest. 2008;118(2):629–39. 36. Oberholzer J, Testa G, Sankary H, et al. Kidney transplantation at the
University of Illinois at Chicago from 1988–2004. Clin Transpl. 2004;143–9. 37. Graham GD, Blamire AM, Howseman AM, Rothman DL, Fayad PB,Brass LM, et al. Proton magnetic resonance spectroscopy of cerebral lactate and other metabolites in stroke patients. Stroke. 1992;23(3):333–40, http://dx.doi.org/10.1161/01.STR.23.3.333.
38. Waters NJ, Waterfield CJ, Farrant RD, Holmes E, Nicholson JK. Metabonomic deconvolution of embedded toxicity: application to thioacetamide hepato- and nephrotoxicity. Chem ResToxicol. 2005;18(4):639-54.
39. Nicholson JK, Lindon JC, Holmes E. ‘Metabonomics’: understanding the metabolic responses of living systems to pathophysiological stimuli via multivariate statistical analysis of biological NMR spectroscopic data. Xenobiotica. 1999;29(11):1181–9, http://dx.doi.org/10.1080/0049825 99238047.
40. Lindon JC, Holmes E, Bollard ME, Stanley EG, Nicholson JK. Metabonomics technologies and their applications in physiological monitoring, drug safety assessment and disease diagnosis. Biomarkers. 2004;9(1):1–31, http://dx.doi.org/10.1080/13547500410001668379. 41. Kumar A, Bala L, Kalita J, Misra UK, Singh RL, Khetrapal CL, et al.
Metabolomic analysis of serum by (1) H NMR spectroscopy in amyotrophic lateral sclerosis. Clin Chim Acta. 2010;411(7-8):563-7, http://dx.doi.org/10.1016/j.cca.2010.01.016.
42. Glunde K, Ackerstaff E, Mori N, Jacobs MA, Bhujwalla ZM. Choline phospholipid metabolism in cancer: consequences for molecular phar-maceutical interventions. Mol Pharm. 2006;3:496-506, http://dx.doi.org/ 10.1021/mp060067e.
43. Lovejoy TI, Revenson TA, France CR. Reviewing manuscripts for peer-review journals: a primer for novice and seasoned peer-reviewers. Ann Behav Med. 2011;42(1):1-13, http://dx.doi.org/10.1007/s12160-011-9269-x. 44. Garmel GM. Reviewing manuscripts for biomedical journals. Perm J.
2010;14(1):32-40.