Rosângela Aparecida AugustoI,II José Maria Pacheco de SouzaI
I Departamento de Epidemiologia. Faculdade de Saúde Pública. Universidade de São Paulo. São Paulo, SP, Brasil
II Programa de Pós-Graduação Interunidades em Nutrição Humana Aplicada. Universidade de São Paulo. São Paulo, SP, Brasil
Correspondence:
Rosângela Aparecida Augusto
R. Domingos da Costa Mata, 275, apto. 154 Santa Terezinha
02405-100 São Paulo, SP, Brasil E-mail: [email protected] Received: 8/6/2009 Approved: 4/12/2010
Article available from: www.scielo.br/rsp
Effectiveness of a
supplementary feeding program
in child weight gain
ABSTRACT
OBJECTIVE: To evaluate the effectiveness of a governmental supplementary feeding program in child weight gain.
METHODS: A cohort study including secondary data on 25,433 low-income
children aged between six and 24 months, participating in a fortifi ed milk
distribution program known as Projeto Vivaleite, was performed in the state of São Paulo, Southeastern Brazil, between 2003 and 2008. Weight gain was measured using weight-for-age z-score values, calculated according to the World Health Organization standards (2007). These values were obtained in the program routine, when a child started it and every four months during their stay. Children were divided into three z-score groups when starting the program: weight gain not compromised (z>-1); risk of low weight (-2≤z<-1); and low weight (z<-2). Multilevel linear regression (mixed model) was used, enabling the comparison, at each age, of adjusted mean z-scores between children starting the program and those who had been participating for at least four months, adjusted for correlation between repeated measurements.
RESULTS: The program had a positive effect on child weight gain, varying according to child nutritional status when starting this program; among those who started it with weight gain not compromised, the mean adjusted gain z-score was 0.183; among those with risk of low weight, 0.566; and among those with low weight, 1.005.
CONCLUSIONS: The program is effective for weight gain in children younger than two years, with a more pronounced effect on children who start the program under less favorable weight conditions.
DESCRIPTORS: Infant Nutrition. Supplementary Feeding, supply & distribution. Nutrition Rehabilitation. Program Evaluation. Nutrition Programs. Multilevel Analysis. Cohort Studies.
INTRODUCTION
Historically, food distribution to vulnerable population groups is a strategy adopted to improve living and health conditions in developing countries, although the literature shows controversial debates on the effectiveness of such action. In this context, there are also supplementary feeding programs to distribute fortifi ed foods, performed worldwide to prevent nutritional defi cien-cies in more vulnerable groups.1,15
characteristics,2,a because poverty is closely associated
with restrictions of access to adequate feeding and health care, resulting in higher nutritional risk.b
Brazil is one of the countries that signed the docu-ment entitled “A World Fit for Children”, where the child health goals to be achieved by 2015 are defi ned. Among these, it should be emphasized the commitment to the reduction in the prevalence of malnourishment in children younger than fi ve years, especially in those
younger than two years.c Thus, the assessment of
effectiveness of public policies, developed to improve child nutritional conditions, becomes a key instrument to identify the potential of such programs.
In the state of São Paulo, public policies of milk distri-bution to reduce child malnourishment indices date back to the 1950s and they have changed throughout the years. As an example, the product distributed changed
from powdered modifi ed milk to powdered whole milk,
from this to fl uid whole milk, and at last, in 1999, to fortifi ed fl uid milk.d
The Projeto Estadual do Leite (Vivaleitee – State Milk
Project) was established in 1999, under the coordina-tion of the State Department of Agriculture and Supply, aiming to improve the nutritional conditions of low-in-come children and simultaneously help the fl ow of milk production from small producers in the state. This project serves approximately 620,000 children annually in the entire state of São Paulo, through the distribution of pasteurized and fortifi ed fl uid milk, using an annual fund of 150,000 million reais (US$ 85 million), included in the state budget for health. In the countryside of the state of São Paulo, 300,000 children are served, distributed in 606 cities. The criteria to participate in the program are to be aged between six months and six years and to have a family income of up to two minimum wages, while prioritizing those younger than two years.
In 2003, The Department of Agriculture and Supply formed a team of nutritionists to coordinate the anthropometric follow-up of participating children in the countryside, which, although provided for in the program conception, was not performed in the cities, where activities were restricted to milk distribution. Since then, this program has maintained a database with follow-up anthropometric measurements of participating children.
The present study aimed to evaluate the effectiveness of the governmental supplementary feeding program in child weight gain.
METHODS
A cohort study was performed with secondary data on children aged from six to 24 months, from families with a monthly income lower than two minimum wages, living in 311 cities of the countryside of the state of São Paulo, Southeastern Brazil, who began to participate in the Projeto Vivaleite supplementary feeding program, between January 2003 and September 2008.
The criteria of inclusion were as follows: to be aged between six and 24 months, not to have reported health problems, not to have had diarrhea in the last 15 days, not to have been hospitalized in the last three months, not to be a twin, to have completed the information about all the variables of the program registration fi le, and to have at least two weight measurements taken, including one upon registration.
During the period evaluated, a total of 90,940 children, aged less than 21 months, were registered with the program. Of these, 32% had reported health problems, diarrhea or hospitalization upon registration; 2% were twins; 18% had responsible adults who could not inform the child’s weight at birth and exclusive maternal breastfeeding; and 20% were children who had recently registered with the program (length of time lower than four months), thus including only the
fi rst weight measurement.
The choice was for the exclusion from the analysis of children who did not have complete data (basically related to the information about weight at birth and exclusive maternal breastfeeding). Comparisons were made between the nutritional characteristics of these children, upon registration, and those of the children included in this study; no signifi cant differences were
observed. Thus, the fi nal sample was comprised of
25,433 children living in 311 cities.
In the countryside of the state of São Paulo, the program has determined that children should be weighed and measured upon registration and at every four months, during their stay; data obtained are input to an online computer system, generating a child follow-up database. The availability of data used in the comparisons followed the dynamics outlined in Table 1. The existence of data on weight obtained in a certain age enables the comparison of the indicator, according to participation (those registering and participants), adjusted for measurements repeated in the same individual.
a Ministério da Saúde. Pesquisa Nacional de Demografi a e Saúde da Criança e da Mulher - PNDS 2006: relatório fi nal. Brasília; 2008[cited 2008 Oct 1]. Available from: http://www.saude.gov.br/pnds2006
b Fundo das Nações Unidas para a Infância. Situação da Infância Brasileira: Desnutrição. Brasília; 2006[cited 2008 Oct 2]. Available from: http://www.unicef.org/brazil
c United Nations. Milenium declaration: development goals. New York; 2000.
d Stefanini MLR, Lerner BR, Lei DLM, Chaves SP. Fome e política: história, implantação, desenvolvimento, avaliação de um programa federal de suplementação alimentar no Estado de São Paulo. São Paulo: Instituto de Saúde; 1994. (Série Políticas Públicas em Saúde, 1).
Data on the characteristics of both children (breast-feeding, weight and height at birth, use of day care center/school, weight and height at every four months) and mothers (age, level of education, marital status, work, income) are recorded in the program registration
fi les and also input to an online system. Such system
has data entry fi lters, with the purpose of minimizing
the entry of inconsistent information.
As part of the program routine, all city managers receive periodical training and are instructed to obtain data in the interview with the mother/responsible adult, when child (birth certifi cate and vaccination card) and
adult identifi cation (proof of income and residence
and identifi cation card) must be provided. Weight and
height measurements must be taken by properly trained professionals in primary health units, using adequate calibrated equipment; it is recommended that children with a diagnosis of weight for age out of the eutrophic range be sent for pediatric care.
The volume of milk distributed is 15 liters/month per participating child, which is equivalent to 500 mL/day. This milk is delivered three times a week in locations established by the municipal government. The milk delivered is fl uid, whole, pasteurized, fortifi ed with iron and vitamins A and D, meeting 28% of a child’s daily caloric requirements (300 kcal), 38% of proteins (15 g), 63% of iron, 75% of vitamin A and 100% of calcium and vitamin D in children aged from one to three years.
Milk is purchased by the State of São Paulo Department of Agriculture through public tender; hired milk factories deliver this milk to locations designated by municipal governments registered with the program, which are responsible for the registration, distribution and follow-up of participants’ nutritional status.
The term effectiveness used here refers to the effect achieved by the intervention resulting from operation-alization, in a real, non-controlled situation,4 a type
of approach which is relevant in the area of public
health, according to Victora18 (2002). The response
variable used to evaluate program effectiveness during growth was the z-score of the WA (weight-for-age) indicator, calculated according to the new growth
curves.3 Children (n= 748) who had a z-score out
of the -5<z<+5 interval, in any measurement, were excluded.19 The utilization of the WA z-score indicator
was considered more adequate, because secondary data collected in the routine of primary health units were used and because the effect of the program on the nutritional status of children younger than two years was expected to be evaluated. Weight is a more sensitive body measure than height, once short-term food restrictions readily reduce their values, something
that does not occur with height; weight defi cits can
also be more quickly corrected with adequate dietary
changes than those associated with height.19 Moreover,
it is common to fi nd problems in the routine of health services when applying adequate techniques to collect
height and weight measurements of children,17 often
restricting the evaluations resulting from these contexts to the use of the WA indicator.
The main independent variable is the status in the program, categorized into 0=“registering” or 1=“participating”. All anthropometric measurements
obtained upon registration (fi rst weight measurement)
were used as control measures, because children are not receiving supplementary feeding yet, serving as baseline to evaluate participants’ growth.
Upon registration, children were divided into three z-score categories to measure the effect of the program, according to their initial nutritional status, with the
following being adopted: z ≥ -1, “weight for age not
compromised – WNC”; -2 ≤ z < -1, “with risk of low
weight – RLW”; and z < -2, “low weight – LW”. These categories were treated as dummy variables (1=“yes”, 0=“no”) in the model.
Child age in the weight measurements was included in the model to control its effect on z-score variations. Age was used in its continuous form, “centralized”, by subtracting six months from all ages to begin in the zero (0) reference position, corresponding to the actual age minus six months. It was considered convenient, after preliminary inspection, to include the square of the centralized age, enabling a better approximation to the z-score trend, according to the advancement of age of children.
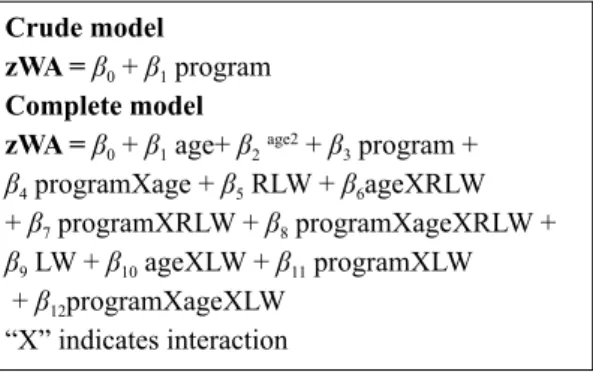
A model using mixed (multilevel) linear regression was developed to adequately explore the hierarchical structure of data, implying the existence of a correlation in the measurements of the same child throughout time and in those of children from the same city.6,20 A total
of three hierarchical levels were considered: 1) ages in the weight measurements (i), nested in each child; 2) children (j), nested in cities; 3) cities (k).
The crude effects of the program were measured in the total sample and separately for each z-score category upon registration and the differences of mean effects between categories of nutritional status upon registra-tion, adopting the WNC group as reference. With the complete model, adjusted z-score values were obtained for all combinations (age, category upon registration and status in the program), enabling the construction of curves and their respective confi dence intervals. A
signif-icance level of α= 5% was adopted. Data processing
xtmixed zWA age age2 program programXage RLW ageXRLW programXRLW programXageXRLW LW ageXLW programXLW programXageXLW ||city:||child: age, cov(unstructured) ml
where:
zWA= adjusted mean z-score of weight for age (WA).
β0, β5, β9 = correspond to the adjusted mean z-score,
when the program and age variables are equal to zero (0), of children who registered with their weight not compromised (reference category), with risk of low weight and with low weight, respectively.
β1, β6 eβ10 = β1 is the z-score variation (including those
registering and participants) at each month, when age increases in the reference group (WNC); β6 is the difference between the z-score variation in the age in the RLW group and the variation measured in the WNC group (β1); β10 is the difference between the z-score variation in the age in the LW group and the variation
measured in the WNC group (β1).
β2= indicates whether the evolution of z-score in the
age occurs as an ascending (+) or descending parabola (-) and the intensity of such evolution.
β3, β7,β11 = β3 is the effect of the program (difference
of z-score between participants and those registering) on the reference category (WNC); β7 is the difference between the effect of the program on the RLW group and the effect on the WNC group (β3); β11 is the differ-ence between the effect of the program on the RLW
group and the effect on the WNC group (β3).
β4, β8,β12 = β4 is the effect of the program (difference
in z-score between participants and those registering) on the age in the reference category (WNC); β8 is the difference between the effect of the program on the RLW group and the effect on the WNC group (β4); β12 is the difference between the effect of the program on the age in the RLW group and the effect on the WNC group (β4).
The present study was approved by the Research Ethics Committee of the Faculdade de Saúde Pública da Universidade de São Paulo (Process 1905 of February 18th, 2009).
RESULTS
The analysis of characteristics of children when regis-tering with the program revealed that they were equally distributed according to sex, the majority of whom did not use a day care center or school; had not been exclusively breastfed until the age of six months; were not being breastfed; were eutrophic; and were cared for
upon registration
upon registration upon registration
while participating
while participating
while participating
-3
-2
-1
0
1
Adjusted mean z-score (weight for age)
6 8 10 12 14 16 18 20 22 24
when weight is measured (in months)
registered with low weight registered with risk of low weight registered without weight being compromised 95% CI
their own mothers, most of whom did not have a paid job (Table 2). Mean weight at birth was 3,200 g, with a prevalence of 7.2% of low weight at birth. It could be observed that the majority of children belonged to fami-lies with fi ve individuals or more and with a per capita income of less than ¼ of a minimum wage. Among the maternal characteristics, approximately ¼ of the mothers
were adolescents, had less than fi ve years of education and did not have a partner. With regard to the nutritional status when registering with the program, about 18% of children had their weight compromised.
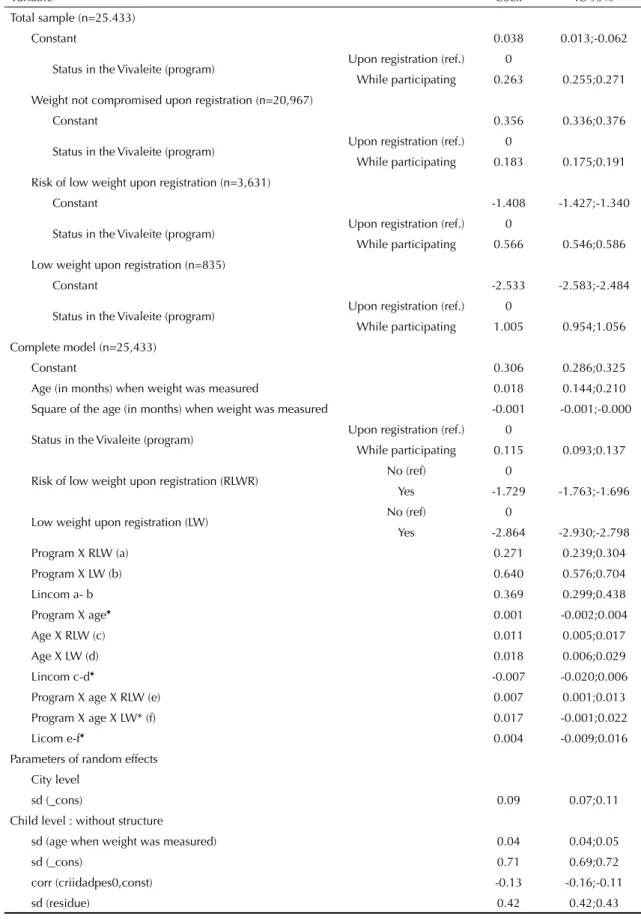
Table 3 shows the mean differences in z-score used to verify the effectiveness of the program, in the total sample and also separately, according to categories of
-3
-2
-1
0
1
2
weight-for-age z-score
6 8 10 12 14 16 18 20 22 24
adjusted individual z-score observed z-score
Figure 2. Illustration of adjustments made by the multilevel model. State of São Paulo, Southeastern Brazil, 2003-2008.
Table 1. Distribution of children, according to age when weight was measured and time of this measurement. State of São Paulo, Southeastern Brazil, 2003-2008.
Age when weight was measured (months) Measurement
First Second Third Fourth Fifth
6 8,731 0 0 0 0
7 4,230 0 0 0 0
8 2,698 0 0 0 0
9 1,961 1,470 0 0 0
10 1,416 5,447 0 0 0
11 1,201 3,954 0 0 0
12 942 2,372 0 0 0
13 788 1,718 1,228 0 0
14 643 1,262 4,440 0 0
15 694 1,012 3,169 0 0
16 526 833 1,840 0 0
17 488 740 1,276 1,003 0
18 413 599 985 3,957 0
19 360 579 726 2,675 0
20 293 501 623 1,670 0
21 49 458 527 1,148 874
22 0 430 483 832 3,477
23 0 363 437 657 2,297
24 0 361 360 553 1,365
22 0 430 483 832 3,477
nutritional status upon registration. In the total sample, children who participated in the program, regardless of their nutritional status upon registration, showed a weight-for-age z-score signifi cantly higher than that of non-participating children, with a mean difference of 0.263 z-score units.
In the three categories of nutritional status upon regis-tration, participation in the program led to weight gain, with a z-score of 1.005 in participants who registered with low weight, 0.566 in those with risk of low weight and 0.183 in those whose weight was not compromised. Comparison among effects, expressed by the
coef-fi cients of interactions between program and category
of nutritional status in the complete model, indicated signifi cant differences, enabling one to affi rm that the greater the amount of weight being compromised upon registration, the higher the effect of the program.
The complete model shows the adjusted effect of the program in the WNC category, a z-score of 0.115. The sum of this effect with the coefficient of the programXRLWR variable (0.271) results in the effect of the program on the RLW category, a z-score of 0.386. Following the same reasoning, the effect of the LW category is obtained, a z-score of 0.755.
The verifi cation of z-score variation in the age, in
both participants and those registering, showed that an increase in age resulted in an increase in z-score (age, ageXRLW, ageXLW) in all categories of nutritional status.
The statistical signifi cance of the square of age indicated
curves with a parabolic behavior, probably refl ecting
the normal growth pattern.
The differences between z-score variations in the age of those registering and participants, in the RLW and LW groups (programXageXRLW and programXageXLW), were found to be signifi cant, indicating that the effect of the program in these categories increased with age; in contrast, in the WNC group, the effect of the program was similar in all ages.
The effect of the program in each category of nutritional status and its variations with age can be observed in Figure 1.
The comparison between the effects of the program on age, measured in each category of nutritional status, is expressed by the program, age and nutritional status interactions, indicating that the effect of the program did not vary according to age in both children regis-tering without their weight compromised and those registering with low weight. This effect increased with the increase in age in the group of children with nutritional risk upon registration. Figure 1 shows this behavior, showing that the curves upon registration and
Table 2. Distribution of children, according to socio-demographic characteristics and health conditions. State of São Paulo, Southeastern Brazil, 2003-2008. (N= 25,433)
Variable %
Sex
Male 50.1
Female 49.9
Weight at birth
< 2,500g 7.2
≥ 2,500g 92.8
Exclusive breastfeeding at six months
Yes 26.3
No 73.7
Breastfeeding when registering with the program Yes 45.3
No 54.7
Use of a day care center or school
Yes 6
No 93.8
Nutritional status (weight-for-age z-score) when registering
Low weight 3.3
Risk of low weight 14.3 Weight not compromised 82.4 Number of weight measurements taken
2 33.7
3 23.2
4 21.8
5 21.3
Residents in the household
2|- 4 33.3
5|- 6 46.5
6|- or more 20.2
Age of mother/responsible adult (in years)
<20 (adolescents) 22.6 ≥ 20 (non-adolescents) 77.4 Level of education of mother/responsible adult (in years of education)
0|- 5 19.8
5|- 9 37.1
9|- or more 43.4
Per capita income (in minimum wages)
< 0.25 49
0.25 |- 0.5 43.7
≥ 0.5 7.4
Work of mother/responsible adult
Yes 18.6
No 81.4
Marital status
With a partner 75.7
Table 3. Mean weight-for-age z-score differences in participants and children registering, in the total sample and in categories of nutritional status upon registration, obtained from (crude and adjusted) multilevel models. State of São Paulo, Southeastern Brazil, 2003-2008. (N= 25,433).
Variable Coef. IC 95%
Total sample (n=25.433)
Constant 0.038 0.013;-0.062
Status in the Vivaleite (program) Upon registration (ref.) 0
While participating 0.263 0.255;0.271 Weight not compromised upon registration (n=20,967)
Constant 0.356 0.336;0.376
Status in the Vivaleite (program) Upon registration (ref.) 0
While participating 0.183 0.175;0.191
Risk of low weight upon registration (n=3,631)
Constant -1.408 -1.427;-1.340
Status in the Vivaleite (program) Upon registration (ref.) 0
While participating 0.566 0.546;0.586 Low weight upon registration (n=835)
Constant -2.533 -2.583;-2.484
Status in the Vivaleite (program) Upon registration (ref.) 0
While participating 1.005 0.954;1.056
Complete model (n=25,433)
Constant 0.306 0.286;0.325
Age (in months) when weight was measured 0.018 0.144;0.210
Square of the age (in months) when weight was measured -0.001 -0.001;-0.000
Status in the Vivaleite (program) Upon registration (ref.) 0
While participating 0.115 0.093;0.137
Risk of low weight upon registration (RLWR) No (ref) 0
Yes -1.729 -1.763;-1.696
Low weight upon registration (LW) No (ref) 0
Yes -2.864 -2.930;-2.798
Program X RLW (a) 0.271 0.239;0.304
Program X LW (b) 0.640 0.576;0.704
Lincom a- b 0.369 0.299;0.438
Program X age* 0.001 -0.002;0.004
Age X RLW (c) 0.011 0.005;0.017
Age X LW (d) 0.018 0.006;0.029
Lincom c-d* -0.007 -0.020;0.006
Program X age X RLW (e) 0.007 0.001;0.013
Program X age X LW* (f) 0.017 -0.001;0.022
Licom e-f* 0.004 -0.009;0.016
Parameters of random effects City level
sd (_cons) 0.09 0.07;0.11
Child level : without structure
sd (age when weight was measured) 0.04 0.04;0.05
sd (_cons) 0.71 0.69;0.72
corr (criidadpes0,const) -0.13 -0.16;-0.11
sd (residue) 0.42 0.42;0.43
participation of children who start the program with a nutritional risk become more distant from one another with the increase in age.
The comparison of the effects of the program with the increase in age, in each category of nutritional status, is shown in the curves of Figure 1, obtained from the complete model. It can be clearly observed that partici-pating children who registered with risk of low weight and low weight increased their weight-for-age indices signifi cantly on average. The behavior of these curves illustrates the magnitude of the effect of the program, especially among those who start the program with a worse nutritional status. Figure 2 shows, as an example, the z-scores observed in fi ve children and the respective values adjusted due to the multilevel model.
DISCUSSION
The Vivaleite Project is effective for weight gain in children younger than two years, once children exposed to the program (participants) show higher mean z-scores of weight-for-age than those not exposed (those regis-tering), an effect which is directly proportional to the level of nutritional defi ciency upon registration.
The results of the present investigation are in agree-ment with other studies that evaluate suppleagree-mentary feeding programs2,5,7,8,10,16,f and verify the positive
impact of such programs on the growth of participating children. Although these other programs have charac-teristics that are different from those of the Vivaleite Project and the evaluations involved other methods of analysis, including the use of distinct anthropometric indicators and reference growth standards, the results converge to the conclusion that participation in supple-mentary feeding programs leads to an improvement in anthropometric indicators of participating children. A similar aspect of such programs is the combination of supplementary feeding and primary health actions, such as immunizations and routine anthropometric follow-up. Literature reviews1,14 point to better results
from supplementary feeding programs combined with health actions, others11 indicate that results are at times
irrelevant, when supplementary feeding is seen as mere food distribution.
The greatest effects found in children whose nutritional status is more compromised, upon registration, were also observed in other studies1,2,7,13,14 and are consistent
with the reasoning of biological plausibility: children with a poorer nutritional status improve more.
The literature9 establishes some important questions so
that studies that compare intervention group and control group are valid. Validity will be guaranteed when there are similar groups and control of confounding factors.
The present study measured the effect of the program on the growth of participating children, using children registering with this program as comparison group (children not exposed to any project actions and not consuming supplementary feeding yet). Thus, this study sought to control the effect of the following factors, which were external to the program and could be associ-ated with child growth: 1) biological characteristics at birth did not differ between participants and those regis-tering, once anthropometric data from the same child, obtained at different moments, were used; 2) socioeco-nomic conditions were not signifi cantly changed during the observation period. Thus, the possibility of a child, whose family has an income higher than two minimum wages, staying in the program is minimal, due to the criterion of permanence established by decree, which is monitored by the municipal government and indirectly controlled by the families on the waiting list; 3) the effect of age was controlled by the use of the weight-for-age z-score and by the comparison between mean z-scores of participants and those of children registering with the program, in children of the same age; and 4) the possibility of seasonal infl uence was excluded, once registration with the program occurred throughout the entire observation period.
The statistical analysis technique used also helped to control such factors, because it considers the possible correlations existing among individuals living in one location and among repeated measurements of one individual.
In addition to factors that were sought to be controlled, it is understood that studies on intervention actions in populations are subject to other problems, such as supplement intrafamilial dilution and lack of awareness of participants’ actions, among other things. A study on effectiveness like the present one implies this situation, although revealing results from the actual dynamics of the target population, in a well-defi ned context of public health. Thus, the results of this evaluation translate into the effectiveness of the Vivaleite Project, under actual and usual functioning conditions.
1. Beaton GH, Ghassemi H. Supplementary feeding: programs for young children in developing countries. Am J Clin Nutr. 1992;35(4 Suppl):864-916.
2. Castro INR, Monteiro CA. Avaliação do Impacto do programa ‘Leite é Saúde’ na recuperação de crianças desnutridas no Município do Rio de Janeiro. Rev Bras Epidemiol. 2002;5(1):52-62. DOI:10.1590/S1415-790X2002000100007
3. De Onis M, Onyango AW, Borghi E, Siyam A, Nishida C, Siekmann J. Development of a WHO growth reference for school-aged children and adolescents. Bull World Health Organ. 2007;85(9):660-7. DOI:10.1590/ S0042-96862007000900010
4. Donabedian A. The seven pillars of quality. Arch Pathol Lab Med. 1990;114(11):1115-8.
5. Gigante DP, Santos IS, Coitinho DC, Valle NCJ, Haisma H, Valente GCM. Avaliação do impacto do Programa Nacional do Leite em Alagoas, através de métodos isotópicos: aspectos metodológicos e resultados preliminares. Rev Bras Epidemiol. 2002;5(1):63-70. DOI:10.1590/S1415-790X2002000100008
6. Goldstein H. Multilevel statistical models. 2ed. London: Edward Arnold; 1995.
7. Goulart RMM, França Jr I, Souza MFM. Fatores associados à recuperação nutricional de crianças em programa de suplementação alimentar. Rev Bras Epidemiol. 2009;12(2):180-94. DOI:10.1590/S1415-790X2009000200008
8. Goulart RMM, França Jr I, Souza MFM. Recuperação nutricional de crianças desnutridas e em risco nutricional em programa de suplementação alimentar no Município de Mogi das Cruzes, São Paulo, Brasil. Cad Saude Publica. 2007;23(1):147-56. DOI:10.1590/ S0102-311X2007000100016
9. Kirkwood BR, Cousens SN, Victora CG, Zoysa I. Issues in the design and interpretation of studies to evaluate the impact of community-based interventions. Trop Med Int Health. 1997;2(11):1022-9. DOI:10.1046/j.1365-3156.1997.d01-188.x
10. Lessa AC, Devincenzi MU, Sigulem DM. Comparação da situação nutricional de crianças de baixa renda no segundo ano de vida, antes e após a implantação de programa de atenção primária à saúde. Cad Saude Publica. 2003;19(2):505-14. DOI:10.1590/S0102-311X2003000200017
11. Monte CMG, Ashworth A, Sá MLB, Diniz RLP. Effectiveness of nutrition centers in Ceará state, northeastern Brazil. Rev Pan Salud Publica. 1998;4(6):375-82. DOI:10.1590/S1020-49891998001200002
12. Monteiro CA, D´Aquino MH, Konno SC, Silva ACF, Lima ALL, Conde WL. Causas do declínio da desnutrição infantil no Brasil, 1996-2007. Rev Saude Publica. 2009;43(1):35-43. DOI:10.1590/S0034-89102009000100005
13. Mora JO, Herrera G. The effects of nutritional supplementation on physical growth of children at risk of malnutrition. Am J Clin Nutr. 1981;34(9):1185–92.
14. Rogers BL. Feeding programs and food-related income transfers. In: Pinstrup-Andersen P, Pelletier D, Alderman H, editors. Child growth and nutrition in: developing countries – priorities for action. Ithaca/ London: Cornell University Press; 1995. p. 199-219.
15. Schilling PR. Suplementary feeding programs: a critical analysis. Rev Saude Publica.1990;24(5):412-9. DOI:10.1590/S0034-89101990000500010
16. Schroeder DG, Martorell R, Rivera JA, Ruel MT, Habicht JP. Age differences in the impact of nutritional supplementation on growth. J Nutr. 1995;125(4 Supl):1051-9.
17. Venâncio SI, Levy RB, Saldiva SRDM, Mondini L, Stefanini MLR. Sistema de vigilância alimentar e nutricional no Estado de São Paulo, Brasil: experiência da implementação e avaliação do estado nutricional de crianças. Rev Bras Saude Matern Infant. 2007;7(2):213-20. DOI:10.1590/S1519-38292007000200012.
18. Victora CG. Avaliando o impacto de intervenções em saúde: editorial. Rev Bras Epidemiol. 2002;5(1):2-4. DOI:10.1590/S1415-790X2002000100002
19. World Health Organization. Physical Status: the use and interpretation of anthropometry. Report of a WHO Expert Committee. Geneva; 1995.(Technical Report Series, 854).
20. Zunzunegui MV, Yebenes MJG, Forster M, Conesa MDA, Laso AR, Otero A. Aplicaciones de los modelos multinível al analisis de medidas repetidas em estúdios longitudinales. Rev Esp Salud Publica. 2004;78(2):177-88. DOI:10.1590/S1135-57272004000200005
REFERENCES
Article based on Doctoral thesis by RA Augusto, presented to the Interunit Postgraduate Program in Applied Human Nutrition of the Faculdade de Saúde Pública, Universidade de São Paulo, in 2009.