THEME SECTION - EPIDEMIOLOGICAL AND CLINICAL ASPECTS OF RESEARCH IN FOOD AND NUTRITION
1Universidade de Brasília, Faculdade de Ciências da Saúde, Programa de Pós-Graduação em Nutrição Humana. Campus Universitário Darcy Ribeiro, Asa Norte, 70910-900, Brasília, DF, Brasil. Correspondência para/Correspondence to: KMB CARVALHO. E-mail: <[email protected]>.
Diet quality assessment indexes
Índices de avaliação da qualidade da dieta
Kênia Mara Baiocchi de CARVALHO1
Eliane Said DUTRA1
Nathalia PIZATO1
Nádia Dias GRUEZO1
Marina Kiyomi ITO1
A B S T R A C T
Various indices and scores based on admittedly healthy dietary patterns or food guides for the general population, or aiming at the prevention of diet-related diseases have been developed to assess diet quality. The four indices preferred by most studies are: the Diet Quality Index; the Healthy Eating Index; the Mediterranean Diet Score; and the Overall Nutritional Quality Index. Other instruments based on these indices have been developed and the words ‘adapted’, ‘revised’, or ‘new version I, II or III’ added to their names. Even validated indices usually find only modest associations between diet and risk of disease or death, raising questions about their limitations and the complexity associated with measuring the causal relationship between diet and health parameters. The objective of this review is to describe the main instruments used for assessing diet quality, and the applications and limitations related to their use and interpretation.
Indexing terms: Diet. Diet mediterranean. Indexes.
R E S U M O
Para avaliação da qualidade da dieta, diferentes índices ou escores foram desenvolvidos, considerando padrões dietéticos reconhecidamente saudáveis ou baseando-se em guias alimentares para populações em geral ou
para a prevenção de doenças. Dos vários índices, quatro deles servem de base para a maior parte dos estudos:
Índice de Qualidade da Dieta, Índice de Alimentação Saudável, Escore da Dieta Mediterrânea e Índice Geral de Qualidade Nutricional. A partir desses modelos, alguns outros foram criados, com acréscimo do termo adaptado/ revisado, ou em novas versões (I, II ou III) como referência do respectivo original. Esses índices, mesmo validados, apresentam associações geralmente modestas com o risco de mortalidade ou doenças, o que aponta suas limitações, bem como a complexidade de se medir a relação causal entre dieta e parâmetros de saúde. Esta revisão tem como objetivo descrever os principais instrumentos de avaliação da qualidade da dieta, assim como suas aplicações e limitações, relativas ao uso e interpretações.
I N T R O D U C T I O N
Despite the amount of knowledge on the benefits of a nutritionally balanced to prevent chronic Non-Communicable Diseases (NCD), the prevalence of these diseases has been increasing. NCD are associated with high intake of processed, energy-dense, low-nutrient foods1-3.
The relationship between diet and health is very complex and cannot be attributed to a single dietary component. Epidemiologic studies that investigate NCD-related dietary factors found that the Western diet is a risk factor4-7, and a diet high in fruits and non-starchy vegetables is protective6,8. More specifically, sometimes dietary fat is the key risk factor either because of quality or quantity3,9. Other times sugar or the high intake of ultra-processed foods is considered the greatest threat to human health10, increasing the risk of obesity and associated diseases10-12.
Food patterns reflect individual preferences influenced by genetic and environmental factors. Today the environment is highly obesogenic, driven mainly by the vested interest of the food and advertising industries. Studies of food patterns allow assessing their global health effects on a population13,14, hence the great interest in this subject.
Different diet quality assessment indices or scores have been developed based on admittedly healthy dietary patterns or food guides for the general population, or aiming to prevent diet-related diseases15. Parameters such as macronutrient distribution and a balance between the food groups are usually present. These instruments allow the monitoring of dietary changes in population groups. They are also used in cross-sectional or temporal individual assessment to assess their results.
Currently, nutritional epidemiology proposes two methods for analyzing dietary patterns more comprehensively: a priori analysis, which includes the use of diet quality scores based on food guides or admittedly healthy diets16, and a posteriori analysis, which uses multivariate
statistical methods to investigate the dietary pattern of the study population17-19.
Even validated diet quality scores usually find only modest associations between diet and risk of death or diseases15, suggesting the complexity of their causal relationship and instrument limitations. The accuracy of these instruments depends on the tester’s ability to understand the characteristics of the various individual or group indices and their capabilities and limitations, which may be facilitated by reviewing pertinent studies13.
Given the importance of the relationship between diet and NCD, the objective of this review is to describe the main instruments used for assessing diet quality a priori (Mediterranean Diet Score) and a posteriori (Diet Quality Index, Healthy Eating Index, Overall Nutritional Quality Index) and the applications and limitations associated with their use and interpretation.
M E T H O D S
Studies on diet quality scores and their validations and uses published by June 2014 were searched in the database Web of Science using the keywords “diet quality index”, “Mediterranean diet”, “diet score”, and “health eating index”. Studies published in English, Portuguese, and Spanish were selected. Original and review articles were included. Of the fifty studies found, ten were excluded because they did not include the study subject as the study objective (n=3), or regarded diseases such as liver diseases, diabetes, cancer, and neurological diseases (n=7). Based on the pertinence of the subject for this review, the references cited in the articles were also included, as well as classic studies about different dietary assessment indices.
R E S U L T A N D D I S C U S S I O N
Healthy Eating Index (HEI)21, Mediterranean Diet Score (MDS)22,23, and the Overall Nutritional Quality Index (ONQI)24. Some other instruments have been developed using these indices as reference and the words ‘adapted’, ‘revised’, or ‘new version’ added to their names in reference to the original (Table 1).
Diet Quality Index
The original Diet Quality Index20 was developed to assess the intake of eight food groups and the recommendations of the Committee on Diet and Health of the National Research Council Food and Nutrition Board39 and of the United States government. Drewnowski
et al.25 presented a simplified DQI version (DQI-a I), adapted for a dietary survey in France. In this adaptation, a maximum score of five points reflected the following attributes: (1) less than 30% energy from fats; (2) less than 10% energy from saturated fats; (3) cholesterol intake up to
300 mg per day; (4) more than 50% energy from carbohydrates; and (5) less than 10% energy from sucrose. These parameters were assessed in absolute terms (yes/no). In addition to these five DQI elements, the authors scored variety (dietary variety) and diversity (number of food groups present in the diet). Thus, this index excluded the parameters protein, sodium, calcium, and fruit and non-starchy vegetable servings, present in the original version.
In a second adaptation (DQI-a II), this same group of researchers modified one of the five DQI-a I score points, replacing the parameter ‘less than 10% energy from sucrose’ by the parameter ‘sodium intake below 2,500 mg’. Again dietary variety score was assessed separately. The authors used this instrument to compare the dietary patterns of American youth and older individuals by recording food intake during fourteen consecutive days. A significant association was not found between diet variety and DQI-a II26, suggesting that the component ‘variety’ proposed by this instrument still presented limitations.
Table 1. Diet quality assessment indices and studies that introduced or used them.
Diet Quality Index (DQI)
Adapted Diet Quality Index (DQI-a I) Adapted Diet Quality Index (DQI-a II) Revised Diet Quality Index (DQI-R) International Diet Quality Index (DQI-I ) Healthy Eating Index (DQI)
HEI-2005 HEI-2010
Brazilian Diet Quality Index (BDQI)
HEI adaptation to the Brazilian Food Guide (HEI-ad) Brazilian Diet Quality Index revised (BDQI-R) Mediterranean Diet Score (MDS), original and modified
Mediterranean Dietary Pattern adherence index (MDP) Cardioprotective Mediterranean diet index (Cardio) Mediterranean-Dietary Quality Index (Med -DQI) Mediterranean Style Dietary Pattern Score (MSDPS) Overall Nutritional Quality Index (ONQI)
Patterson et al. (1994)20 Drewnowski et al. (1996)25 Drewnowski et al. (1997)26 Haines et al. (1999)27 Kim et al. (2003)28 Kennedy et al. (1995)21 Guenther et al. (2008)29 Guenther et al. (2013)30 Fisberg et al. (2004)31 Mota et al. (2008)32 Previdelli et al. (2011)33
Trichopoulou et al. (1995)22; Trichopoulou et al. (2003)23; Hu et al. (2002)34. Sanchez-Villega et al. (2002)35
Martinez-Gonzalez et al. (2004)36 Gerber (2006)37
Later, changes in the American Food Guide Pyramid and Dietary Reference Intakes (DRI) were included in the Revised DQI (DQI-R), which introduced the measurement of food proportionality, moderation, and variety as dietary quality parameters27. Proportionality regards the recommendation of consuming a higher number of servings of certain food groups and a fewer number of other food groups. The parameter moderation involves limiting the intake of food components that contribute to health risk, such as fat, salt, and sugar. Finally, variety includes inter-and intragroup variety, consequently, consumption of more food components. This instrument, with
a maximum score of 100 points, is based on the food pyramid and the DRIs for calcium and iron. Table 2 shows the DQI-R components.
In order to allow the comparison of food patterns between countries based not only on the association between diet and NCD but also on the risk of malnutrition still present in the epidemiological transition, Kim et al.28 proposed the international DQI (DQI-I). These authors compared the food practices between China and the United States and assessed the dietary patterns of the two countries using concepts of variety, adequacy, moderation, and balance. The
Table 2. Revised Diet Quality Index (IQD-R) components 27.
Total fat ≤30% of the energy consumed
Saturated fat ≤10% of the energy consumed
Dietary cholesterol <300 mg/day
Two to four servings of fruits per day, % of recommended servings
Three to five servings of non-starchy vegetables per day, % of recommended servings
Six to eleven servings of grains per day, % of recommended servings
Calcium intake as % AI by age, % of recommended intake
Iron intake as % RDA by age
Diet diversity score
Food moderation score
0-10 points
0-10 points
0-10 points
0-10 points
0-10 points
0-10 points
0-10 points
0-10 points
0-10 points
0-10 points
≤30% = 10 >30%, ≤40% = 5
>40% = 0
≤10% = 10 >10%, ≤13% = 5
>13% = 0
≤300 mg = 10 >300 mg, ≤400 mg = 5
>400 mg = 0
≥100% =10 99%- 50% = 5
<50% = 0
≥100% = 10 99%- 50% = 5
<50% = 0
≥100% = 10 99%- 50% = 5
<50% = 0
≥100% = 10 99%- 50% = 5
<50% = 0
≥100% = 10 99%- 50% = 5
<50% = 10
≥6
≥3, <6 <3
≥7
≥4, <7 <4
Assessment levels
Component Score
dietary components were extensively assessed, including food pyramid inter- and intragroup variety; intake of certain nutrients (iron, calcium, vitamin C, fat, sodium), cholesterol, and empty calories; and macronutrient and fatty acid ratios (poly-, mono-, and saturated fatty acids). Although the instrument allows the comparison of many dietary elements, the numerous variables and extensive information required to assess adequacy introduce a level of complexity that hinders its use.
Other Diet Quality Index proposals have been developed for different populations and life stages40-42, each with specific characteristics. The existence of multiple revised and adapted DQI instruments not only hinders the understanding of their assessment focus but also limits the possibility of comparing the dietary surveys of different population groups.
Health Eating Index
The Healthy Eating Index (HEI) was developed by Kennedy et al.21 to investigate American eating habits and their compliance with the dietary guidelines provided by the Recommended Dietary Allowances (RDA) of the U.S. Departments of Agriculture (USDA) and of Health and Human Services in 1980.The HEI was developed by the USDA (1989-1990), and it is updated at every five years.
The original Healthy Eating Index analyzes five food and nutrient groups, namely grains, vegetables, fruits, milk and dairy products, and meats, which receive a score of 0 to 10 according to the number of servings consumed from each group. Diet variety and some nutrients, such as total fat, saturated fat, cholesterol, and sodium, are also scored 0 to 10 points. Diet quality increases with score (Table 3).
The subsequent HEI updates, namely HEI-200529 and HEI-201030, changed the food groups and nutrients but maintained the direct relationship between diet quality and score. The current subdivision is represented by food groups
separated by compliance criteria and intake moderation. Compliance parameters included total fruit (including juices); whole fruits (except juices); total vegetables (including all types of beans and peas not included in the total protein sources); green vegetables and beans (including all types of beans and peas not included in the total protein sources); whole grains; milk and dairy products; total protein sources; seafood and plant protein (including nuts, seeds, and soybean products); and fatty acids (the ratio between poly-and monounsaturated fatty acids to saturated fatty acids). Moderation parameters include refined grains, sodium, and empty calories (solid fats, alcohol, and added sugar).
The scores are still based on the amount of energy coming from each group expressed as energy density (serving/1,000 kcal). For the compliance parameter, the scores are highest when intake equals or exceeds the RDA. In the moderation parameter, the maximum score indicates an intake equal to or below the RDA.
Generally, the HEI assesses diet quality and appropriateness of consumed food groups and nutrients. The results may indicate a need of nutritional interventions for specific groups or populations.
Mediterranean Diet Score
Table 3. Components and score standards versions HEI-1990, HEI-2005, and HEI-2010.
HEI-1990(Kennedy et al., 1995)21
Food groups Grains Vegetables Fruits Milk Meat Recommendations Total fat Saturated fat Cholesterol Sodium Diet variety
HEI-2005 (Guenter et al., 2008)29
Group adequacy
Total fruits Whole fruits Total vegetables Dark green and orangish vegetables and legumes Total grains
Whole grains Milk
Meat and beans Oils
Group moderation
Saturated fat Sodium Sofaas Calories
HEI-2010(Guenter et al., 2013)30
Group adequacy
Total fruits Whole fruits Total vegetables
Green vegetables and beans Whole grains
Dairy products Total protein sources Seafood and plant protein Fatty acids
Group moderation Refined grains Sodium Empty calories Components of the Healthy Eating Indexes
Minimum score (0 points)
0 serving (no intake) 0 serving
0 serving 0 serving 0 serving
≥45% of the tei
≥15% of the tei
≥of 450 mg
≥of 4.8 g
intake of 6 or fewer types of foods over three days
Minimum score (0 points)
no intake no intake no intake no intake no intake no intake no intake no intake no intake
≥15% of the tei
≥2,0 g per 1,000 kcal
≥50% of the tei Minimum score (0 points)
no intake no intake no intake no intake no intake no intake no intake no intake
≥4.3 ounces per 1,000 kcal
≥2,0g per 1,000 kcal
≥50% of the tei Maximum score (10 points)
6-11 servings 3-5 servings 2-4 servings 2 a 3 servings 2 a 3 servings
≤30% of the tei1
less than 10% of the tei less than 300 mg less than 2.4 g
intake of 16 types of foods over three days
Maximum score (5 a 10 points)
≥0.8 cup per 1,000 kcal
≥0.4 cup per 1,000 kcal
≥1.1 cups per 1,000 kcal
≥0.4 cup per 1,000 kcal
≥3.0 ounces2per 1,000 kcal
≥1.5 ounces per 1,000 kcal
≥1.3 cups per 1,000 kcal
≥2.5 ounces per 1,000 kcal
≥12 g per 1,000 kcal
≤07% of the tei
≤0.7 g per 1,000 kcal
≤20% of the tei
Maximum score (5 a 10 points)
≥0.8 cup per 1,000 kcal
≥0.4 cup per 1,000 kcal
≥1.1 cups per 1,000 kcal
≥0.2 cup per 1,000 kcal
≥1.5 ounces per 1,000 kcal
≥1.3 cups per 1,000 kcal
≥2.5 ounces per 1,000 kcal
≥0.8 ounces per 1,000 kcal (Pufas + Mufas)/saturated >2.5
≤1.8 ounces per 1,000 kcal
≤1.1 g per 1,000 kcal
≤19% of the tei
Minimum Maximum
Score
0 to 10 0 to 10 0 to 10 0 to 10 0 to 10
0 to 10 0 to 10 0 to 10 0 to 10 0 to 10
Score 5 5 5 5 5 5 10 10 10 10 10 20 Score 5 5 5 5 10 10 5 5 10 10 10 20 Points Score
Note:1Total energy intake; 2Ounce: 1 ounce equals 28,35 g.
bordering the Mediterranean Sea45. Later, other studies confirmed and provided new pieces of epidemiologic evidence that the traditional Mediterranean Diet, along with healthy life habits, may protect against NCD, such as coronary artery disease, stroke, diabetes type 246, and obesity47, and reduce inflammatory and coagulation processes48. Indeed, high adherence to the Mediterranean diet is associated with a low risk of inappropriate nutrient intake49.
In summary, the Mediterranean Diet is characterized by high intake of olive oil (main source of lipids), non-starchy vegetables, legumes, whole grains, and fruits, including nuts; moderate intake of poultry and fish (depending on proximity to the coast); low intake of whole milk and dairy products and red meats; and low to moderate intake of wine as the main source of alcohol during the meals45. Over time, other foods were incorporated because more information regarding the traditional Mediterranean Diet of reference became available, which included less typical foods such as eggs, animal fats, margarine, beverages with added sugar, cakes, pies, cookies, and sugar50,51.
Generally, indices that estimate adherence to the Mediterranean Diet were constructed using deduction, that is, by combining specific components ordered by cut-off points, later added to compose a final score. The number of components (foods, food groups, or a combination of nutrients, foods, and food groups); classification categories for each component; assessment scales; statistical parameters (mean, median, or daily intake cut-off amounts); and the positive or negative contribution of each component to the total score varied greatly between indices, resulting in an important variation in internal consistency52.
Originally, Trichopoulou et al.22 proposed an index that gave its components a positive or nil score and called it the Mediterranean Diet Score (MDS), developed to measure the degree of adherence to the traditional Mediterranean diet. This diet was characterized by eight
components as follows: (1) higher consumption of monounsaturated than saturated fatty acids; high intake of (2) fruits and nuts; (3) non-starchy vegetables; (4) legumes; and (5) starches (including potatoes); moderate intake of (6) alcohol; low intake of (7) meat and meat products and (8) milk and dairy products. Later they added the group (9) seafood34. The MDS scored items 0 to 1 depending on the daily intake of each of its nine components. The cut-off points were given by the study sample’s median intake of each component by gender23. Each ‘protective’ component, such as fruits and non-starchy vegetables, received a score of one if an individual’s intake exceeded the median intake; or a score of zero if an individual’s intake was equal to or below the median intake. Each ‘nonprotective’ component (like meats and dairy products) received a score of one if an individual’s intake was below the median intake; and a score of zero if an individual’s intake was equal to or above the median intake. For alcohol, one point was given to men who consumed 10 g to 50 g
per day and to women who consumed 5 g to 25 g per day. The MDS varied from zero, meaning a minimum adherence to the traditional Mediterranean diet, to 9, meaning maximum adherence.
There are other indices that add or subtract standardized components to express adherence to the Mediterranean diet as a relative percentage. One such index is the Mediterranean Dietary Pattern Adherence Index (MDP)35. Initially, the intake of each component is adjusted for energy, and the result is standardized as a Z-score (mean and standard deviation). The total Z-score is given by adding all the Z-scores of the ‘protective’ components and subtracting the Z-scores of the ‘nonprotective’ components. Finally, the relative percentage of adherence to the Mediterranean diet is calculated by using the maximum and minimum Z-scores of the sample.
fibers, fruits, non-starchy vegetables, fish, and alcohol) and nonprotective food items (meat and meat products, and foods with high glycemic index) were defined. Intakes of protective and nonprotective foods were divided into quintiles. Each participant received a positive score of 1 (smallest) to 5 (highest), corresponding to his protective food intake quintile, and a negative score of 1 to 5 corresponding to his nonprotective food intake quintile. Later, a second post hoc index was constructed using only one cut-off point for these eight food components/groups, according to the dose-response relationship between the intake of each and the risk of myocardial infarction given by analyses based on the intake quintile of each food item.
When the original Diet Quality Index20 was administered to a sample of the Mediterranean population, it was inadequate to classify the population in that there was no gradient of consumption with increasing scores, resulting in the Mediterranean Diet Quality Index (Med-DQI)37. In this instrument, the olive oil score was inversely proportional to its intake. The item ‘protein’ was replaced by meat because fish was also scored proportionally and inversely to intake. Each group of nutrients or foods received a score from 0 to 2 based on the recommended intake, or if no recommendation existed, the score was based on the population’s intake tertiles. The total score of each component was calculated and added to give a total Med-DQI score that decreases with diet healthiness.
The Mediterranean-Style Dietary Pattern Score (MSDPS)38 was developed for the American population and is based on the recommended amounts of the 13 food groups of the Mediterranean Diet Pyramid53. Each food group receives a score from 0 to 10 according to compliance with the recommended intakes. The score decreases as the degree of exceedance of the recommendations increases. The maximum score was standardized to 100 points and weighted proportionally to the energy intake from Mediterranean diet foods, that is, these foods received higher weights.
Panagiotakos et al.54,55 created a similar instrument called “MedDietScore”, an index that estimates the level of adherence to the Mediterranean Diet, and a software based on this index that calculates adherence and its association with cardiovascular risk.
Although methodological issues regarding the Mediterranean Diet composition and its ability to identify health risks remain weaknesses, these indices have been used by many studies to investigate the association between adherence to the Mediterranean Diet and risk of NCD19.
Overall Nutritional Quality Index
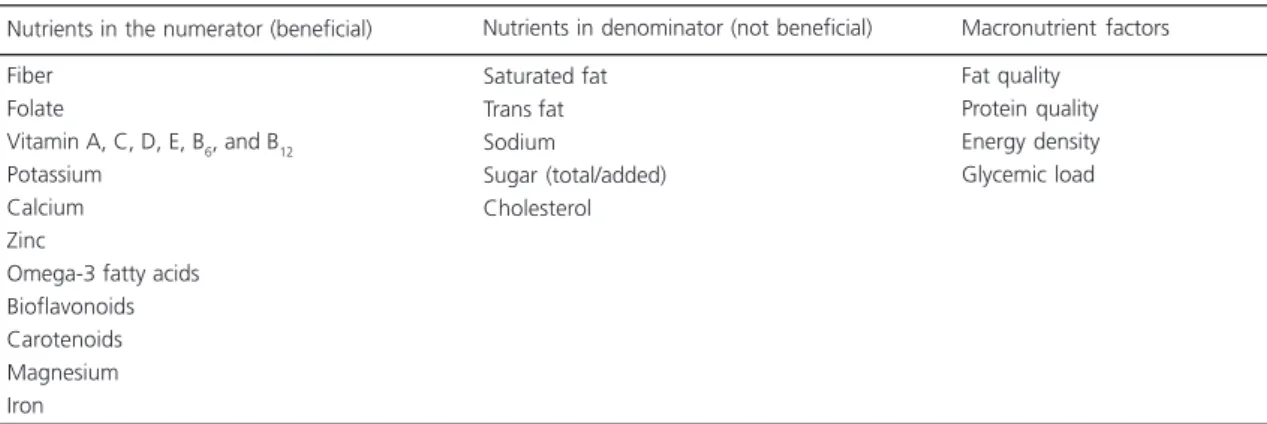
Yale University researchers proposed a way for assessing the overall nutritional quality of foods called Overall Nutritional Quality Index (ONQI)24. A multidisciplinary team of experts in nutrition and public health began this project in 2003 in an attempt to develop a food assessment method that takes into account the food’s nutritionally beneficial and detrimental components. They created an extensive algorithm with more than 30 nutritional parameters and weight coefficients. The coefficients represented the possible epidemiological associations between a nutrient and its respective NCD-related outcomes. The result of the algorithm was a score attributed to each food. Hence, the scores ONQI attributed to foods enabled consumers to make healthier food choices.
Overall Nutritional Quality Index scores foods from 1 to 100 based on their nutritional characteristics. Higher scores mean lower risk of NCD24.
algorithm. Some nutritional factors, such as fat and protein quality, were placed in the numerator, while energy density and glycemic load were placed in the denominator.
In addition to the abovementioned nutritional aspects, another key element of this algorithm was the use of a dietary parameter. The dietary contribution of each food was also assessed. In other words, the researchers determined how the nutrient content of a food contributed to its daily requirement. Furthermore, this parameter also indicated how consuming a food could affect the recommended intake of its other nutrients. This parameter was named Trajectory Score (TS)24.
Overall Nutritional Quality Index content, construct, criterion, and face (tested the acceptance of the questionnaire by consumers at a supermarket) validation tests were performed. The results were highly significant, and regression analysis indicated excellent agreement between ONQI and HEI diet scores24. Later, the authors published new validation tests using data from the 2003-2006 National Health and Nutrition Examination Survey (NHANES) and provided a platform called Nutritional Guidance System -NuVal (http://www.nuval.com), where foods have ONQI scores according to their nutritional quality56.
Chiuve et al.57 prospectively assessed whether ONQI was capable of predicting lower
NCD risk using data from more than 60 thousand individuals followed from 1986 to 2006 by the Nurses’ Health Study. All foods consumed by the participants at baseline received ONQI scores, with subsequent calculation of their diet’s mean ONQI score. The researchers found that consumption of foods with high ONQI scores was associated with a modest reduction in the risk of NCD and all-cause mortality.
However, the algorithm is not of public domain, it is only available online. The absence of validation studies comparing ONQI with a gold standard is a limitation for its use58. The ONQI is an alternative system developed for the American population and because it scores foods individually instead of scoring the diet, its use is unique.
Use of the indices on the Brazilian population
In Brazil, Fisberg et al.31 adapted and validated the original HEI21 and named it Brazilian Diet Quality Index (BDQI). This DQI adapted for the Brazilian population Índice de Qualidade da Dieta Brasileira (IDQB) does not use the same variables as the original American DQI20. The similar names may cause confusion in data analyses and interpretation when studies that use these indices are compared.
The Brazilian Diet Quality Index includes dietary nutrients, foods, and constituents in a Table 4. Nutrients and macronutrient factors of the Overall Nutritional Quality Index (ONQI) algorithm24.
Fiber Folate
Vitamin A, C, D, E, B6, and B12 Potassium
Calcium Zinc
Omega-3 fatty acids Bioflavonoids Carotenoids Magnesium Iron
Saturated fat Trans fat Sodium
Sugar (total/added) Cholesterol
combined manner with regard to the dietary recommendations. Its score is also based on HEI-199521, that is, it scores the intake of food group servings and specific nutrients. In this study21, the authors found an association between diet quality and demographic and socioeconomic factors and lifestyle habits, and identified possibly vulnerable population groups.
The Brazilian Diet Quality Index was updated and revised for the publication of the 2006 Brazilian Food Guide59 since the latter is based on diet quality, given by correct food group intake. Previdelli et al.33 published the BDQI Revised (BDQI-R) similar to HEI-2005, which scores according to the amount of energy consumed from each food group.
In order to verify BDQI-R’s reliability and validity, Andrade et al.60 used the 24-hour recall to analyze the dietary habits of a subsample of 2,375 people from the city of São Paulo. The BDQI-R was analyzed for content, construct, and discriminant validity; and reliability. The authors suggest that the BDQI-R has good reliability to assess and monitor the diet quality of the Brazilian population.
Freitas et al.61 made a literature review on the diet quality of older Brazilians and found that 28% of the studies used the BDQI-R to analyze diet quality, suggesting that this instrument can be used not only for the general population but also for this group. Other studies used the BDQI-R in adolescents and also found that this tool can be used in this specific group with satisfactory results62-64.
Mota et al.32 made another adaptation of the HEI-199521 to the Brazilian population based on the Brazilian Food Guide59 and the Adapted Food Pyramid65. The resulting index was named Healthy Eating Index adapted (HEI-ad). The ideal number of servings was changed to match those proposed by the Adapted Food Pyramid, and the groups ‘legumes’, ‘sweets and sugars’, and ‘fats and oils’ were included, and the item ‘sodium’ was excluded. The HEI-ad scores a total of twelve
components and classifies the diet as a) good quality (score >100 points); b) needs improvement (71 ≤ score ≤ 100 points); and c) poor quality (score <71 points). Another study used the HEI-ad for assessing the diet quality of hypertensive individuals and found that high-quality diets were associated with smaller changes in systolic blood pressure66.
Thomazella et al.67 used the Cardioprotective Mediterranean Diet Index36 to compare the effects of the Mediterranean Diet and a low-fat diet on 42 men with a history of coronary events but found no significant differences between the two dietary patterns.
Monteiro et al.64 created a new food classification system that reflected the extent and purpose of commercial food processing (unprocessed or minimally processed foods; processed ingredients; and ultra-processed foods). The system aimed to investigate the impact of such foods on the global quality of the diet of Brazilian families. It is used in the current version (publicly available in May 2014) of the Brazilian Food Guide68, which recommends the consumption of unprocessed or homemade foods over ready-to-eat foods and ultra-processed foods. Other Brazilian64,69,70, Colombian71, and Canadian72 studies have also discussed the intake of ultra-processed foods, used the new classification system to assess specific populations69,71, and associated the intake of ultra-processed foods with chronic diseases73.
F I N A L C O N S I D E R A T I O N S
The results show the importance of choosing appropriate indices to assess diet quality. Not understanding the types of indices and using them incorrectly in professional practice is common, whether due to poor translation, excessive number of adaptations, or similarity between assessment parameters.
and the risk of diseases and death, raising issues such as their limitations and the complexity involved in measuring the causal relationship between diet and health parameters.
Therefore, these instruments should be used with caution not only with respect to the method of administration but also to the possible inferences made from their results.
C O N T R I B U T O R S
KMB CARVALHO was responsible for defining the topics, methodology of bibliographic search and writing the first version of the manuscript. All the authors contributed for the final version, including content, bibliography and form.
R E F E R E N C E S
1. World Health Organization. Diet, nutrition and the prevention of chronic diseases. Geneva: WHO; 2003. Technical Report Series, nº 916.
2. Drake I, Gullberg B, Sonestedt E, Wallstrom P, Persson M, Hlebowicz J, et al. Scoring models of a diet quality index and the predictive capability of mortality in a population-based cohort of Swedish men and women. Public Health Nutr. 2013; 16(3):468-78.
3. Willett WC, Stampfer ML. Current evidence on healthy eating. An Rev Public Health. 2013; 34(34):77-95
4. Hu FB, Willett WC. Optimal diets for prevention of coronary heart disease. JAMA. 2002; 288(20): 2569-78.
5. Baxter AJ, Coyne T, McClintock C. Dietary patterns and metabolic syndrome: A review of epidemiologic evidence. Asia Pacific J Clin Nutr. 2006; 15(2):134-42. 6. World Cancer Research Fund. Food, nutrition, and
the prevention of cancer: A global perspective. Washington (DC): AICR; 2007.
7. Hlebowicz J, Drake I, Gullberg B, Sonestedt E, Wallstrom P, Persson M, et al. A high diet quality is associated with lower incidence of cardiovascular events in the Malmo Diet and Cancer Cohort. PLOS ONE. 2013; 8(8). doi: 10.137/jornal.pone.0071095 8. Boeing H, Bechthold A, Bub A, Ellinger S, Haller D, Kroke A, et al. Critical review: Vegetables and fruit in the prevention of chronic diseases. Eur J Nutr. 2012; 51(6):637-63.
9. Skerrett PJ, Willett WC. Essentials of healthy eating: A guide. J Midwifery Womens Health. 2010; 55(6):492-501.
10. Kaluza J, Hakansson N, Brzozowska A, Wolk A. Diet quality and mortality: A population-based prospective study of men. Eur J Clin Nutr. 2009; 63(4):451-7.
11. Monteiro CA, Levy RB, Claro RM, Ribeiro de Castro IR, Cannon G. Increasing consumption of ultra-processed foods and likely impact on human health: Evidence from Brazil. Public Health Nutr. 2011; 14(1):5-13.
12. Zarrin R, Ibiebele TI, Marks GC. Development and validity assessment of a diet quality index for Australians. Asia Pac J Clin Nutr. 2013; 22(2):177-87. 13. Ocke MC. Evaluation of methodologies for
assessing the overall diet: Dietary quality scores and dietary pattern analysis. Proc Nutr Soc. 2013; 72(2):191-9.
14. Kant AK. Dietary patterns and health outcomes. J Am Diet Assoc. 2004; 104(4):615-35.
15. Waijers PMCM, Feskens EJM, Ocke MC. A critical review of predefined diet quality scores. Br J Nutr. 2007; 97(2):219-31.
16. Hoffmann K, Zyriax BC, Boeing H, Windler E. A dietary pattern derived to explain biomarker variation is strongly associated with the risk of coronary artery disease. Am J Clinical Nutr. 2004; 80(3):633-40.
17. Kastorini C-M, Papadakis G, Milionis HJ, Kalantzi K, Puddu P-E, Nikolaou V, et al. Comparative analysis of a-priori and a-posteriori dietary patterns using state-of-the-art classification algorithms: A case/case-control study. Artif Intell Med. 2013; 59(3):175-83.
18. Bach A, Serra-Majem L, Carrasco JL, Roman B, Ngo J, Bertomeu I, et al. The use of indexes evaluating the adherence to the Mediterranean diet in epidemiological studies: A review. Public Health Nutr. 2006; 9(1A):132-46.
19. Kourlaba G, Panagiotakos DB. Dietary quality indices and human health: A review. Maturitas. 2009; 62(1):1-8.
20. Patterson RE, Haines PS, Popkin BM. Diet quality index: Capturing a multidimensional behavior. J Am Diet Assoc. 1994; 94(1):57-64.
21. Kennedy ET, Ohls J, Carlson S, Fleming K. The healthy eating index: Design and applications. J Am Diet Assoc. 1995; 95(10):1103-8.
22. Trichopoulou A, Kourisblazos A, Wahlqvist ML, Gnardellis C, Lagiou P, Polychronopoulos E, et al.
23. Trichopoulou A, Costacou T, Bamia C, Trichopoulos D. Adherence to a Mediterranean diet and survival in a Greek population. New Engl J Med. 2003; 348(26):2599-608.
24. Katz DL, Njike VY, Faridi Z, Rhee LQ, Reeves RS, Jenkins DJA, et al. The stratification of foods on the basis of overall nutritional quality: The overall nutritional quality index. Am J Health Promo. 2009; 24(2):133-43.
25. Drewnowski A, Henderson SA, Shore AB, Fischler C, Preziosi P, Hercberg S. Diet quality and dietary diversity in France: Implications for the French paradox. J Am Dietetic Assoc. 1996; 96(7):663-9. 26. Drewnowski A, Henderson SA, Driscoll A, Rolls BJ. The dietary variety score: Assessing diet quality in healthy young and older adults. J Am Diet Assoc. 1997; 97(3):266-71.
27. Haines PS, Siega-Riz AM, Popkin BM. The Diet Quality Index Revised: A measurement instrument for populations. J Am Diet Assoc. 1999; 99(6):697-704. 28. Kim S, Haines PS, Siega-Riz AM, Popkin BM. The
Diet Quality Index - International (DQI-I) provides an effective tool for cross-national comparison of diet quality as illustrated by China and the United States. J Nutr. 2003; 133(11):3476-84
29. Guenther PM, Reedy J, Krebs-Smith SM, Reeve BB. Evaluation of the Healthy Eating Index - 2005. J Am Diet Assoc. 2008; 108(11):1896-901. 30. Guenther PM, Casavale KO, Reedy J, Kirkpatrick
SI, Hiza HAB, Kuczynski KJ, et al. Update of the Healthy Eating Index: HEI-2010. J Acad Nutr Diet. 2013; 113:569-80.
31. Fisberg RM, Slater B, Barros RR, Lima FDd, Cesar CLG, Carandina L, et al. Índice de Qualidade da Dieta: avaliação da adaptação e aplicabilidade. Rev Nutr. 2004; 17(3):301-18. doi: 10.1590/S1415-52 732004000300003
32. Mota JF, Madalena Rinaldi AE, Pereira AF, Maesta N, Scarpin MM, Burini RC. Adaptação do índice de alimentação saudável ao guia alimentar da popu-lação brasileira. Rev Nutr. 2008; 21(5):545-52. doi: 10.1590/S1415-52732008000500007
33. Previdelli AN, Andrade SC, Pires MM, Gouvea Ferreira SR, Fisberg RM, Marchioni DM. A revised version of the Healthy Eating Index for the Brazilian population. Rev Saúde Pública. 2011; 45(4):794-8. 34. Hu FB, Bronner L, Willett WC, Stampfer MJ, Rexrode KM, Albert CM, et al. Fish and omega-3 fatty acid intake and risk of coronary heart disease in women. JAMA. 2002; 287(14):1815-21.
35. Sanchez-Villegas A, Martinez JA, Irala J, Martinez-Gonzalez MA, Grp SUNR. Determinants of the adherence to an “a priori” defined Mediterranean dietary pattern. Eur J Nutr. 2002; 41(6):249-57.
36. Martinez-Gonzalez MA, Fernandez-Jarne E, Serrano-Martinez M, Wright M, Gomez-Gracia E. Development of a short dietary intake questionnaire for the quantitative estimation of adherence to a cardioprotective Mediterranean diet. Eur J Clin Nutr. 2004; 58(11):1550-2.
37. Gerber M. Qualitative methods to evaluate Mediterranean diet in adults. Public Health Nutr. 2006; 9(1A):147-51.
38. Rumawas ME, Dwyer JT, McKeown NM, Meigs JB, Rogers G, Jacques PF. The Development of the Mediterranean-style dietary pattern score and its application to the american diet in the Framingham Offspring cohort. J Nutr. 2009; 139(6):1150-6. 39. National Research Council, Food and Nutrition
Board. Recommended Dietary Allowances. 10th ed.
Washington (DC): National Academy Press; 1989. 40. Godoy FdC, Andrade SC, Morimoto JM, Carandina L, Goldbaum M, Barros MBA, et al. Índice de qualidade da dieta de adolescentes residentes no distrito do Butantã, município de São Paulo, Brasil. Rev Nutr. 2006; 19(6):663-71. doi: 10.1590/S1415-52 732006000600003
41. Kim EHJ, Willett WC, Fung T, Rosner B, Holmes MD. Diet quality indices and postmenopausal breast cancer survival. Nutr Cancer. 2011; 63(3):381-8. 42. Lassale C, Fezeu L, Andreeva VA, Hercberg S,
Kengne AP, Czernichow S, et al. Association between dietary scores and 13-year weight change and obesity risk in a French prospective cohort. Int J Obes. 2012; 36(11):1455-62.
43. Trichopoulou, A. Mediterranean diet: The past and the present. Nutr Metabol Cardiovas. 2001; 11(4 Suppl):1-4.
44. Keys A, Menotti A, Karvonen MJ, Aravanis C, Blackburn H, Buzina R et al. The diet and 15-year death rate in the seven countries study. Am J Epidemiol. 1986; 124:903-15.
45. Sofi F. The Mediterranean diet revisited: Evidence of its effectiveness grows. Curr Opinion Cardiol. 2009; 24(5):442-6.
46. Willett WC. The Mediterranean diet: Science and practice. Public Health Nutr. 2006; 9(1A):105-10. 47. Panagiotakos DB, Chrysohoou C, Pitsavos C,
49. Castro-Quezada I, Roman-Vinas B, Serra-Majem L. The Mediterranean diet and nutritional adequacy: A review. Nutrients. 2014; 6(1):231-48.
50. Fidanza F. Who remembers the true Italian Mediterranean diet? Diabetes Nutr Metabol. 2001; 14(3):119-20.
51. Fidanza F, Alberti A, Lanti M, Menotti A. Mediterranean Adequacy Index: Correlation with 25-year mortality from coronary heart disease in the Seven Countries Study. Nutr Metabol Cardiovas. 2004; 14(5):254-8.
52. Mila-Villarroel R, Bach-Faig A, Puig J, Puchal A, Farran A, Serra-Majem L, et al. Comparison and evaluation of the reliability of indexes of adherence to the Mediterranean diet. Public Health Nutr. 2011; 14(12A):2338-45.
53. Willett WC, Sacks F, Trichopoulou A, Drescher G, Ferroluzzi A, Helsing E, et al. Mediterranean diet pyramid: A cultural model for healthy eating. Am J Clin Nutr. 1995; 61(6):S1402-S6.
54. Panagiotakos DB, Milias GA, Pitsavos C, Stefanadis C. MedDietScore: A computer program that evaluates the adherence to the Mediterranean dietary pattern and its relation to cardiovascular disease risk. Comput Meth Prog Biomed. 2006; 83(1):73-7.
55. Panagiotakos DB, Pitsavos C, Stefanadis C. Dietary patterns: A Mediterranean diet score and its relation to clinical and biological markers of cardiovascular disease risk. Nutr Metabol Cardiovas. 2006; 16(8):559-68.
56. Katz DL, Njike VY, Rhee LQ, Reingold A, Ayoob KT. Performance characteristics of NuVal and the Overall Nutritional Quality Index (ONQI). Am J Clin Nutr. 2010; 91(4):1102S-8S.
57. Chiuve SE, Sampson L, Willett WC. The association between a nutritional quality index and risk of chronic disease. Am J Prev Med. 2011; 40(5):505-13. 58. Reedy J, Kirkpatrick SI. The use of proprietary
nutrient profiling tools in nutrition science and policy a commentary. Am J Prev Med. 2011; 40(5):581-2. 59. Brasil. Ministério da Saúde. Guia alimentar para a população brasileira: promovendo a alimentação saudável. Brasília: Ministério da Saúde; 2006. Série A. Normas e Manuais Técnicos, nº 210.
60. Andrade SCd, Previdelli AN, Marchioni DML, Fisberg RM. Avaliação da confiabilidade e validade do Indice de Qualidade da Dieta Revisado. Rev Saúde Pública. 2013; 47(4):675-83.
61. Freitas TI, Previato M, Aquino RC, Buriti MA. Ava-liação da qualidade da dieta de idosos no Brasil: produção científica sobre o tema. Rev Kairós Gerontol. 2013; 16(4):195-213.
62. Wendpap LL, Ferreira MG, Melo Rodrigues PR, Pereira RA, Loureiro AdS, Veras Goncalves-Silva RM.
Adolescents’ diet quality and associated factors. Cad Saúde Pública. 2014; 30(1):97-106.
63. Andrade SC, Azevedo Barros MB, Carandina L, Goldbaum M, Galvão Cesar CL. Dietary Quality Index and associated factors among adolescents of the state of São Paulo, Brazil. J Pediatr. 2010; 156(3):456-60.
64. Monteiro CA, Levy RB, Claro RM, Ribeiro de Castro IR, Cannon G. A new classification of foods based on the extent and purpose of their processing. Cad Saúde Pública. 2010; 26(11):2039-49.
65. Philippi ST, Latterza AR, Cruz ATR, Ribeiro LC. Pirâmide alimentar adaptada: guia para escolha dos alimentos. Rev Nutr. 1999; 12(1):65-80. doi: 10.1590/S1415-52731999000100006
66. Oliveira EP, Camargo KF, Fullin Castanho GK, Nicola M, Portero-McLellan KC, Burini RC. Dietary variety is a protective factor for elevated systolic blood pressure. Arq Bras Cardiol. 2012; 98(4):338-43. 67. Thomazella MCD, Goes MFS, Andrade CR, Debbas
V, Barbeiro DF, Correia RL, et al. Effects of high adherence to mediterranean or low-fat diets in medicated secondary prevention patients. Am J Cardiol. 2011; 108(11):1523-9.
68. Brasil. Ministério da Saúde. Guia alimentar para a população brasileira: promovendo a alimentação saudável. Brasília: Ministério da Saúde; 2014. 69. Tavares LF, Fonseca SC, Garcia Rosa ML, Yokoo EM.
Relationship between ultra-processed foods and metabolic syndrome in adolescents from a Brazilian Family Doctor Program. Public Health Nutr. 2012; 15(1):82-7.
70. Marrocos Leite FH, Oliveira MA, Cremm EC, Costa de Abreu DS, Maron LR, Martins PA. Availability of processed foods in the perimeter of public schools in urban areas. J Pediatr. 2012; 88(4):328-34. 71. Mallarino C, Gómez LF, González-Zapata L, Cadena
Y, Parra DC. Advertising of ultra-processed foods and beverages: Children as a vulnerable population. Rev Saúde Pública. 2013; 47(5):1006-10. 72. Moubarac JC, Martins APB, Claro RM, Levy RB,
Cannon G, Monteiro CA. Consumption of ultra-processed foods and likely impact on human health: Evidence from Canada. Public Health Nutr. 2013; 16:2240-8.
73. Moodie R, Stuckler D, Monteiro C, Sheron N, Neal B, Thamarangsi T, et al. Profits and pandemics: Prevention of harmful effects of tobacco, alcohol, and ultra-processed food and drink industries. Lancet. 2013; 381(9867):670-9.