A Systematic Review of Studies Eliciting
Willingness-to-Pay per Quality-Adjusted Life
Year: Does It Justify CE Threshold?
Khachapon Nimdet1, Nathorn Chaiyakunapruk2,3,4,5*, Kittaya Vichansavakul1, Surachat Ngorsuraches1
1Faculty of Pharmaceutical Sciences, Prince Songkla University, Hatyai, Thailand,2School of Pharmacy, Monash University Malaysia, Selangor, Malaysia,3Center of Pharmaceutical Outcomes Research (CPOR), Department of Pharmacy Practice, Faculty of Pharmaceutical Sciences, Naresuan University, Phitsanulok, Thailand,4School of Pharmacy, University of Wisconsin, Madison, United States of America,5School of Population Health, University of Queensland, Brisbane, Australia
Abstract
Background
A number of studies have been conducted to estimate willingness to pay (WTP) per quality-adjusted life years (QALY) in patients or general population for various diseases. However, there has not been any systematic review summarizing the relationship between WTP per QALY and cost-effectiveness (CE) threshold based on World Health Organization (WHO) recommendation.
Objective
To systematically review willingness-to-pay per quality-adjusted-life-year (WTP per QALY) literature, to compare WTP per QALY with Cost-effectiveness (CE) threshold recom-mended by WHO, and to determine potential influencing factors.
Methods
We searched MEDLINE, EMBASE, Psyinfo, Cumulative Index to Nursing and Allied Health Literature (CINAHL), Center of Research Dissemination (CRD), and EconLit from inception through 15 July 2014. To be included, studies have to estimate WTP per QALY in health-re-lated issues using stated preference method. Two investigators independently reviewed each abstract, completed full-text reviews, and extracted information for included studies. We compared WTP per QALY to GDP per capita, analyzed, and summarized potential influencing factors.
Results
Out of 3,914 articles founded, 14 studies were included. Most studies (92.85%) used contin-gent valuation method, while only one study used discrete choice experiments. Sample size varied from 104 to 21,896 persons. The ratio between WTP per QALY and GDP per
OPEN ACCESS
Citation:Nimdet K, Chaiyakunapruk N, Vichansavakul K, Ngorsuraches S (2015) A Systematic Review of Studies Eliciting Willingness-to-Pay per Quality-Adjusted Life Year: Does It Justify CE Threshold?. PLoS ONE 10(4): e0122760.
doi:10.1371/journal.pone.0122760
Academic Editor:Cathy Mihalopoulos, Deakin University, AUSTRALIA
Published:April 9, 2015
Copyright:© 2015 Nimdet et al. This is an open access article distributed under the terms of the Creative Commons Attribution License, which permits unrestricted use, distribution, and reproduction in any medium, provided the original author and source are credited.
Data Availability Statement:All relevant data are within the paper.
Funding:The authors have no support or funding to report.
capita varied widely from 0.05 to 5.40, depending on scenario outcomes (e.g., whether it ex-tended/saved life or improved quality of life), severity of hypothetical scenarios, duration of scenario, and source of funding. The average ratio of WTP per QALY and GDP per capita for extending life or saving life (2.03) was significantly higher than the average for improving quality of life (0.59) with the mean difference of 1.43 (95% CI, 1.81 to 1.06).
Conclusion
This systematic review provides an overview summary of all studies estimating WTP per QALY studies. The variation of ratio of WTP per QALY and GDP per capita depended on several factors may prompt discussions on the CE threshold policy. Our research work pro-vides a foundation for defining future direction of decision criteria for an evidence-informed decision making system.
Introduction
It is widely known that using cost-effectiveness (CE) threshold as a cut-off for deciding whether an intervention is cost-effective is not uncommon [1]. Despite a controversy whether the threshold should be set, the CE threshold has been used implicitly or stated explicitly in various countries [2–6]. After a number of years of using health technology assessment (HTA) as part of decision makings, the CE thresholds in some countries, e.g. UK and Australia, become more apparent [5,7,8]. Several methods, such as expert opinion, human capital, WTP, and WHO recommendation, were used to estimate WTP per quality-adjusted life year (QALY) values [2,9–11]. However, how to derive appropriate cut-offs is still inconclusive.
Methods
Data sources and search strategy
Various databases including MEDLINE, EMBASE, Psyinfo, Center of Research Dissemination (CRD), Cumulative Index to Nursing and Allied Health Literature (CINAHL), and EconLit were systematically searched. They were searched from their inception until 15 July 2014. Med-ical Subject Headings (MeSH) and keywords used for the search included 1) (willingness to pay or contingent valuation or discrete choice experiment) AND (quality adjusted life year or QALY), OR 2) willingness to pay for (per) quality adjusted life year. There were no language restrictions.
Study selection and Data extraction
Studies were included if they met the following criteria: 1) an original article eliciting WTP per QALY, 2) using stated preference method, and 3) estimating WTP per QALY in health-related issues. Two investigators (K.N. and K.V.) independently reviewed each abstract, completed full-text reviews, and extracted information from each study for inclusion in study analysis. Data extracted from each study were year of publication, year of study, country, number of country per study, characteristics of hypothetical scenarios, number of scenarios per study, sample size, sampling method, mode of administration, interviewer, WTP elicitation method (WEM), number of WEM per study, utility elicitation method (UEM), number of UEM per study, types of respondents, respondents’income, and WTP per QALY values. Since many studies were conducted in a number of countries and/or scenarios, it was possible that more than one WTP per QALY value was obtained from each of them. [24]. During data extraction, the trimmed median of WTP per QALY value was preferred to median, and the trimmed mean was preferred to mean. Since cost-derived data are generally skewed, median is preferred. The trimmed analysis value was selected because the outliers were excluded from the analysis [30].
Data analysis
A descriptive analysis was conducted. All values were converted to US dollar units ($) in the year of study based on exchange rates from World Bank [31]. The WTP per QALY value was compared to GPD per capita, which was obtained from World Bank [32] for the year and country of study. As a result, the ratio of WTP per QALY value compared to GDP per capita was calculated. A number of factors were hypothesized to have affected the relationship be-tween WTP per QALY and GDP per capita [23–26]. They included outcomes, perspectives, se-verity of hypothetical scenarios, utility elicitation method, duration of scenario, type of respondent, type of country income, and funding sources [20,23–27]. These relationships were tested by independent sample t-tests or ANOVA. All analyses were performed using SPSS 18.0 for Windows, (Chicago, Ill).
Results
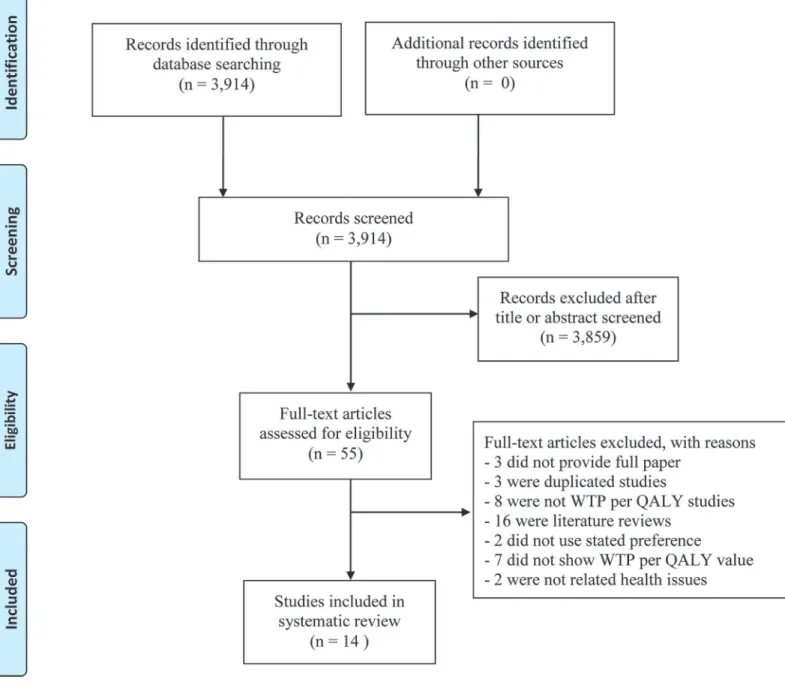
Study selection
QALY value (7), and they were not related to health issue (2). As a result, 14 articles were in-cluded into this review.
Study Characteristics
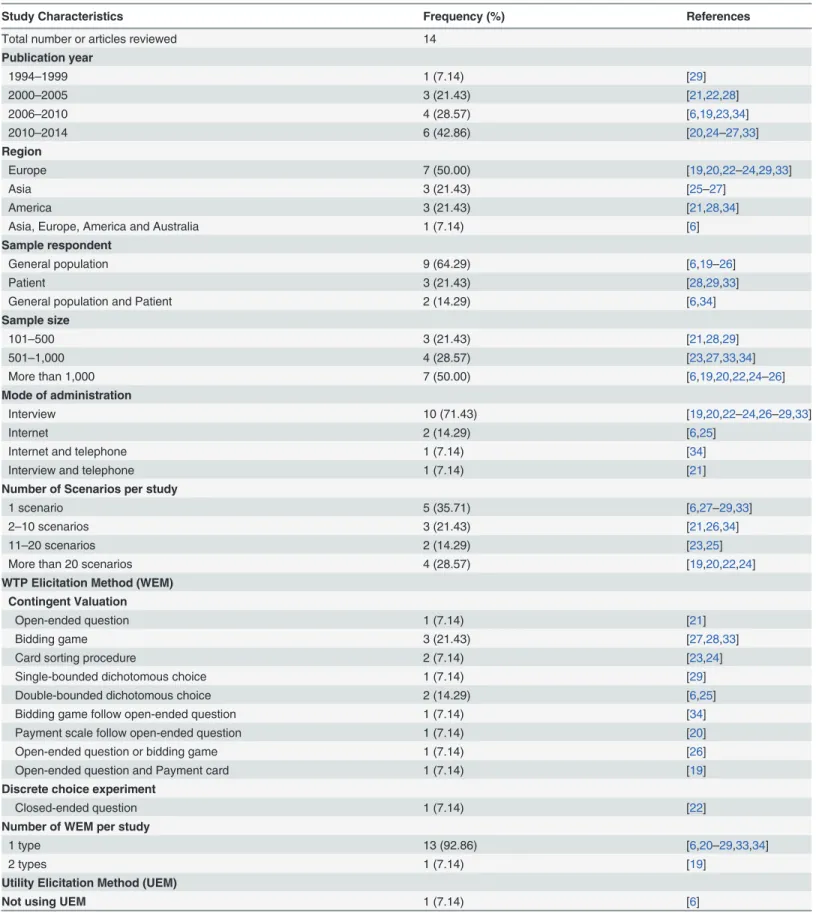
Table 1shows the study characteristics. The number of published WTP per QALY studies has grown rapidly over time; one study in 1995–1999, one study in 2000–2004, four studies in 2005–2009, and eight studies in 2010 to 2014. These studies were conducted in various geo-graphical regions e.g. Europe (7/14, 50.00%) [19,20,22–24,29,33], Asia (3/14, 21.43%) [25–27], and United states (3/14, 21.43%) [21,28,34]. In addition, one study was (7.14%) conducted Fig 1. Flow diagram of study selection.
Table 1. Methodology difference in WTP per QALY.
Study Characteristics Frequency (%) References
Total number or articles reviewed 14
Publication year
1994–1999 1 (7.14) [29]
2000–2005 3 (21.43) [21,22,28]
2006–2010 4 (28.57) [6,19,23,34]
2010–2014 6 (42.86) [20,24–27,33]
Region
Europe 7 (50.00) [19,20,22–24,29,33]
Asia 3 (21.43) [25–27]
America 3 (21.43) [21,28,34]
Asia, Europe, America and Australia 1 (7.14) [6]
Sample respondent
General population 9 (64.29) [6,19–26]
Patient 3 (21.43) [28,29,33]
General population and Patient 2 (14.29) [6,34]
Sample size
101–500 3 (21.43) [21,28,29]
501–1,000 4 (28.57) [23,27,33,34]
More than 1,000 7 (50.00) [6,19,20,22,24–26]
Mode of administration
Interview 10 (71.43) [19,20,22–24,26–29,33]
Internet 2 (14.29) [6,25]
Internet and telephone 1 (7.14) [34]
Interview and telephone 1 (7.14) [21]
Number of Scenarios per study
1 scenario 5 (35.71) [6,27–29,33]
2–10 scenarios 3 (21.43) [21,26,34]
11–20 scenarios 2 (14.29) [23,25]
More than 20 scenarios 4 (28.57) [19,20,22,24]
WTP Elicitation Method (WEM) Contingent Valuation
Open-ended question 1 (7.14) [21]
Bidding game 3 (21.43) [27,28,33]
Card sorting procedure 2 (7.14) [23,24]
Single-bounded dichotomous choice 1 (7.14) [29]
Double-bounded dichotomous choice 2 (14.29) [6,25]
Bidding game follow open-ended question 1 (7.14) [34]
Payment scale follow open-ended question 1 (7.14) [20]
Open-ended question or bidding game 1 (7.14) [26]
Open-ended question and Payment card 1 (7.14) [19]
Discrete choice experiment
Closed-ended question 1 (7.14) [22]
Number of WEM per study
1 type 13 (92.86) [6,20–29,33,34]
2 types 1 (7.14) [19]
Utility Elicitation Method (UEM)
Not using UEM 1 (7.14) [6]
across four regions including Europe, America, Asia, and Australia [6]. Totally, WTP per QALY studies were conducted in 16 countries and all of them were cross-sectional studies. Only two of 16 countries (18.75%) were low and middle income countries including China and Thailand [26,27].
Nine studies (64.28%) [6,19–26] were conducted in a general population, while three studies (21.43%) [27–29] were in patients. However, respondents of two studies (14.29%) [27,34] were from both general and patient populations. Among 11 studies including general populations, subjects were randomly sampled in only six studies (54.50%) [6,21–23,25,26]. Three studies used stratified random sampling based on race [21], age, gender [25], region, and income level [26].
The number of respondents varied from 104 to 21,896 persons. The sample size was less than 500 in three studies (21.43%) [21,28,29] and more than 1,000 in seven studies (50.00%) [6,19,20,22,24–26]. The reported mean of age ranged from 32.20 to 65.40 years old. The per-centage of females in most studies was 46.50–60.70%, while one study included only female pa-tients [29]. Household income was reported in most studies (7/14, 50.00%) [19,20,25–
27,29,33], while individual income were reported in only 14.28% of all studies [21,28]. The av-erage individual incomes in all studies were less than the countries’GDP per capita. Neverthe-less, five studies (35.71%) did not report both average household and individual incomes.
Health State Scenarios
Table 1shows the differences of methods used in reviewed studies. The number of scenarios varied from one to 27 per study; however, approximately 35% of all studies (5/14) used only one scenario [6,27–29,33]. Out of 14 studies, only three studies (21.43%) [21,26,34] provided a full description of specific disease with severity, and disease duration as a hypothetical scenario. For example, Byne et al. clearly specified that patients had knee osteoarthritis (OA) until the end of life, with three levels of severity (mild OA, severe OA, and current health state) [21]. Table 1. (Continued)
Study Characteristics Frequency (%) References
Direct Method
Time-trade off (TTO) 1 (7.14) [34]
Standard gamble (SG) 1 (7.14) [23]
SG or TTO 1 (7.14) [24]
TTO and VAS 1 (7.14) [26]
Rating scale and TTO 1 (7.14) [29]
TTO VAS and SG 2 (14.29) [21,28]
Indirect method
EQ-5D 3 (21.43) [20,22,25]
EQ-5D and SF-36 1 (7.13) [27]
Direct method and Indirect method
Rescaling VAS and EQ-5D 1 (7.14) [19]
VAS and EQ-5D 1 (7.14) [33]
Number of UEM per study
No 1 (7.14) [6]
1 type 5 (35.71) [20,22,23,25,34]
2 types 6 (42.89) [19,24,26,27,29,33]
3 types 2 (14.29) [21,28]
Lieu et al. used the scenarios of temporary herpes zoster with varying durations (one to 12 months) and pain intensity (pain scale of 0 to10) [34]. Thavorncharoensap et al. asked respon-dents to imagine being in hypothetical scenarios including paralysis, blindness, and allergy for five years with two levels of severity for each clinical condition [26].
The hypothetical scenarios varied across studies. They included viral infection [20], knee OA [21], chronic health state [22], herpes zoster [34], serious illness [6], paralysis [26], blind-ness [26], allergy [26], symptoms without hormone replacement therapy [29], prostatitis [27], and current health state of each respondent [21,27,28,33]. EQ-5D was used to describe varying severity levels of hypothetical scenarios in seven studies [19–25]. The duration of hypothetical scenarios varied from one month until death. The duration of hypothetical scenarios, specified in half of the included studies, was less than one year [6,19,20,24,27,33,34]. Three studies had several scenarios and specified each health state with varying duration [23,25,34].
Respondents were asked to state their willingness to pay for treatments that could either im-prove quality of life or extend life or save life. Most studies (12/14, 85.71%) asked respondents to value QALY in the perspective of improving quality of life [19–24,26–29,33,34], while only one study (7.14%) asked respondents for the value of extending life [6] and another study asked for all improving quality of life, extending life, and saving life [25]. In addition, only one study had respondents elicit WTP for disease prevention [26].
Most studies (12/14, 85.71%) asked respondents to elicit willingness to pay for themselves (individual perspective) [19,21–29,33,34]. Only one study estimated the value of WTP per QALY for the others in society (societal perspective) [20], while another study included both individual and societal perspectives and compared their values [6].
Mode of administration
The most common mode of administration was face-to-face interview (10/14, 71.43%) [19,20,22–24,26–29,33], followed by internet survey (2/14, 14.29%) [6,25], internet or tele-phone survey (1/14, 7.14%) [34], and face-to-face or teletele-phone interview (1/14, 7.14%) [21]. Some studies reported that interviewers were trained nurses [29] or trained researcher assis-tants [21,28,33].
Willingness to pay (WTP) elicitation methods
Utility elicitation methods
Time trade off (TTO) and standard gamble (SG) were used in six studies [21,24,26,28,29,34], and four studies [21,23,24,28], respectively, while EQ-5D were used in six studies
[19,20,22,25,27,33] and only one study [29] used SF-36. Six studies (42.85%) used two utility elicitation methods to estimate the utility of health state in scenario [19,24,26,27,29,33]. Only two studies (14.29%) used both direct and indirect preference based measures [19,33]. For in-stance, Bobinac et al. used rescaling VAS and EQ-5D [19], and Martin-Fernandez et al. used VAS and EQ-5D [33]. While five studies (35.71%) used only one utility elicitation method [20,22,23,25,34], two studies (14.29%) used three methods including TTO, VAS, and SG [21,28]. However, Shiroiwa et al. did not use any utility elicitation method because their scenar-ios were composed of only death state (utility = 0) and perfect health state (utility = 1) [6].
Comparisons between WTP per QALY and GDP per capita
All WTP per QALY values and their comparisons with GDP per capita of each study’s country are shown inTable 2. A total of 167 WTP per QALY values were obtained from the 14 studies. Based on varying scenarios, utility and WTP elicitation methods, and perspectives, these values varied extensively. Overall, these studies reported that WTP per QALY values fell between $2,019 [21] and $282,821 [20]. The mean (SD) and median of WTP per QALY values were $34,309 ($55,390), $9921, respectively. When WTP values were compared to GDP per capita of each country for specific study years, the ratios of WTP per QALY and the country’s GDP per capita ranged from 0.05 [21] to 5.40 [20]. The mean (SD) and median values of these ratios were 0.77 (0.89) and 0.43, respectively. Interestingly, among 167 observed values of WTP per QALY, more than three quarters of the number of these values (127/147, 86.39%) were below one GDP per capita for an additional QALY.
Associations between factors and the ratios of WTP per QALY and GDP
per capita
Table 3shows the results of the relationship between various factors and the ratio of WTP per QALY compared to GDP per capita. The average ratio of WTP per QALY and GDP per capita for extending life or saving life (2.03) was significantly higher than the average for improving quality of life (0.59) with the mean difference of 1.43 (95% CI, 1.81 to 1.06). It was also found that, on average, the estimates from a societal perspective (2.16) were clearly higher than those from an individual perspective (0.63) (p-value<0.01). A linear trend of the ratios of WTP per
QALY and GDP per capita was proportional to the increasing severity of conditions (p-value
<0.01). WTP per QALY and GDP per capita derived from indirect utility elicitation method
(1.45) was significantly higher than direct utility elicitation method (0.45) (p-value<0.01). The
ratio of WTP per QALY and GDP per capita from studies in LMIC (0.97) was insignificantly higher than that in non-LMIC (0.75) (p-value = 0.35).
Duration of scenario was significantly associated with the ratio between WTP per QALY and GDP per capita (p-value<0.01). The shorter duration (1 month to 1 year) scenario seemed
to have higher WTP per QALY (p-value<0.01). Interestingly, the studies funded by drug
com-panies reported that the ratio of WTP per QALY and GPD per capita (1.62) was higher than the ratio (0.80) in the other studies that were not funded by any drug company (p-value<
Table 2. WTP per QALY compared to GDP per Capita. Study Year of Study Hypothetical Scenario
Outcome No of
Scenarios No of WTP/ QALY
Country Respondent No of
Respondents WTP/ QALY ($) WTP/ QALY compared to GDP per capita (times) Contingent valuation
Zethraeus[29] 1995 HRT Improving QoL
1 2 Sweden Patient 104 120,000–
160,000
0.63–0.84
Byrne et al[21] 2001 Knee osteoarthritis¶
Improving QoL
3 9 US GP 193 2,019–
35,257
0.05–0.95
Current HS^^
Lieu et al[34] 2005 Herpes zoster Improving QoL
9 9 US Patient 474 26,000–
45,000
0.52–1.02
GP 478
Pinto-Prade et al[23] 2007 EQ-5D HS Improving QoL
13 13 Spain GP 560 11,999–
182,134
0.26–3.91
Thavornchareonsap et al[26]
2008 Allergy, Paralysis, and Blindness Improving QoL
12 12 Thailand GP 1,191 1,698–
17,283
0.20–2.06
Bobinac et al[19] 2008 EQ-5D HS Improving QoL
29 4 Netherland GP 1,091 13,360–
34,097
0.25–0.64
Shiroiwa et al[6] 2009 Serious illness
Extending life
4 3 Japan GP 1,114 44,000–
47,000
1.16–1.23
Serious illness
Extending life
4 3 ROK GP 1,000 79,000–
90,000
3.42–3.90
Serious illness
Extending life
4 3 Taiwan GP 504 70,000–
84,000
4.03–4.82
Serious illness
Extending life
4 3 UK GP 1,002 39,000–
61,000
0.81–1.28
Serious illness
Extending life
4 3 Australia GP 1,000 50,000–
68,000
1.22–1.66
Serious illness
Extending life
4 3 US GP 1,000 56,000–
66,000
1.16–1.36
Shiroiwa et al [25] 2009 EQ-5D HS Improving QoL
12 12 Japan GP 2,400 24,375–
121,876
0.53–2.64
Dead state Extending life
2 2 Japan GP 2,400 70,567–
71,913
1.52–1.56
Dead state Saving life 2 2 Japan GP 2,400 37,797–
72,317
0.82–1.56
Zhao et al [27] 2009 Current HS€ Improving
QoL
1 2 China GP 364 4,711–
5,012
0.72–0.77
Current HS Imoroving QoL
1 2 China Patient 286 7,408–
7,306
1.12–1.13
Bobinac et al[20] 2010 Viral illness Improving QoL
29 2 Netherland GP 1,004 159,810–
252,408
3.42–5.40
King et al[28] Current HS^ Improving QoL
1 3 US Patient 391 12,500–
32,200
0.32–0.81
Robinson et [24] 2010 EQ-5D HS Improving QoL
27 8 Netherland GP 2,510 3,412–
7,904
0.07–0.17
EQ-5D HS Improving QoL
27 8 UK GP 2,312 6,775–
3,256
0.09–0.18
EQ-5D HS Improving QoL
27 8 France GP 2,674 3,256–
6,775
0.08–0.18
Discussions
To our best of knowledge, this is the first study systematically reviewing literatures on WTP per QALY that determined whether evidences justified the CE threshold recommended by WHO. The review provided the summary of methods that could be used for future improve-ment in this kind of study. In addition, it shed light on the relationship between WTP per QALY and GDP per capita. The comparison between results from research on WTP per QALY and CE threshold would be valuable to policy makers because they could use this evidence to support direction of future decisions. Even though this study did not reveal how WTP per QALY differed from the current thresholds used in their jurisdictions, policy makers could refer these numbers with their‘implicit’thresholds eventually.
There has been an increasing trend in the number of studies for WTP per QALY in the last decade. However, only 14 studies were included. The main reasons were that several studies were literature reviews [9,15,35–39] or did not report WTP per QALY values [40–46] or were not related to health issues [47,48]. Half of reviewed studies were conducted in European coun-tries. A reason could be that many countries there adopted HTA for decision making and they have had a strong network, e.g. EUnetHTA, to conduct this type of study. In terms of methods Table 2. (Continued)
Study Year
of Study
Hypothetical Scenario
Outcome No of
Scenarios No of WTP/ QALY
Country Respondent No of
Respondents WTP/ QALY ($) WTP/ QALY compared to GDP per capita (times)
EQ-5D HS Improving QoL
27 8 Spain GP 2,697 6,671–
12,669
0.22–0.43
EQ-5D HS Improving QoL
27 8 Sweden GP 2,604 3,235–
7,842
0.07–0.16
EQ-5D HS Improving QoL
27 8 Norway GP 2,020 7,659–
15,472
0.09–0.18
EQ-5D HS Improving QoL
27 8 Denmark GP 2,637 5,749–
15,409
0.10–0.27
EQ-5D HS Improving QoL
27 8 Poland GP 2,173 3,611–
10,744
0.29–0.87
EQ-5D HS Improving QoL
27 8 Hungary GP 2,287 3,611–
10,748
0.24–0.60
Martin-Fernandez [33]
2011 Current HS Improving QoL
1 2 US Patient 757 10,119–
10,305
0.42–0.43
Discrete choice experiment
Gryd-Hasen[22] 2001 Chronic HS* Improving QoL
23 1 Denmark GP 3,201 10,972 0.37
Abbreviations: GDP, gross domestic product; No, number; HRT, hormone replacement therapy; HS, health state, No, number; GP, general population; QoL, quality of life;UK, united Kingdom;
ROK, Republic of Korea; US, United states; ¶ mild or severe osteoarthritis;
*EQ-5D described severity;
^CSM,general medical clinic,cerebral aneurysms; ^^Knee osteoarthritis;
€chronic prostatitis
used in these studies, this review shed light on various parts of study design, including samples, method of administration, scenarios, etc. For study samples, most studies used general popula-tion. Those researchers might perceive that health care as a public goods and believed that fo-cusing on individual patients or diseases would not reflect the complete picture of society. This is not meant to say that WTP per QALY for particular diseases were not useful since in fact it could be used for other purposes. For instance, it could be used for bridging cost-effectiveness/ cost-utility analysis with cost-benefit analysis, which has stronger theoretical ground, in partic-ular diseases [16,49]. In other words, selected samples should depend on study objectives or Table 3. Exploration of the relationship between numerous factors associated with the ratio of WTP per QALY compared to GDP per capita.
Factors Mean of WTP per QALY compared to GDP per capita + SD
(times)
Mean difference (times) (95% CI)
P value
Scenario characteristic Outcomes of all counties
Improving quality of life (n = 145) 0.59 + 0.74 §
Extending life and Saving Life (n = 22) 2.03 + 0.98 -1.43 (-1.81 to -1.06) <0.01
Perspective
Individual perspective (n = 153) 0.63 + 0.73 §
Societal perspective (n = 12) 2.16 + 1.41 -1.53 (-2.00 to -1.06) <0.01
Severity of hypothetical scenario
Mild severity (utility>0.70) (n = 63) 0.37 + 0.35 §
Moderate severity (utility 0.35–0.70) (n = 68)
0.70 + 0.91 -0.32 (-0.61 to -0.03) 0.03
High Severity (utility<0.35) (n = 36) 1.65 + 1.22 -1.28 (-1.62 to -0.93) <0.01
Utility elicitation method
Direct method (n = 124) 0.45 + 0.53 §
Indirect method (n = 25) 1.45 + 1.05 -1.00 (-1.28 to -0.72) <0.01
Duration of scenario
1 month to 1 year (n = 20) 1.30 + 0.58 §
More than 1 year (n = 147) 0.71 + 0.98 0.59 (0.15 to 1.02) 0.01
Respondent characteristic Type of respondent
Public (n = 140) 0.82 + 1.03 §
Patient (n = 9) 0.70 + 0.30 0.12 (-0.53 to 0.77) 0.72*
Public and Patient (n = 18) 0.51 + 0.40 0.31 (-0.17 to 0.78) 0.96*
Other factors
Type of country income
Low and middle income countries (n = 16) 0.97 + 0.51 §
Non-low and middle income countries (n = 151)
0.75 + 0.92 0.35 (-0.24 to 0.68) 0.35*
Funding
Non drug company support (n = 42) 0.80 + 0.73 §
Drug company support (n = 36) 1.62 + 1.39 -0.82 (-1.31 to -0.33) 0.01
Sample size
Increment of 1,000 subjects -0.30 (-0.43 to -0.17) <0.01
Abbreviations: GDP, gross domestic product; SD, standard deviation; CI, confidence interval; n, number of study *no statistical significance
§ Comparator
applications. However, when these WTP per QALY values were compared with GDP per cap-ita, their ratios were not significantly different. Certainly, it could not be generalized but it pro-vided less concern for future use of research results from different types of samples. The results showed that these samples were asked to use either individual or societal perspectives when they responded to the questions. Most studies asked them to use their own perspectives since it might be easier for them to imagine from given scenarios and their responses should be more valid. The ratio between WTP per QALY and GDP per capita from two different perspectives were significantly different. This systematic review did not intend to determine which perspec-tive would be better than another, but it suggested that perspecperspec-tive used in the study affected WTP per QALY values.
Our findings provided scientific evidences for the controversy of the use of a fixed CE threshold versus flexible CE thresholds [7,18,25]. For example, US used a fixed CE threshold at $US 50,000 [2], while the Netherlands applied different CE thresholds for interventions that aimed for life threatening conditions and for other conditions [50,51]. The ratios between WTP per QALY and GDP per capita varied substantially especially those for extending life or saving life and improving quality of life and the ratios were higher among those scenarios with severe conditions compared to mild conditions. These implied that perhaps a fixed CE thresh-old might not be appropriate or one CE threshthresh-old might not fit all circumstances. In addition, the results showed that the ratios between WTP per QALY and GDP per capita were 0.59 and 2.03 for improving quality of life and extending life or saving life, respectively. It is also impor-tant to note that all evidences on this difference were driven by studies conducted in non-LMIC since there was no study conducted in non-LMIC to determine WTP per QALY for extend-ing life or savextend-ing life and improvextend-ing quality of life. This is suggestive of the need for such a study to look at this aspect in LMIC. Currently, the interest in using different CE thresholds has been adopted in some countries [50,51].
The review showed the WTP elicitation method primarily was contingent valuation (CV). However, CV itself was composed of several types of methods. Among them, the bidding game was used slightly more frequently than others. One reason could be that the bidding game was similar to or based on the concept of standard gamble, which has been well known among health economists. However, CV methods have been criticized for various weaknesses [52]. For instance, respondents were asked to consider whole health states or scenarios in CV and decide how much they would like to pay. In reality, they might consider these health states or scenarios based on only some important attributes that were important to them. Among the re-viewed studies, only one selected study used discrete choice experiments (DCE). A potential reason was that DCE might have just been introduced to the field of health economics [53–55]. However, DCE is based on a rigorous theory, random utility theory, which has recently been proven to measure utility well. Potentially, DCE could be used more for future research of WTP per QALY.
Direct methods, e.g. SG, TTO, VAS, or their combinations, were used more frequently. Only four studies used indirect methods, e.g. EQ-5D and SF-36. There were at least two possi-ble explanations. First, using indirect method required scale tariffs, which might not be avail-able in those countries. In addition, when these indirect methods were used, they needed to be validated with study samples. Therefore, using an indirect method in this case might not be ef-ficient or convenient, as an exchange for the validity of utility measurement. On the other hand, using direct methods would not only provide studies strong theoretical ground but also allow the study results to relate to other studies’results.
means intended to reflect bias. Instead, it should be noted that the source of funding could have an impact on WTP per QALY, as compared to GDP per capita. In addition, the significant negative association of sample size and WTP per QALY compared to GDP per capita were worth noting. The higher ratios between WTP per QALY and GDP per capita in the small sam-ple size might be due to the small study effect [56], which is a phenomenon of higher value of results among studies with smaller sample size. Subjects included in small studies might be se-lected in a way that is prone to give the higher value results.
There were several factors influencing with WTP per QALY values including severity of hy-pothetical scenario, outcomes, and duration of scenario. Therefore, we recommended these factors should be presented and clearly explained to respondents in future stated
preference studies.
This review included only stated preference studies. Stated preference method is useful since it can derive WTP per QALY values for a number of specific scenarios. However, subjects may face difficulty imagining for scenarios. It could be challenging to have imagination without a full description of all relevant components of scenarios including hypothetical scenarios, se-verity, scenario outcomes, and duration. However, having specified a wide range of scenario, studies using stated preferences method could be derived to inform decision making on varying conditions in scenarios. This is contradictory to the use of the revealed preference method in which WTP per QALY can be derived from certain conditions or situations, providing fewer insights for supporting informed decision making.
Some researchers argued that the WTP per QALY estimated from stated preference method might not be relevant for policy making [16,49,57]. However, another researcher argued that countries needed to use a robust and simple method to look for WTP threshold for a QALY since it could be used to inform the political debate for the allocation of health care resources [6,18–28,33,34,37,58,59]. A number of countries have estimated WTP per QALY using stated preference for support policy decision making [6,24].
Finally, there has been a debate on the usefulness and limitation of the use of WTP per QALY for policy decision making [9,49,57,59]. An important issue is the elicitation of prefer-ence based on whose perspective. There were two studies estimating WTP per QALY values from societal perspective [6,20], while most studies focused on individual’s perspective. The issue of equity arose further among studies using individual perspective as the WTP values might be affected by individuals’income. Therefore, WTP per QALY values derived from indi-viduals might cause distributional issue problem especially for low income person or unem-ployed person. Even though the elicitation of preference from individuals was consistent with welfare economic theory, the individual’s valuation based on social perspective could provide information relevant for decision making under healthcare system [6,20,49,60].
A number of limitations should be acknowledged in this study. First, this study used the WHO recommendation as a reference CE threshold of each country since it was not feasible to identify their explicit CE. However, the WHO recommendation is recognized as the best avail-able benchmark. Second, some studies used a number of scenarios and provided more than one WTP per QALY value, the average value might be weighted towards values from such studies more than those studies providing only one WTP per QALY value. Third, interaction effect of all factors was not controlled because of small sample size. It is noteworthy that mean difference may change if they had interaction.
Conclusions
conducted provides a good foundation for defining good practice for this kind of study. The variation of ratio of WTP per QALY and GDP per capita depended on several factors may prompt discussions on the CE threshold policy. Our findings provides pivotal evidence to en-able policy makers to discuss and initiate conversations among themselves and stakeholders on how decisions can be made and what criteria decisions should be based on, so that the im-proved overall population health can be achieved through an evidence-informed health care decision making system.
Supporting Information
S1 PRISMA Checklist. PRISMA Checklist.
(DOC)
Acknowledgments
We would like to thank Professor Gary M. Oderda from College of Pharmacy, University of Utah, for his reviewing and editing the manuscript.
Author Contributions
Conceived and designed the experiments: NC KV. Performed the experiments: KN KV. Ana-lyzed the data: KN NC. Contributed reagents/materials/analysis tools: KN NC KV. Wrote the paper: KN NC KV SN.
References
1. Gold MR, Siegel JE, Russell LB, Weinstein MC (1996) Cost-effectiveness in Health and Medicine. New York: Oxford University Press.
2. Grosse SD (2008) Assessing cost-effectiveness in healthcare: history of the $50,000 per QALY thresh-old. Expert Rev Pharmacoecon Outcomes Res 8: 165–178. doi:10.1586/14737167.8.2.165PMID: 20528406
3. Neumann PJ, Sandberg EA, Bell CM, Stone PW, Chapman RH (2000) Are pharmaceuticals cost-effec-tive? A review of the evidence. Health Aff (Millwood) 19: 92–109. PMID:10718025
4. McCabe C, Claxton K, Culyer AJ (2008) The NICE cost-effectiveness threshold: what it is and what that means. Pharmacoeconomics 26: 733–744. PMID:18767894
5. Appleby J, Devlin N, Parkin D (2007) NICE's cost effectiveness threshold. BMJ 335: 358–359. PMID: 17717337
6. Shiroiwa T, Sung YK, Fukuda T, Lang HC, Bae SC, Tsutani K (2010) International survey on willing-ness-to-pay (WTP) for one additional QALY gained: what is the threshold of cost effectiveness? Health Econ 19: 422–437. doi:10.1002/hec.1481PMID:19382128
7. Institute for Health and Clinical Excellence (2013) Guide to the methods of technology appraisal 2013. Available:http://www.nice.org.uk/article/PMG9/chapter/Foreword. Accessed 2014 August 12.
8. George B, Harris A, Mitchell A (2001) Cost-effectiveness analysis and the consistency of decision mak-ing: evidence from pharmaceutical reimbursement in australia (1991 to 1996). Pharmacoeconomics 19: 1103–1109. PMID:11735677
9. Hirth RA, Chernew ME, Miller E, Fendrick AM, Weissert WG (2000) Willingness to pay for a quality-ad-justed life year: in search of a standard. Med Decis Making 20: 332–342. PMID:10929856
10. World Health Organization. Choosing interventions that are cost effective. Available:http://www.who. int/choice/costs/CER_levels/en/. Accessed 2014 Dec 8.
11. World Health Organization. Macroeconomics and Health: investing in health for economic develop-ment. Geneva, Switzerland: World Health Organization: Report of the WHO Commission on Macro-economics and Health 2001
13. Eichler HG, Kong SX, Gerth WC, Mavros P, Jonsson B (2004) Use of cost-effectiveness analysis in health-care resource allocation decision-making: how are cost-effectiveness thresholds expected to emerge? Value Health 7: 518–528. PMID:15367247
14. Shillcutt SD, Walker DG, Goodman CA, Mills AJ (2009) Cost effectiveness in low- and middle-income countries: a review of the debates surrounding decision rules. Pharmacoeconomics 27: 903–917. doi: 10.2165/10899580-000000000-00000PMID:19888791
15. Johannesson M, Meltzer D (1998) Some reflections on cost-effectiveness analysis. Health Econ 7: 1–
7. PMID:9541079
16. Dolan P, Edlin R (2002) Is it really possible to build a bridge between cost-benefit analysis and cost-ef-fectiveness analysis? J Health Econ 21: 827–843. PMID:12349884
17. Gyrd-Hansen D, Kjaer T (2012) Disentangling WTP per QALY data: different analytical approaches, dif-ferent answers. Health Econ 21: 222–237. doi:10.1002/hec.1709PMID:21254305
18. Mason H, Baker R, Donaldson C (2008) Willingness to pay for a QALY: past, present and future. Expert Rev Pharmacoecon Outcomes Res 8: 575–582. doi:10.1586/14737167.8.6.575PMID:20528368
19. Bobinac A, Van Exel NJ, Rutten FF, Brouwer WB (2010) Willingness to pay for a quality-adjusted life-year: the individual perspective. Value Health 13: 1046–1055. doi:10.1111/j.1524-4733.2010.00781.x PMID:20825620
20. Bobinac A, Van Exel NJA, Rutten FFH, Brouwer WBF (2013) Valuing qaly gains by applying a societal perspective. Health Economics (United Kingdom) 22: 1272–1281.
21. Byrne MM, O'Malley K, Suarez-Almazor ME (2005) Willingness to pay per quality-adjusted life year in a study of knee osteoarthritis. Med Decis Making 25: 655–666. PMID:16282216
22. Gyrd-Hansen D (2003) Willingness to pay for a QALY. Health Econ 12: 1049–1060. PMID:14673813
23. Pinto-Prades JL, Loomes G, Brey R (2009) Trying to estimate a monetary value for the ALY. J Health Econ 28: 553–562. doi:10.1016/j.jhealeco.2009.02.003PMID:19327857
24. Robinson A, Gyrd-Hansen D, Bacon P, Baker R, Pennington M, Donaldson C, et al. (2013) Estimating a WTP-based value of a QALY: the 'chained' approach. Soc Sci Med 92: 92–104. doi:10.1016/j.
socscimed.2013.05.013PMID:23849283
25. Shiroiwa T, Igarashi A, Fukuda T, Ikeda S (2013) WTP for a QALY and health states: More money for severer health states? Cost Eff Resour Alloc 11: 22. doi:10.1186/1478-7547-11-22PMID:24128004
26. Thavorncharoensap M, Teerawattananon Y, Natanant S, Kulpeng W, Yothasamut J, Werayingyong P (2013) Estimating the willingness to pay for a quality-adjusted life year in Thailand: does the context of health gain matter? Clinicoecon Outcomes Res 5: 29–36. doi:10.2147/CEOR.S38062PMID:
23345984
27. Zhao FL, Yue M, Yang H, Wang T, Wu JH, Li SC (2010) Willingness to pay per quality adjusted life-year: Is one threshold applicable for all decision-making? Value in Health 13: A538.
28. King JT Jr, Tsevat J, Lave JR, Roberts MS (2005) Willingness to pay for a quality-adjusted life year: Im-plications for societal health care resource allocation. Medical Decision Making 25: 667–677. PMID: 16282217
29. Zethraeus N (1998) Willingness to pay for hormone replacement therapy. Health Econ 7: 31–38. PMID:9541082
30. Oosterhoff J (1994) Trimmed mean or sample median? Statistics & Probability Letters 20: 401–409.
31. The World Bank. Official exchange rate (LCU per US$, period average). Available:http://data. worldbank.org/indicator/PA.NUS.FCRF. Accessed 2014 Jul 20.
32. The World Bank. GDP per capita (current US$). Available:http://data.worldbank.org/indicator/NY. GDP.PCAP.CD. Accessed 2014 Jul 20.
33. Martin-Fernandez J, Polentinos-Castro E, del Cura-Gonzalez MI, Ariza-Cardiel G, Abraira V, Gil-Perez S, et al. (2014) Willingness to pay for a quality-adjusted life year: an evaluation of attitudes towards risk and preferences. BMC Health Serv Res 14: 287. doi:10.1186/1472-6963-14-287PMID:24989615
34. Lieu TA, Ray GT, Ortega-Sanchez IR, Kleinman K, Rusinak D, Rusinak D, et al. (2009) Willingness to pay for a QALY based on community member and patient preferences for temporary health states as-sociated with herpes zoster. Pharmacoeconomics 27: 1005–1016. doi: 10.2165/11314000-000000000-00000PMID:19908925
35. Johnson FR (2005) Einstein on willingness to pay per QALY: is there a better way? Med Decis Making 25: 607–608. PMID:16282210
36. Weinstein MC (2008) How much are Americans willing to pay for a quality-adjusted life year? Med Care 46: 343–345. doi:10.1097/MLR.0b013e31816a7144PMID:18362811
38. Hammit JK (2002) QALYs versus WTP. Risk Anal 22: 985–1001. PMID:12442993
39. Baker R, Chilton S, Donaldson C, Jones-Lee M, Lancsar E, Manson H, et al. (2011) Searchers vs sur-veyors in estimating the monetary value of a QALY: resolving a nasty dilemma for NICE. Health Econ Policy Law 6: 435–447. doi:10.1017/S1744133111000181PMID:21854688
40. Bala MV, Wood LL, Zarkin GA, Norton EC, Gafni A, O'Brien B (1998) Valuing outcomes in health care: a comparison of willingness to pay and quality-adjusted life-years. J Clin Epidemiol 51: 667–676. PMID:9743315
41. Franic DM, Pathak DS, Gafni A (2005) Quality-adjusted life years was a poor predictor of women's will-ingness to pay in acute and chronic conditions: results of a survey. J Clin Epidemiol 58: 291–303. PMID:15718119
42. Franic DM, Bothe AK, Bramlett RE (2012) A welfare economic approach to measure outcomes in stut-tering: comparing willingness to pay and quality adjusted life years. J Fluency Disord 37: 300–313. doi: 10.1016/j.jfludis.2012.04.005PMID:23218213
43. Lundberg L, Johannesson M, Silverdahl M, Hermansson C, Lindberg M (1999) Quality of life, health-state utilities and willingness to pay in patients with psoriasis and atopic eczema. Br J Dermatol 141: 1067–1075. PMID:10606854
44. Pinto-Prades JL, Sanchez-Martinez FI, Corbacho B, Baker R (2014) Valuing QALYs at the end of life. Soc Sci Med 113: 5–14. doi:10.1016/j.socscimed.2014.04.039PMID:24820408
45. Richardson J, Iezzi A, Sinha K, Khan MA, McKie J (2014) An instrument for measuring the social will-ingness to pay for health state improvement. Health Econ 23: 792–805. doi:10.1002/hec.2950PMID: 23824989
46. Blumenschein K, Johannesson M (1998) Relationship between quality of life instruments, health state utilities, and willingness to pay in patients with asthma. Ann Allergy Asthma Immunol 80: 189–194. PMID:9494453
47. Haninger K, Hammitt JK (2011) Diminishing willingness to pay per quality-adjusted life year: valuing acute foodborne illness. Risk Anal 31: 1363–1380. doi:10.1111/j.1539-6924.2011.01617.xPMID: 21488924
48. Tolbert DV, McCollister KE, LeBlanc WG, Lee DJ, Fleming LE, Muennig P (2014) The economic burden of disease by industry: Differences in quality-adjusted life years and associated costs. Am J Ind Med 57: 757–763. doi:10.1002/ajim.22322PMID:24954889
49. Gafni A (2006) Economic Evaluation of Health-care Programmes: Is CEA Better than CBA? Environ-mental & Resource Economics 34: 407–418.
50. Boersma C, Broere A, Postma MJ (2010) Quantification of the potential impact of cost-effectiveness thresholds on dutch drug expenditures using retrospective analysis. Value Health 13: 853–856. doi: 10.1111/j.1524-4733.2010.00736.xPMID:21054659
51. Nuijten MJ, Dubois DJ (2011) Cost-utility analysis: current methodological issues and future perspec-tives. Front Pharmacol 2: 29. doi:10.3389/fphar.2011.00029PMID:21713127
52. Bateman IJ, Carson RT, Day B, Hanemann M, Hanley N, Hett T, et al. 2002. Economic valuation with stated preference techniques. Edward Elgar: Cheltenham.
53. Lancsar E, Louviere J (2008) Conducting discrete choice experiments to inform healthcare decision making: a user's guide. Pharmacoeconomics 26: 661–677. PMID:18620460
54. Mangham LJ, Hanson K, McPake B (2009) How to do (or not to do). . .Designing a discrete choice ex-periment for application in a low-income country. Health Policy Plan 24: 151–158. doi:10.1093/heapol/ czn047PMID:19112071
55. Louviere JJ, Flynn TN, Carson RT (2010) Discrete Choice Experiments Are Not Conjoint Analysis. Journal of Choice Modelling 3: 57–72.
56. Higgins JPT, Green S (editors). Cochrane Handbook for Systematic Reviews of Interventions Version 5.1.0 [updated March 2011]. The Cochrane Collaboration, 2011. Available:www.cochrane-handbook. org. Accessed 2015 Jan 15
57. Donaldson C (1999) Valuing the benefits of publicly-provided health care: does 'ability to pay' preclude the use of 'willingness to pay'? Soc Sci Med 49: 551–563. PMID:10414814
58. Bridges JF (2003) Stated preference methods in health care evaluation: an emerging methodological paradigm in health economics. Appl Health Econ Health Policy 2: 213–224. PMID:15119540 59. Gryd-Hasen (2007) Looking for willingness to pay (WTP) threshold for a QALY—does it make sense?
A critical view. ISPOR Connection 13: 5–8.
60. Hutton J (1992) Cost-benefit analysis in health care expenditure decision-making. Health Econ 1: 213–
![Table 1 shows the differences of methods used in reviewed studies. The number of scenarios varied from one to 27 per study; however, approximately 35% of all studies (5/14) used only one scenario [6,27–29,33]](https://thumb-eu.123doks.com/thumbv2/123dok_br/18457530.364792/6.918.56.869.138.505/differences-methods-reviewed-studies-scenarios-approximately-studies-scenario.webp)


