A High-Resolution Map of Synteny Disruptions
in Gibbon and Human Genomes
Lucia Carbone1[*, Gery M. Vessere1[, Boudewijn F.H. ten Hallers1, Baoli Zhu1, Kazutoyo Osoegawa1, Alan Mootnick2, Andrea Kofler3, Johannes Wienberg4, Jane Rogers5, Sean Humphray5, Carol Scott5, R. Alan Harris6,
Aleksandar Milosavljevic6, Pieter J. de Jong1
1BACPAC Resources, Children’s Hospital of Oakland Research Institute, Oakland, California, United States of America,2Gibbon Conservation Center, Santa Clarita, California, United States of America,3Chrombios GmbH, Raubling, Germany,4Anthropology and Human Genetics, Department of Biology II, Munich University, Munich, Germany, 5Wellcome Trust Sanger Institute, Wellcome Trust Genome Campus, Cambridge, United Kingdom,6Department of Molecular and Human Genetics, Baylor College of Medicine, Houston, Texas, United States of America
Gibbons are part of the same superfamily (Hominoidea) as humans and great apes, but their karyotype has diverged faster from the common hominoid ancestor. At least 24 major chromosome rearrangements are required to convert the presumed ancestral karyotype of gibbons into that of the hominoid ancestor. Up to 28 additional rearrangements distinguish the various living species from the common gibbon ancestor. Using the northern white-cheeked gibbon (2n
¼52) (Nomascus leucogenys leucogenys) as a model, we created a high-resolution map of the homologous regions
between the gibbon and human. The positions of 100 synteny breakpoints relative to the assembled human genome were determined at a resolution of about 200 kb. Interestingly, 46% of the gibbon–human synteny breakpoints occur in regions that correspond to segmental duplications in the human lineage, indicating a common source of plasticity leading to a different outcome in the two species. Additionally, the full sequences of 11 gibbon BACs spanning evolutionary breakpoints reveal either segmental duplications or interspersed repeats at the exact breakpoint locations. No specific sequence element appears to be common among independent rearrangements. We speculate that the extraordinarily high level of rearrangements seen in gibbons may be due to factors that increase the incidence of chromosome breakage or fixation of the derivative chromosomes in a homozygous state.
Citation: Carbone L, Vessere GM, ten Hallers BFH, Zhu B, Osoegawa K, et al. (2006) A high-resolution map of synteny disruptions in gibbon and human genomes. PLoS Genet 2(12): e223. doi:10.1371/journal.pgen.0020223
Introduction
During recent years, great progress has been made in understanding the evolutionary processes governing mam-malian chromosomal organization. It is now commonly accepted that the mammalian karyotype has undergone a limited number of major rearrangements over the course of more than 100 million years [1]. A few species represent an exception to the rule by demonstrating a very high incidence of karyotypic changes. Mouse, rat, and dog are often cited as examples of exceptionally rearranged chromosomes com-pared to the putative ancestral mammalian karyotype [2–5] The small apes or gibbons (Hylobatidae) exhibit heavily reshuffled chromosomes relative to most other members of the primate order and, most significantly, relative to other members of the superfamily Hominoidea: the great apes and humans. Humans and great apes have a karyotype more similar to the ancestral mammalian karyotype, suggesting that the chromosomal instability evolved in the ancestor of the small apes. The high rate of karyotype rearrangement persisted from the common gibbon ancestor to the current species as indicated by the four karyomorphs that define the four gibbon genera:Symphalangus(siamang) 2n¼50,Nomascus (crested gibbon) 2n¼52,Hylobates(Hylobates group) 2n¼44, andHoolock(hoolock gibbon) 2n¼38 [6–8]. The evolutionary mechanisms that generated this karyotype diversity may have terminated or may still be in action today.
Recent studies describing the dynamics of mammalian genome evolution indicate a‘‘reuse’’of genomic regions for independent evolutionary breakpoints in different lineages as
well as the presence of hotspots and fragile sites more prone to rearrangements. These fragile loci frequently coincide with regions enriched for segmental duplications (SDs) in primates and involved in human genomic disorders [9–17]. Moreover, it is well known that transposable elements are responsible for chromosomal instability inDrosophila[18,19] and endog-enous retroviruses are involved in genome shuffling in mammals [15,20,21].
Gibbon karyotypic changes have previously been inves-tigated by cytogenetic banding analysis [6,22–24] and more recently by comparative chromosome painting [7,8,25–29] and reciprocal chromosome painting techniques [30,31]. The maps resulting from these experiments are limited by the
Editor:Barbara J. Trask, Fred Hutchinson Cancer Research Center, United States of America
ReceivedAugust 28, 2006;AcceptedNovember 13, 2006;PublishedDecember 29, 2006
A previous version of this article appeared as an Early Online Release on November 13, 2006 (doi:10.1371/journal.pgen.0020223.eor).
Copyright:Ó2006 Carbone et al. This is an open-access article distributed under the terms of the Creative Commons Attribution License, which permits unrestricted use, distribution, and reproduction in any medium, provided the original author and source are credited.
Abbreviations: BAC, bacterial artificial chromosome; BES, BAC end sequence; BOSR, break of synteny region; DOP PCR, degenerate oligonucleotide-primed PCR; FISH, fluorescence in situ hybridization; HLA,H. lar; HSA,Homo sapiens; indel, insertion/deletion; NLE,Nomascus leucogenys leucogenys; SD, segmental duplication
* To whom correspondence should be addressed. E-mail: [email protected]
resolution of fluorescence microscopy (about 3–5 Mb). As a result, it is difficult to correlate gibbon rearrangements detected by these methods with smaller scale genomic sequence features. A more detailed analysis of breakpoint regions may determine if the rearrangements are caused by gibbon-specific genomic sequence features. Alternatively, the breakpoints may coincide with sequence features found at rearrangement sites in other mammals, including human. To decide between these two alternatives, it is necessary to first map the numerous gibbon chromosome breakpoints at high resolution based on DNA sequence alignments and then to sequence the new junctions.
Here, we compared the karyotypes of Nomascus leucogenys leucogenys(NLE) (northern white-cheeked gibbon) and human using a combination of high-resolution genomic technolo-gies: array comparative genome hybridization painting [32,33], bacterial artificial chromosome (BAC) end-sequence profiling [33], and confirmation by fluorescence in situ hybridization (FISH). Our approach made optimal use of BAC libraries from the human and gibbon genomes to create a map of 100 gibbon breakpoints relative to the human genome at a resolution of approximately 200 kb, the size of a typical BAC clone. We isolated 67 gibbon BAC clones spanning breakpoints with the intent of looking at the species-specific sequences in these regions. The full sequences of a subset of these clones provide insight into the architecture of rearranged chromosomal regions at the molecular level.
Results/Discussion
Overview of the Genomic Tools Used in the Experiments The three main resources used in this study were 1) high-resolution microarray slides containing about 32,000 BAC clones spanning the entire human genome (‘‘32K set’’), 2) a genomic BAC library for the northern white-cheeked gibbon (CHORI-271) described in more detail at http://bacpac.chori. org/library.php?id¼228, and 3) the latest genome assemblies of rhesus macaque (UCSC build rheMac2) and chimpanzee
(UCSC build panTro1) used as outgroups to resolve rear-rangements to the great ape or small ape lineage.
To better understand karyotype instability, gibbon-specific sequences at the break of synteny regions (BOSRs) need to be analyzed. To determine if it is possible to attribute break-points to specific sequence elements or to the genomic architecture of these regions, we sequenced a preliminary set of 11 gibbon BAC clones spanning BOSRs.
Breakpoint Identification by Array Painting of Flow-Sorted Gibbon Chromosomes on Human Arrays
We employed array painting (see [32] and Materials and Methods for more details) to map the end-points of gibbon– human synteny regions relative to the human genome. In this technique the chromosomes carrying balanced reciprocal translocations are isolated by flow sorting, and the DNAs are labeled with two contrasting dyes (Cy3 and Cy5) and hybridized to an array of 32,000 human BAC DNAs spotted on a glass slide. A single hybridization thus permits the accurate mapping of breakpoints at a resolution determined by the genomic intervals between BACs on the array. A breakpoint detected by this method is referred to as a BOSR. Optimal experimental conditions were found by hybridiz-ing three gibbon chromosomes separately (NLE13, NLE20, and NLE10) in a preliminary array-painting experiment. Array-painting experiments were then economized by pool-ing the sorted gibbon chromosomes so that the gibbon chromosomes in each pool detected distinct human chromo-somes. This ‘‘smart pooling’’ was possible because the gibbon–human synteny regions have previously been identi-fied through chromosome painting [7,28,29,31]. Pooling allowed us to conduct array painting on four pools of gibbon chromosomes, which was equivalent to conducting 26 separate hybridizations for each gibbon chromosome (2n¼ 52). The pooling strategy is shown in Table S1.
Single test and reference hybridization results revealed that the signal-to-noise ratio was too low for accurate detection of BOSR coordinates. After determining that the hybridization noise was systematic, we developed a noise-reduction method (Protocol S1) to obtain better definition of the breakpoints. Figure 1A and 1B shows the individual data plots for human Chromosome 2 obtained with pools containing flow-sorted chromosomes NLE14 and NLE19, respectively. These two gibbon chromosomes resulted from a reciprocal transloca-tion and many inversions involving ancestral sequences homologous to human Chromosomes 2 and 17 [7]. After applying our noise-reduction method, we obtained a well-defined shift in the plateau values at a single location coinciding with the approximate site of the BOSR (Figure 1C). Results for all reciprocal BOSRs pairs are presented in Figure S1.
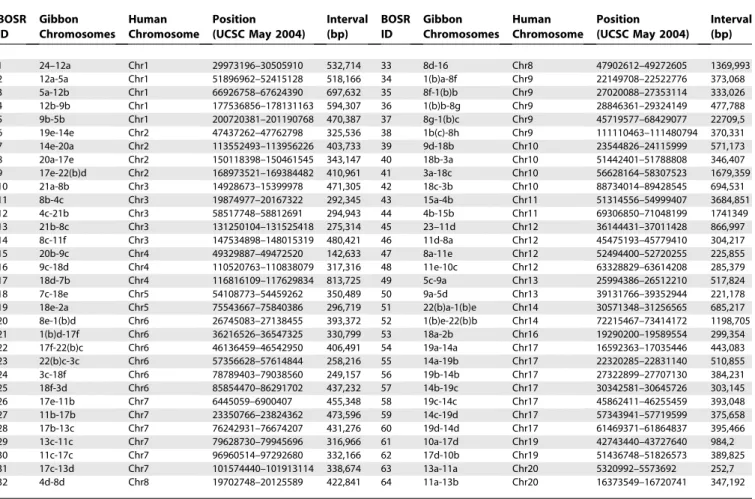
Altogether, 64 BOSRs have been mapped to the human genome (Hg17, UCSC May 2004) (Table 1 and Figure 2). Among these 64 regions, four correspond to human centromeres and one overlaps with the site where two ancestral ape chromosomes fused telomere-to-telomere to form human Chromosome 2 (2q13-2q14). Six noncentro-meric BOSRs (BOSR-33, -41, -44, -45, -52, and -61) could not be mapped with a precision higher than 850 kb. In the case of BOSR-33 and BOSR-45, mapping resolution was affected by their pericentromeric locations where abundant human genomic duplications caused noisy plots. In the
Synopsis
particular case of BOSR-44, we confirmed that the high noise resulted from a neighboring keratin-associated protein gene cluster located on human chromosome 11q13.5 (data not shown).
FISH Confirmation and Cross-Species Analysis of BOSRs In order to confirm the accuracy of array-painting results, ten BOSRs were validated by FISH experiments where BAC clones from the‘‘32K set’’were hybridized to NLE metaphase
Figure 1.Identification of Break of Synteny Regions Using the Log2Ratio Difference Method
(A and B) The plotted value of Log2ratio/chromosome length for human Chromosome 2 after hybridization with sorted gibbon chromosomes NLE14 and NLE19, respectively.
(C) Results of the application of the difference method to the datasets in (A) and (B). After canceling out the systematic variation, it is possible to discern three different regions from left to right, one amplified (1), one deleted (2), and one at the baseline (3).
doi:10.1371/journal.pgen.0020223.g001
preparations. In most of the cases, a single BAC hybridized to two disparate locations as expected. Only BOSR-32 and BOSR-11 demonstrated a single hybridization signal, suggest-ing that the breakpoint was located between two BACs or in a small region of overlap between them. A few examples of FISH experiments are shown in Figure 3A.
Additionally, six of these BOSRs, thought to be common to all gibbons [7,29], were mapped to the gibbon species Hylobates lar (HLA) (2n¼ 44) using the same human FISH probes (Figure 3A). In five cases (BOSRs8,16,19,35 and 53), the human BACs produced similar split signals on HLA and NLE metaphase preparations, indicating that the break-point is shared by the two species, strengthening the original hypothesis that the breaks occurred in the karyotype of a common ancestor [7,29]. However, in one case (BOSR-6), we did not observe a split FISH signal on the HLA metaphase preparations (data not shown). This result suggests that this translocation occurred in the NLE lineage after the split from the common ancestor of NLE and HLA.
Breakpoint Identification by Gibbon BAC End Sequence Mappings onto Human
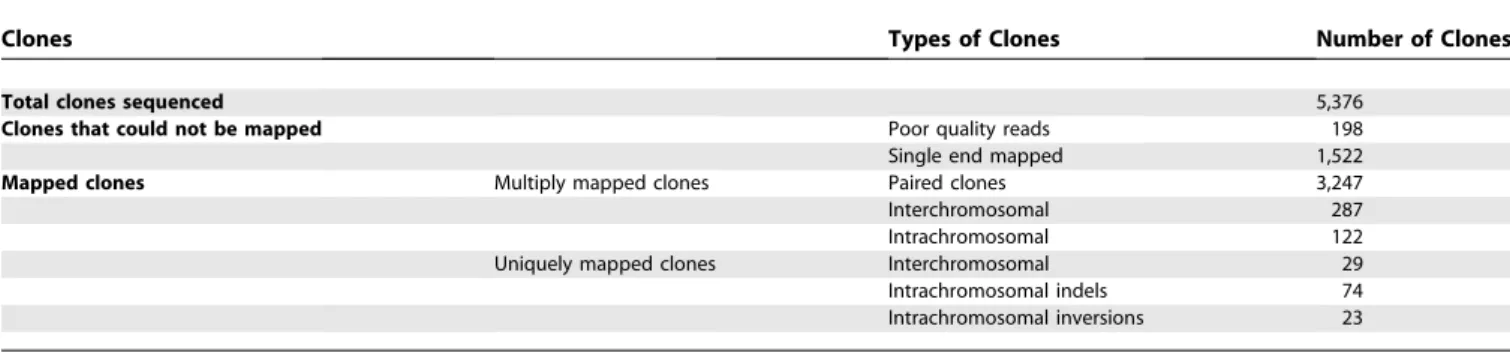
Both ends of 5,376 clones from the gibbon genomic BAC library CHORI-271 were sequenced and mapped onto the human genome using the BLAT program [34] (Protocol S1). Gibbon BACs spanning putative breakpoints were identified using the paired BAC end-sequence mappings to the human genome by applying a ‘‘pairing criteria’’implemented as a script (Protocol S1). Mapping results are summarized in Table 2.
For the purpose of visualizing the gibbon clones mapped onto the human genome, we created a software tool that graphically depicts the chromosomal position of gibbon BAC mappings on the human genome. This software allows for full chromosome views as well as views showing a user-config-urable window size (Protocol S1 and Figure S2A and S2B). This tool allowed us to easily overlay the BAC end sequence (BES) mappings onto mappings obtained from array painting and manually identify additional clones.
Table 1.Array-Painting Results
BOSR ID
Gibbon Chromosomes
Human Chromosome
Position (UCSC May 2004)
Interval (bp)
BOSR ID
Gibbon Chromosomes
Human Chromosome
Position (UCSC May 2004)
Interval (bp)
1 24–12a Chr1 29973196–30505910 532,714 33 8d-16 Chr8 47902612–49272605 1369,993
2 12a-5a Chr1 51896962–52415128 518,166 34 1(b)a-8f Chr9 22149708–22522776 373,068
3 5a-12b Chr1 66926758–67624390 697,632 35 8f-1(b)b Chr9 27020088–27353114 333,026
4 12b-9b Chr1 177536856–178131163 594,307 36 1(b)b-8g Chr9 28846361–29324149 477,788
5 9b-5b Chr1 200720381–201190768 470,387 37 8g-1(b)c Chr9 45719577–68429077 22709,5
6 19e-14e Chr2 47437262–47762798 325,536 38 1b(c)-8h Chr9 111110463–111480794 370,331
7 14e-20a Chr2 113552493–113956226 403,733 39 9d-18b Chr10 23544826–24115999 571,173
8 20a-17e Chr2 150118398–150461545 343,147 40 18b-3a Chr10 51442401–51788808 346,407
9 17e-22(b)d Chr2 168973521–169384482 410,961 41 3a-18c Chr10 56628164–58307523 1679,359
10 21a-8b Chr3 14928673–15399978 471,305 42 18c-3b Chr10 88734014–89428545 694,531
11 8b-4c Chr3 19874977–20167322 292,345 43 15a-4b Chr11 51314556–54999407 3684,851
12 4c-21b Chr3 58517748–58812691 294,943 44 4b-15b Chr11 69306850–71048199 1741349
13 21b-8c Chr3 131250104–131525418 275,314 45 23–11d Chr12 36144431–37011428 866,997
14 8c-11f Chr3 147534898–148015319 480,421 46 11d-8a Chr12 45475193–45779410 304,217
15 20b-9c Chr4 49329887–49472520 142,633 47 8a-11e Chr12 52494400–52720255 225,855
16 9c-18d Chr4 110520763–110838079 317,316 48 11e-10c Chr12 63328829–63614208 285,379
17 18d-7b Chr4 116816109–117629834 813,725 49 5c-9a Chr13 25994386–26512210 517,824
18 7c-18e Chr5 54108773–54459262 350,489 50 9a-5d Chr13 39131766–39352944 221,178
19 18e-2a Chr5 75543667–75840386 296,719 51 22(b)a-1(b)e Chr14 30571348–31256565 685,217
20 8e-1(b)d Chr6 26745083–27138455 393,372 52 1(b)e-22(b)b Chr14 72215467–73414172 1198,705
21 1(b)d-17f Chr6 36216526–36547325 330,799 53 18a-2b Chr16 19290200–19589554 299,354
22 17f-22(b)c Chr6 46136459–46542950 406,491 54 19a-14a Chr17 16592363–17035446 443,083
23 22(b)c-3c Chr6 57356628–57614844 258,216 55 14a-19b Chr17 22320285–22831140 510,855
24 3c-18f Chr6 78789403–79038560 249,157 56 19b-14b Chr17 27322899–27707130 384,231
25 18f-3d Chr6 85854470–86291702 437,232 57 14b-19c Chr17 30342581–30645726 303,145
26 17e-11b Chr7 6445059–6900407 455,348 58 19c-14c Chr17 45862411–46255459 393,048
27 11b-17b Chr7 23350766–23824362 473,596 59 14c-19d Chr17 57343941–57719599 375,658
28 17b-13c Chr7 76242931–76674207 431,276 60 19d-14d Chr17 61469371–61864837 395,466
29 13c-11c Chr7 79628730–79945696 316,966 61 10a-17d Chr19 42743440–43727640 984,2
30 11c-17c Chr7 96960514–97292680 332,166 62 17d-10b Chr19 51436748–51826573 389,825
31 17c-13d Chr7 101574440–101913114 338,674 63 13a-11a Chr20 5320992–5573692 252,7
32 4d-8d Chr8 19702748–20125589 422,841 64 11a-13b Chr20 16373549–16720741 347,192
The table lists BOSRs between human and gibbon identified by array painting. The location on the human genome corresponds to the Hg17 assembly. The BOSR IDs correspond to Figure 2.
doi:10.1371/journal.pgen.0020223.t001
Figure 2.Comparative Map of Human and Gibbon Chromosomes
Ideogram of human chromosomes with orthologous gibbon chromosomes identified by array painting represented by colored bars to the left of each chromosome. Each segment is named after the gibbon chromosome followed by a small letter that refers to its mapping order in the gibbon chromosome. The BOSRs have been defined for convenience by numbers (Table 1). Gibbon clones spanning breakpoints identified by BES mapping are also located on the map. Clones with map positions that disagree with the array-painting map are italicized.
Interchromosomal Rearrangements
Gibbon clones identified as putatively spanning interchro-mosomal rearrangements were mapped by FISH on gibbon metaphase preparations. Clones giving signals on more than two gibbon chromosomes were considered possible clone artifacts (chimeric clones) or duplicated regions in the gibbon and were removed from further analysis. We also screened the gibbon BAC CHORI-271 library (Materials and Methods) in order to identify at least two additional clones spanning identified breakpoints. Table 3 reports clones that were validated by combining the array-painting, FISH, and library-screening approaches. Twenty-five clones were confirmed by additional overlapping clones with BES mappings to the same pair of human chromosomes. In seven instances, we identified clones spanning reciprocal breakpoints by library screening and subsequent BES. These clones map on the same region of the human genome; however, they are localized on two derivative gibbon chromosomes in the case of translocations, or different regions of the same chromosome in the case of inversions. We verified that these clones carry reciprocal breakpoints by FISH hybridization on gibbon metaphases. Examples of FISH experiments are shown in Figure 3B.
Intrachromosomal Rearrangements
Based on our pairing criteria, most of the clones identified as spanning intrachromosomal rearrangements resulted from insertion/deletions (indels) in either the gibbon or the human genomes (74 out of 97). Indels cause discrepancies between paired BES mapping distances on the human genome compared to the average gibbon BAC insert size. We formally defined this as BES mappings at a distance less than or greater than three standard deviations from the 172-kb-clone insert size. We verified the insert size of the 74 clones spanning putative indels using NotI digestion and pulsed-field electrophoresis. Based on the pulsed-pulsed-field electropho-resis, the 60 gibbon BACs with BES mapping distances of 40– 60 kb relative to the human genome were found to not be indels, as they had actual insert sizes in the 40–60 kb range. We presumed that the remaining 14 clones with BES distances exceeding 300 kb represent actual insertions in the human genome or deletions in the gibbon genome. Results are summarized in Table 4.
Clones putatively spanning inversion breakpoints were validated by comparisons with BOSRs previously defined by array painting (Table 3). Large-scale inversions were further confirmed by hybridizing the gibbon clones onto human metaphase preparations (Figure 3C). Additional clones spanning the same breakpoint were obtained by screening the CHORI-271 library as described for interchromosomal breakpoints. Through this validation process, 15 out of 23 clones were confirmed and the remaining eight clones were removed from consideration.
Combination of Array Painting and End-Sequencing Mapping
The goals of our study were 1) to obtain a map of the BOSRs between human and gibbon at high resolution and 2) to identify species-specific clones spanning chromosomal rearrangements for use in further molecular analysis. In pursuit of our second goal, we selected for further analysis 38 gibbon BAC clones corresponding to BOSRs identified by array painting human BACs. We constructed probes across these BOSRs at 75-kb intervals based on the human genome sequence and used these probes to screen the gibbon library. Using this approach, we identified an additional 26 gibbon clones containing breakpoint loci (15 inversions and 11 translocations) (Table 5).
Identification of Breakpoints Specific to the Gibbon Lineage
To ensure that we identified rearrangements that occurred in the gibbon lineage, we mapped the BES of gibbon clones identified as spanning rearrangement breakpoints onto the latest genome assemblies of rhesus macaque (UCSC Build rheMac2) and chimpanzee (UCSC Build panTro1) using BLAT. We removed ambiguous mappings and classified the remaining mappings using the same pairing criteria applied to the human genome mappings. We classified putative rearrangements as 1) gibbon specific if gibbon was rear-ranged relative to human, chimpanzee, and macaque; 2) great ape specific if gibbon was not rearranged relative to macaque, but was rearranged relative to human and chimpanzee; and 3) human specific if gibbon was not rearranged relative to macaque and chimpanzee but was rearranged relative to human (Table S2). Based on this classification, we identified three human-specific rearrangements and four great ape– specific rearrangements.
One of the events classified as great ape–specific is the inversion of human Chromosome 3, with breakpoints at 3p25 and 3q21, which are regions already known as rearrangement hotspots in primates [35]. BOSR-10 and BOSR-13 from the array-painting map span these inversion breakpoints, and clone CH271-261K6 spans one of the breakpoints. Addition-ally, we identified a clone spanning the breakpoint of an inversion that occurred in the ancestor of the great apes in the chromosome homologous to human Chromosome 7. Mu¨ller et al. [36] previously described this inversion, which occurred in the lineage leading to human and African great apes. Human, chimpanzee, and gorilla therefore share the same derivative form, while orangutan, small apes, and macaque share the ancestral one.
In total, we identified 110 breakpoints between human and gibbon chromosomes due to intra- and interchromosomal rearrangements. Of those, 100 occurred during the evolution of the gibbon.
Figure 3.Breakpoint Validation by FISH
(A) FISH experiments to validate breakpoints identified by array painting. Images 1 and 2 show hybridization on NLE metaphase preparations with human BACs spanning breakpoints identified by array painting. The yellow color in image 1 is due to the overlap of red and green spots as both BACs map on the same chromosome. Image 3 shows a similar experiment done on HLA metaphase preparations. The reciprocal position of the BACs used in each experiment is shown in the boxes below the images.
(B) FISH validation experiments on six gibbon BAC clones spanning three reciprocal breakpoints for the same rearrangement. In the diagrams, the rearrangements are illustrated starting from the ancestral chromosome form. Abbreviation: AC, ancestral chromosome.
(C) Gibbon BACs spanning inversion breakpoints were tested by FISH on human and gibbon metaphases. A BAC spanning an inversion in gibbon is expected to give a split signal on the human chromosome and a single signal on the corresponding gibbon chromosome.
Analysis of Gibbon-Specific Breakpoints Spanning Regions on the Human Genome
It is widely accepted that regions of chromosomal instability and SDs colocalize more frequently than expected by random chance. SDs are blocks of DNA 1–400 kb in length, repeated in the genome with a high level of sequence identity (.90%) [37]. The association between SDs and evolutionary breakpoints in primates has been repeatedly reported [13,14,16,36,38], leading to speculation that these large blocks of homology predispose the flanking regions to rearrange-ment by nonallelic homologous recombination. Obviously, one would like to explore correlations between gibbon SDs and chromosomal rearrangements. Since the gibbon genome has not been sequenced, we used the human genome as the most closely related surrogate. Our assumption is that chromosomal regions enriched for SDs in gibbon may also show an enrichment of SDs in the human genome.
We first analyzed the overlap between the human regions orthologous to gibbon-specific BOSRs and the human SDs reported in the UCSC browser [39]. We found that 46 of 100 regions (46%) overlapped with at least one SD. This correlation remained strong (42%) when breakpoints located in the centromeric regions and regions identified with lower resolution were removed from the analysis. It is important to note that the BOSRs represent segments that are, on average, 220 kb. Therefore, the SD may overlap with the BOSR, but not necessarily include the actual breakpoint.
To statistically validate the significance of these data, a simulation was run in which the 100 breakpoint regions were randomly relocated 1,000 times in their original chromo-some, emulating a random-breakage model (Protocol S1). The result was a count of the number of regions overlapping SDs at each step of the simulation. The association of 100 detected breakpoint regions with SDs fell more than three standard deviations away from the mean of the simulated sampling distribution (Figure 4A), indicating that this association is highly unlikely to have occurred by chance.
Measuring overlap alone does not sufficiently express the proximity of these regions to SDs; thus, the breakpoint regions were expanded in 100 kb increments and monitored for variation in the number of regions overlapping with SDs (Figure 4B). Out of the 100 regions, 80 overlapped with SDs after being expanded by 500 kb and 97 after being expanded
by 1.5 Mb. We confirmed that such an overlap was unlikely to occur by chance by simulating randomly relocated regions expanded in a similar manner (data not shown). Finally, the association between our breakpoints and SDs was examined by measuring their base-pair overlap while shifting the breakpoint regions up to 5 Mb upstream and downstream of their original positions using 100 kb increments. The overlap was highest when the breakpoints were in their original positions and overlap progressively decreased with an increase in the distance shifted (Figure 4C).
Of the 46 BOSRs overlapping with human SDs, 27 are covered by at least one gibbon clone. We used these clones for interphase FISH experiments on NLE. In 22 cases, multiple signals were evident on NLE nuclei, suggesting duplicated regions. The remaining five clones showed no indication of duplications at the cytogenetic level. Additionally, 10 out of these 22 clones were duplicated in two other species of gibbon (Symphalangus syndactylus and HLA) belonging to different genera. These data suggest that the SDs most likely appeared within a common ancestor (Figure S3).
We cannot assume that these duplications were responsible for the chromosomal rearrangement events in NLE, as we have insufficient data to indicate the duplications predated the breakage events. However, this correlation is consistent with a well-established model in which duplications are indicative of the‘‘plasticity’’of a region [21].
Analysis of Fully Sequenced Gibbon BACs Spanning Rearrangement Breakpoints
We analyzed the finished sequence of 11 gibbon clones comprising a representative sample of the clones identified in this study. Although the rearrangement events occurred in ancestral chromosomal sequences that are in part altered in the current genome, the study of orthologous sequences can nevertheless still provide us with information about the nature of the genomic instability present in these regions. The breakpoint spanned by each clone was localized to the break of synteny between the gibbon clone and the human genome.
The first interesting discovery to emerge from the analysis of sequenced clones was the presence of‘‘ micro-rearrange-ments’’that fell below the resolution of the BES mappings. Micro-rearrangements were observed in two clones,
CH271-Table 2.Analysis Using the Pairing Criteria of Gibbon BES Mapped on the Human Genome
Clones Types of Clones Number of Clones
Total clones sequenced 5,376
Clones that could not be mapped Poor quality reads 198
Single end mapped 1,522
Mapped clones Multiply mapped clones Paired clones 3,247
Interchromosomal 287
Intrachromosomal 122
Uniquely mapped clones Interchromosomal 29
Intrachromosomal indels 74
Intrachromosomal inversions 23
The table illustrates the results of the analysis of the gibbon BESs mapped onto the human genome. Some BACs were not informative because either one end (198) or both ends (1,522) could not be mapped. Such mapping failures resulted from low quality reads or the absence of unique sequences. Depending on the orientation and distance of the BES pairs (see text), each clone was classified as paired, interchromosomal, or intrachromosomal. We also required that each clone spanning a putative breakpoint had only a single mapping of each end. On the basis of this more stringent criterion, we classified these clones as‘‘uniquely mapped.’’
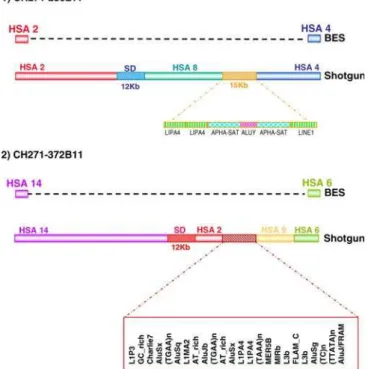
372B11 and CH271-236L11, in which the complete sequence revealed regions orthologous to human chromosomes other than those predicted by BES or array painting (Figure 5). In both cases, one of the breakpoints was found to be enriched for SDs, while the other breakpoint fell within an inter-spersed repeat-rich region (Figure 5). This finding suggests that the gibbon genome might be more rearranged than previously observed. Our sample therefore contained 15 breaks of synteny to be analyzed rather than 11.
Five BOSRs, including the two BOSRs mentioned above, were within 5 kb of SDs. One example is the clone CH271-262E11 mapping to NLE Chromosome 19 and spanning a breakpoint between human Chromosomes 2 and 17. The BOSR in this clone was identified at the base-pair level and
was found to be adjacent to the growth-hormone gene cluster. The breakpoint is 20 bp away from a duplicated segment containing the ortholog of gene GH2. At an approximate 2-kb distance from GH2, we found a block of about 15 kb duplicated in tandem. This block corresponds to a SD in the human genome located at Chr17:59292722– 59308474 that is repeated in the nearby genomic region Chr17:59316565–59331044 (Hg17, UCSC May 2004). These duplications contain a second gene from the growth hormone cluster (CHS2). It has been shown [40] that the growth hormone family experienced an enhanced rate of duplication in primates compared to other mammals, with many duplication events occurring before the divergence of Old World monkeys and New World monkeys. Furthermore, Ye et Table 3.Gibbon BAC Clones Spanning Breakpoints Identified by Mapping End Sequences
BLAT Hits
Clone Breakpoint Mapping on Human Genome
Validation BES 1 UCSC
(Hg17)
BES 2 UCSC (Hg17)
FISH Array Painting
Overlapping or Reciprocal Clones
Single BLAT hit
CH271-261L01 InvHSA1 Chr1:52090040–52090497 Chr1:177879393–177879781 HSA1p32–1? BOSR 2–4 —
CH271-229B20 InvHSA1 Chr1:141482391–141483204 Chr1:203067770–203066953 — — Overlapping CH271-263D23 CH271-263D23 InvHSA1 Chr1:141500962–141501687 Chr1:203078984–203078484 — — Overlapping CH271-229B20 CH271-261K06 InvHSA3 Chr3:131140276–131141065 Chr3:15040075–15040867 HSA3p25-3q21 BOSR 10–13 —
CH271-262E15 invHSA4 Chr4:185452384–185451548 Chr4:187341410–187339042 — — 1Ov CH271-261A22 InvHSA7 Chr7:6909033–6908294 Chr7:97013807–97014540 HSA7p22-q21 BOSR 26–30 — CH271-263M06 invHSA7 Chr7:92801747–92802246 Chr7:102099647–102100414 — — 2Ov CH271-267G21 invHSA17 Chr17:55284621–55285294 Chr17:57642888–57643214 — BOSR 59 2Ov CH271-274L01 invHSA17 Chr17:66672271–66671502 Chr17:69721057–69720629 — — 4Ov CH271-230F13 HSA2–11/6 Chr2:195419232–195419924 Chr11:93109878–93112147 HLE22 — 2Ov CH271-269N07 HSA2–6 Chr2:180572342–180573081 Chr6:51799120–51798359 HLE22 — —
CH271-226E3 HSA5–16 Chr16:16097993–16097455 Chr5:54005967–54006698 HLE18 BOSR18 RecCH271-269J8 and 6Ov CH271-274B24 HSA6–14 Chr6:67341892–67342683 Chr14:32546513–32547325 HLE1 (tel) discordance 2Ov
CH271-275I11 HSA20–7 Chr20:16747495–16746766 Chr7:79689194–79689921 HLE13 BOSR 29–63 3Ov CH271-288N2 HSA20–7 Chr20:16545814–16546569 Chr7:79823415–79822697 HLE11 BOSR 29–63 Rec275I11, 2Ov
CH271-228C01 HSA20–7 Chr20:16651858–16651083 Chr7:79596388–79597152 HLE13 BOSR 29–64 Overlapping CH271- 275I11 CH271-262O07 HSA8–5 Chr8:116011453–116012115 Chr5:20660955–20661663 HLE16p discordance —
CH271-183B5 HSA8–5 Chr8:115974044–115974755 Chr5:20660955–20661702 HLE16q — Rec262O7 CH271-269J08 HSA16–22 Chr16:16033939–16034752 Chr22:15821435–15820704 HLE18 (cen) discordance 1Ov CH271-262E11 HSA17–2 Chr17:59260052–59260792 Chr2:27718116–27718928 HLE19p — 6Ov CH271-405A9 HSA17–2 Chr17:59333868–59333191 Chr2:27994865–27994148 HLE19q — 1Ov CH271-262G05 HSA17–2 Chr17:20760201–20759787 Chr2:73499254–73499953 HLE14 — 1Ov CH271-267G23 HSA17–2 Chr17:77747544–77748535 Chr2:99432574–99431876 HLE14q — 1Ov
CH271-247C2 HSA17–2 Chr17:77943273–77942883 Chr2:99285457–99286181 HLE14cen — Rec267G23 and 4Ov CH271-228P23 HSA5–3 Chr5:175546944–175548051 Chr3:196976902–196977133 — discordance —
CH271-263C09 HSA22–4 Chr22:32004833–32004498 Chr4:140701659–140702431 HLE7 — 4Ov Multiple BLAT hits
CH271-228N13 InvHSA10 Chr10:56218669–56219382 Chr10:88936450–88935739 HSA10p11-q22 BOSR 41–42 — CH271-275P15 InvHSA7 Chr7:72452209–72452028 Chr7:99427263–99427604 HSA7q11.2-q22 — 3Ov
CH271-274K2 InvHSA2 Chr2:128218474–128217676 Chr2:131949539–131950003 HSA2q14.3-q21.1 — 1Ov and Ov CH271-270H22 CH271-270H22 HSA2–4 Chr2:131787947–131787214 Chr4:48816153–48816872 HLE20 BOSR 15 3Ov
CH271-246M2 HSA2–17 Chr2:73408992–73409723 Chr17:20231923–20231185 HLE14 — Overlapping CH271-262G5 CH271-269B20 HSA5–22 Chr5:52731034–52731746 Chr22:33350231–33350648 HLE7 — 6Rec with CH271-269J8 Additional clones
CH271-411O5 HSA2–6 Chr2:195380759–195381309 Chr6:35729607–35729246 HLE22b BOSR21 1Ov; Ov CH271-230F13 CH271-350B17 HSA4–5 Chr4:117170986–117171703 Chr5:54237257–54236536 HLE18 BOSR17–18 1Ov
CH271-91H2 HSA11–18 Chr11:54785823–54785088 Chr18:11613257–11613774 — BOSR42 2Ov CH271-78K20 HSA4–16 CHr4:117475357–117475997 Chr16:68576978–68577856 — — 1Ov CH271-383H22 InvHSA3 Chr3:194767754–194767106 Chr3:196994274–196993696 — — 1Ov
List of the gibbon BACs with inversion or translocation breakpoints and their map position in the human genome. The list only includes clones that have been validated through two or more different methods: FISH, correspondence with the array-painting map, or presence of overlapping clones spanning the same breakpoint (Ov) and/or clones spanning reciprocal breakpoints (Rec). In some cases, the BES results did not agree with the array painting map (discordance).
doi:10.1371/journal.pgen.0020223.t003
al. [40] recently showed that the NLE growth hormone cluster behaved differently from other primates, with rapid evolu-tion occurring after the divergence of the gibbon ancestor from the great apes. The coexistence of duplications and an inversion breakpoint indicate this region is highly unstable
and may be one of the rearrangement hotspots of primate genomes.
Six of the BOSRs coincided with interspersed repeats (SINEs, LINEs, and LTRs). In clone CH271-236L11, an alpha-satellite was identified due to the proximity of the BOSR to a Table 4.Gibbon BAC Clones Spanning Indels
Indel Clone BES1 (UCSC, Hg17) BES2 (UCSC, Hg17) Size (kb) Annotations
1 246G05 Chr10:18269232–18268552 Chr10:17811348–17812155 457 MRC1gene (duplicated in tandem in human) 2 230O09 Chr9:27710815–27710331 Chr9:27271497–27272252 439
3 270C01 ChrX:64028319–64027581 ChrX:63594273–63595030 434 4 262A11 Chr12:46440964–46440347 Chr12:46012628–46014971 428 5 230C11 Chr1:163608469–163607729 Chr1:163182211–163182957 426
6 270L16 Chr4:119647441–119648195 Chr4:120063804–120063049 416 SDs
7 269P20 Chr9:133866822–133867584 Chr9:134275988–134275219 409
8 269K13 Chr1:244067762–244068481 Chr1:244423096–244422305 355 Olfactory receptor genes cluster (1q44) 9 261P07 Chr11:104216227–104216839 Chr11:104565860–104565235 349 Caspase gene cluster (11q22.3)
10 230E01 ChrX:154214505–154213745 ChrX:153900729–153901465 313 SDs
11 246A03 Chr2:83233988–83227148 Chr2:82926227–82926794 307 12 273L4 Chr14:40115187–40115781 Chr14:40705452–40704972 590 13 273P17 Chr4:31750176–31749402 Chr4:31418003–31418813 332
14 263E10 Chr7:94963716–94964512 Chr7:94970070–94969290 6
These clones were identified because their end sequence mappings suggested their size exceeded the average insert size of the library by more than three standard deviations (with the exception of clone CH271-263E10). In some cases, the indel interval corresponds to a region known to be extremely dynamic and having likely undergone duplications during recent evolution. This is the case for the olfactory receptor and caspase gene clusters (see Annotations column).
doi:10.1371/journal.pgen.0020223.t004
Table 5.Gibbon BAC Clones Isolated Using the Array-Painting Map Combined with Filter Screening and BES Mapping
Clone Breakpoint Mapping on Human Genome Validation BES 1
UCSC (Hg17)
BES 2 UCSC (Hg17)
Array Painting Overlapping or Reciprocal Clones
CH271-461L14 HSA1–13 Chr1:200502116–200501557 Chr13:26172852–26173025 BOSR5–49 4Ov CH271-122E24 HSA2–6 Chr2:168951090–168951524 Chr6:46093242–46093649 BOSR9–22 1Ov
CH271-40A18 HSA2–6 Chr2:169109259–169109013 Chr6:46409575–46409436 BOSR9–22 RecCH271-122E24 and 1Ov
CH271-44A23 HSA2–7 Chr2:150270219–150270174 Chr7:2508091–2507940 BOSR8 1Ov
CH271-449L10 HSA2–17 Chr2:73525815–73525741 Chr17:61790104–61789574 BOSR60 —
CH271-234B14 HSA3–8 Chr3:19775973–19776048 Chr8:20170234–20169964 BOSR11–32 1Ov CH271-380N5 HSA3–12 Chr3:58788155–58788378 Chr12:120345686–120344950 BOSR12 — CH271-125L9 HSA3–12 Chr3:147741227–147740540 Chr12:45808180–45808565 BOSR14–46 — CH271-401L9 HSA4–10 Chr4:110750313–110750205 Chr10:24076771–24076626 BOSR16–39 — CH271-114O8 HSA5–16 Chr5:75773648–75772974 Chr16:19526628–19525951 BOSR19–53 1Ov CH271-237A9 HSA12–19 Chr12:63623342–63622791 Chr19:41730158–41730776 BOSR49–61 2Ov
CH271-186A1 InvHSA6 Chr6:57494813–57495068 Chr6:62082493–62082541 BOSR23 —
CH271-141K21 InvHSA9 Chr9:22218730–22218920 Chr9:111444480–111444616 BOSR34–38 —
CH271-171B20 InvHSA9 Chr9:27166326–27166532 Chr9:32479611–32479185 BOSR35 1Ov
CH271-202N11 InvHSA10 Chr10:51751886–51751461 Chr10:52229635–52229449 BOSR40 3Ov CH271-185K6 InvHSA14 Chr14:30838138–30838392 Chr14:73124459–73124155 BOSR51–52 4Ov CH271-133C19 InvHSA17 Chr17:26245998– 26246406 Chr17:27546961– 27546547 BOSR56 — CH271-26L7 InvHSA17 Chr17:30504813–30504628 Chr17:45966506–45966963 BOSR57–58 3Ov CH271-49C12 InvHSA17 Chr17:45884374–45884707 Chr17:55503126–55502460 BOSR58 — CH271-219C17 InvHSA17 Chr17:20613964–20614099 Chr17:57510580–57511059 BOSR59 —
CH271-188I7 InvHSA19 Chr19:51714530–51714491 Chr19:5879587–5879508 BOSR62 —
CH271-30L2 InvHSA19 Chr19:5851377–5851846 Chr19:51500098–51500471 BOSR62 —
CH271-244C18 InvHSA6 Chr6:26666078–26866078 Chr6:58078211–58278211 BOSR20 —
CH271-286K22 InvHSA7 Chr7:75671223–75671763 Chr7:101829081–101830139 BOSR28–31 — CH271-446I8 InvHSA7 Chr7:23083034–23082855 Chr7:67941088–67941258 BOSR27-cen —
CH271-398E1 InvHSA17 Chr17:20753351–20754086 Chr17:69796739–69797427 — 6Ov; Ov CH271-262G5, 274L1
Additional gibbon clones spanning breakpoints were identified using the map of BOSRs obtained by array painting. Probes were designed inside the BOSRs and used to screen the gibbon genomic BAC library.
centromere (Figure 5). Clones 228C1 and CH271-86M19 span the reciprocal breakpoints of a translocation between human Chromosomes 7 and 20. In both clones, an (AT)n repeat separates the two homologous segments, preventing us from localizing the junction to the base-pair level. The (AT)n repeat in clone CH271-228C1 is 300 bp, and in CH271-86M19 it is 168 bp. A simple repeat classified as ‘‘AT rich’’ is also present in the corresponding position of human Chromosome 7. We confirmed the ancestral origin of this repeat by PCR amplifying and sequencing the ortholo-gous region in gibbons belonging to three additional genera (Hylobates agilis, Bunopithecus hoolock, and S. syndactylus). We could therefore exclude the possibility that the repeat was a consequence of the rearrangement.
The presence of the AT-rich repeat in relation to these BOSRs may indicate a different breakpoint-inducing mech-anism. Recently, Gotter and colleagues showed that the propensity to form secondary structures such as stem-loops can confer fragility to DNA [41]. Using the M-Fold sequence analysis package (http://bioweb.pasteur.fr/seqanal/interfaces/ mfold-simple.html), we confirmed that the AT-rich repeats from the three clones give rise to long stem-loop structures (data not shown). At this point we do not have enough data to assume that this was the mechanism responsible for the translocation occurring during the evolution of theNomascus
genus. However, the cooccurrence of an evolutionary break-point and an AT-rich repeat region is intriguing.
Conclusion
This study describes the mapping and validation of a large number of syntenic breakpoints between homologous chro-mosomes of human and NLE. All the translocation break-points previously identified by chromosome-painting studies were mapped to the human genome at a greatly increased resolution. About 20 additional rearrangements were discov-ered as a result of the higher sensitivity of our approaches. Overall, our research identified about 100 breakpoints occurring in the gibbon lineage. The study also yielded gibbon BACs containing breakpoint sites. In 11 sequenced gibbon BACs, we found elements near the breakpoints previously shown to play a key role in primate chromosome plasticity and evolution. Within the sequenced BACs three different patterns were evident. First, two BACs contained additional breakpoints that may have resulted from a complex, nonreciprocal translocation event or from subse-quent chromosomal rearrangements. Recent high-resolution breakpoint analyses on human translocations thought to be balanced showed various ‘‘microtranslocations’’ [42]. Thus, translocations in human pathology and primate evolution may not always be simple breaks involving just two chromo-somes but may be more complicated. Second, a correlation between SDs and evolutionary breakpoints in primates and other mammals has previously been suggested [11,13,16,43]. When all 100 gibbon-specific breakpoints were analyzed, a strong enrichment for SDs (in the human genome) was observed within 200 kb of the actual breakpoints (in the gibbon genome). Third, interspersed repeats have been linked to genomic instability in other studies, and several evolu-tionary breakpoints in primates are known to have occurred in repeat-rich areas [21,38,44,45]. Two of the sequenced BACs contained a breakpoint immediately adjacent to an AT-rich repeat with the potential to form stem-loop structures [41].
No generalized pattern unique to gibbon breakpoints is evident from the present molecular data. It remains to be determined if the greater number of chromosomal rear-rangements in the small apes is due to an enhanced frequency of chromosomal breakages or an increased ability to rescue derivative chromosomes in comparison to other mammals, possibly due to mating behavior or inbreeding. We believe that these questions may be answered by examining addi-tional aspects of small ape biology such as behavioral factors and population dynamics.
Materials and Methods
Array painting. BACs (32,855) spanning 95% of the human
euchromatic genome were assembled and rearrayed into 384-well microtiter dishes [46,47]. DNA was purified, amplified using the DOP (degenerate oligonucleotide-primed) PCR method, and spotted on CMT-GAPS UltraGaps coated glass slides (Corning, www.corning. com). Gibbon chromosomes were sorted on a FACS Vantage flow
Figure 4.Association of the Breakpoint Regions with Segmental Duplication
(A) The figure shows the sampling distribution of the overlap between SDs and a random set of regions obtained by relocating our original sample 1,000 times in the corresponding chromosomes. The original sample fell more than three standard deviations away from the mean of the simulated distribution (red arrow).
(B) The regions from the original sample were expanded in 100 kb increments. The number of regions overlapping with SDs at each step is shown. (C) We measured the amount of overlap (in base pairs) of our 100 regions, while shifting each of them up to 5 Mb left and right of their original positions in 100 kb increments. The strong correlation between the original position (red arrow) and SD content is shown.
doi:10.1371/journal.pgen.0020223.g004
Figure 5.Analysis of Fully Sequenced Gibbon BAC Clones
Two sequenced gibbon clones spanning rearrangement breakpoints revealed the presence of additional segments of synteny not observed by other methods. In both cases, the first break of synteny was found to contain SDs and the second to contain interspersed repeats.
cytometry system (BD Biosciences, www.bdbiosciences.com) as de-scribed for previous experiments [31]. The NLE lymphoblast cell line used for chromosome sorting was the same as described by Mu¨ller et al. [31] and Schro¨ck et al. [48]. Karyotype analysis revealed homozygosity for a known translocation polymorphism involving gibbon Chromosomes 1 and 22 (forms 1b and 22b). The only culture artifact observed was a trisomy for gibbon Chromosome 14. However, our karyotype analysis does not exclude the possibility that a small fraction of rearrangements observed by array painting were caused by cell-culture artifacts. DOP-amplified DNA [49] from flow-sorted chromosomes were subjected to a secondary DOP PCR and labeled with Cy3-dUTP (Amersham Biosciences, www5.amershambioscien-ces.com). Chromosomes X and Y were not included in this analysis because these are not involved in gibbon evolutionary translocations based on chromosome-painting studies. Anonymous human refer-ence DNA was obtained from Children’s Hospital Oakland Research Institute and amplified by DOP PCR. Labeling and hybridization were performed essentially as described by [50]. Hybridization images were generated by scanning the slides on a 4000B scanner (Axon Instruments, http://www.moleculardevices.com). The images were first processed using GenePix Pro 5.1 (Axon Instruments). The primary experimental data (GenePix Results files) were subjected to fully standardized data analysis (flagged spots removal, background subtraction, and loess normalization) by uploading them to the BioArray Software Environment microarray analysis software in-stallation [51], which performs standard normalization. The final output was human chromosome specific plots of Log2ratio values
versus chromosome location as well as a whole-genome view.
FISH.FISH was used as a validation method for BOSRs identified
uniquely by array painting or for gibbon BACs spanning inversions. Metaphase preparations of NLE were obtained from the same cell line used for chromosome sorting and previously described by Mu¨ller et al. [31] and Schro¨ck et al. [48]. The cell lines used for metaphase preparations of HLA andS. syndactyluswere the ones described by Jauch et al. [25] and Koehler et al. [26], respectively.Homo sapiens(HSA) metaphase preparations were prepared from peripheral blood culture. BAC DNA extraction was performed as reported by Ventura et al. [25]. FISH experiments were performed essentially as described by Lichter et al. [52]. BACs were labeled either with biotin-dUTP or digoxigenin-dUTP by standard nick-translation assay. Fluorescent signals were obtained using avidin-FITC (Vector Laboratories, www. vectorlabs.com) and anti-digoxigenin-rhodamine antibodies (Roche, http://www.roche-diagnostics.com). When confirming translocation breakpoints on gibbon chromosomes, BACs were hybridized together with chromosome-specific painting probes obtained from sorting lymphoblastoid and somatic hybrid cell line chromosomes followed by DOP PCR [52]. Digital images were obtained using a Zeiss Axioskop (Carl Zeiss Inc., www.zeiss.com) microscope equipped with a CCD-1300DS (VDS Vosskuehler GmbH, www.vdsvossk.de) or a SenSys (Photometrics, www.photomet.com) cooled CCD camera. Pseudoco-loring and merging of images was performed using SmartCapture (Digital Scientific, www.digitalscientific.co.uk) or Adobe Photoshop software (Adobe Systems Inc, www.adobe.com).
Library screenings.To identify BACs spanning putative breakpoint
regions, overgo probes of 40 bp [53] were designed from end sequences of selected gibbon BAC clones. To search for reciprocal breakpoints, the overgo probes were designed from the human sequence at 170 kb from the BES location. All the probes were pooled together and hybridized to high-density filters of the CHORI-271 library following procedures already described [54]. Subsequently, the positive clones obtained from this first screening were rearrayed on small filters. Each small filter was used for hybridization with individual probes.
The images were analyzed with the software ArrayVision Ver6.0 (Imaging Research Inc., www.imagingresearch.com).
Supporting Information
Figure S1. Identification of BOSRs between Human and Gibbon
Chromosomes by Array Painting
The results of array painting experiments done with different pools were combined for each human chromosome. After applying the difference method for noise reduction (see text) we identified all 64 BOSRs at a resolution of 300 kb (average) with the employment of a limited number of experiments. The figure shows the results obtained for all human chromosomes.
Found at doi:10.1371/journal.pgen.0020223.sg001 (240 MB PPT).
Figure S2.Translocations Viewer
This tool was developed in order to easily localize gibbon clones spanning a translocation or inversion breakpoint in human. Figure S2A corresponds to a full genome view and Figure S2B corresponds to Chromosome 16. Gibbon clones are represented by the blue arrows, taking into account the orientation of each BES. On the bottom of the window is a density plot of human SDs.
Found at doi:10.1371/journal.pgen.0020223.sg002 (493 KB PPT).
Figure S3. Interphase FISH Experiments to Show Duplications in
Gibbon
A sample of gibbon BAC clones overlapping human SDs was hybridized on NLE nuclei. The presence of duplications was revealed by the presence of either multiple signals or a single but broadened signal. The figure shows the results obtained with four clones also tested on HLA andS. syndactylus.
Found at doi:10.1371/journal.pgen.0020223.sg003 (122 KB JPG).
Protocol S1.
Found at doi:10.1371/journal.pgen.0020223.sd001 (41 KB DOC).
Table S1. Composition of Gibbon Sorted Chromosome Pools for
Array-Painting Experiments
The gibbon chromosomes were divided into four pools in order to minimize the number of array-painting experiments. A smart-pooling strategy was used, taking advantage of the data available in the literature. Through this approach the repetition of one human chromosome in the same pool was avoided. Additionally, three gibbon chromosomes were hybridized in individual experiments. Found at doi:10.1371/journal.pgen.0020223.st001 (45 KB DOC).
Table S2.Comparative Mapping of Gibbon Clones Spanning
Break-points on Rhesus Macaque and Chimpanzee Genome Assemblies The table reports the outcome of the mapping of gibbon clones spanning BOSRs on the latest genome assembly of Rhesus macaque (reMach2) and chimpanzee (panTro1). Depending on the result, clones were classified into three evolutionary groups: 1) gibbon specific, 2) great ape specific, and 3) human specific.
Mapping results not consistent with human are in italics. Found at doi:10.1371/journal.pgen.0020223.st002 (134 KB DOC).
Accession numbers
The National Center for Biotechnology Information (NCBI) Entrez Gene (http://www.ncbi.nlm.nih.gov/entrez/query.fcgi?db¼gene) acces-sion numbers for the genes discussed in this paper are CASP1
(NM_033294), CASP4(837), CASP5(838),GH2(2689), KRTAP5–10
(387273), KRTAP5–11 (440051), KRTAP5–7 (440050), KRTAP5–8
(57830),KRTAP5–9(3846),MRC1(4360),OR11L1(391189),OR13G1
(441933), OR1C1 (26188),OR2G2 (81470), OR2G3 (81469),OR5AT1
(284532), andOR6F1(343169).
Acknowledgments
We are extremely grateful to Dr. Ulli Weier and his group at Lawrence Berkeley National Laboratory for making their facilities available to us. We are also thankful to Dr. Yuko Yoshinaga for help in managing communications with the sequencing agency for the gibbon BAC end sequencing. We finally thank BACPAC Resources for their help with the production of the rearrayed filters employed in the secondary screenings.
Author contributions. LC and PJdJ conceived and designed the
experiments. LC, AK, and JW performed the experiments. GMV, CS, RAH, and AM analyzed the data. BFHtH, BZ, KO, AM, JW, JR, and SH contributed reagents/materials/analysis tools. LC, GMV, and PJdJ wrote the paper.
Funding.Construction and characterization of CHORI-271 gibbon
BAC library was supported by a National Institutes of Health grant (HG02523–02) to PJdJ.
Competing interests.The authors have declared that no competing
interests exist.
References
1. Wienberg J (2004) The evolution of eutherian chromosomes. Curr Opin Genet Dev 14: 657–666.
2. Gregory SG, Sekhon M, Schein J, Zhao S, Osoegawa K, et al. (2002) A physical map of the mouse genome. Nature 418: 743–750.
3. Nadeau JH, Taylor BA (1984) Lengths of chromosomal segments conserved since divergence of man and mouse. Proc Natl Acad Sci U S A 81: 814–818. 4. Lindblad-Toh K, Wade CM, Mikkelsen TS, Karlsson EK, Jaffe DB, et al. (2005) Genome sequence, comparative analysis and haplotype structure of the domestic dog. Nature 438: 803–819.
5. Zhao S, Shetty J, Hou L, Delcher A, Zhu B, et al. (2004) Human, mouse, and rat genome large-scale rearrangements: stability versus speciation. Genome Res 14: 1851–1860.
6. Dutrillaux B, Rethore MO, Aurias A, Goustard M (1975) [Karyotype analysis of 2 species ofgibbons (Hylobates lar and H. concolor)with different banding species]. Cytogenet Cell Genet 15: 81–91.
7. Koehler U, Bigoni F, Wienberg J, Stanyon R (1995) Genomic reorganization in the concolor gibbon (Hylobates concolor) revealed by chromosome painting. Genomics 30: 287–292.
8. Mrasek K, Heller A, Rubtsov N, Trifonov V, Starke H, et al. (2003) Detailed
Hylobates larkaryotype defined by 25-color FISH and multicolor banding. Int J Mol Med 12: 139–146.
9. Armengol L, Pujana MA, Cheung J, Scherer SW, Estivill X (2003) Enrichment of segmental duplications in regions of breaks of synteny between the human and mouse genomes suggest their involvement in evolutionary rearrangements. Hum Mol Genet 12: 2201–2208.
10. Ventura M, Mudge JM, Palumbo V, Burn S, Blennow E, et al. (2003) Neocentromeres in 15q24–26 map to duplicons which flanked an ancestral centromere in 15q25. Genome Res 13: 2059–2068.
11. Bailey JA, Baertsch R, Kent WJ, Haussler D, Eichler EE (2004) Hotspots of mammalian chromosomal evolution. Genome Biol 5: R23.
12. Newman TL, Tuzun E, Morrison VA, Hayden KE, Ventura M, et al. (2005) A genome-wide survey of structural variation between human and chimpan-zee. Genome Res 15: 1344–1356.
13. Murphy WJ, Larkin DM, Everts-van der Wind A, Bourque G, Tesler G, et al. (2005) Dynamics of mammalian chromosome evolution inferred from multispecies comparative maps. Science 309: 613–617.
14. Goidts V, Szamalek JM, Hameister H, Kehrer-Sawatzki H (2004) Segmental duplication associated with the human-specific inversion of chromosome 18: A further example of the impact of segmental duplications on karyotype and genome evolution in primates. Hum Genet 115: 116–122. 15. Stankiewicz P, Park SS, Inoue K, Lupski JR (2001) The evolutionary
chromosome translocation 4;19 inGorilla gorilla is associated with micro-duplication of the chromosome fragment syntenic to sequences surround-ing the human proximal CMT1A-REP. Genome Res 11: 1205–1210. 16. Locke DP, Archidiacono N, Misceo D, Cardone MF, Deschamps S, et al.
(2003) Refinement of a chimpanzee pericentric inversion breakpoint to a segmental duplication cluster. Genome Biol 4: R50.
17. Eder V, Ventura M, Ianigro M, Teti M, Rocchi M, et al. (2003) Chromosome 6 phylogeny in primates and centromere repositioning. Mol Biol Evol 20: 1506–1512.
18. Casals F, Caceres M, Ruiz A (2003) The foldback-like transposon Galileo is involved in the generation of two different natural chromosomal inversions ofDrosophila buzzatii. Mol Biol Evol 20: 674–685.
19. Lim JK, Simmons MJ (1994) Gross chromosome rearrangements mediated by transposable elements inDrosophila melanogaster. Bioessays 16: 269–275. 20. Lee JW, Kim HS (2006) Endogenous retrovirus HERV-I LTR family in
primates: Sequences, phylogeny, and evolution. Arch Virol 151: 1651–1658. 21. Kehrer-Sawatzki H, Schreiner B, Tanzer S, Platzer M, Mu¨ller S, et al. (2002) Molecular characterization of the pericentric inversion that causes differ-ences between chimpanzee chromosome 19 and human chromosome 17. Am J Hum Genet 71: 375–388.
22. Van Tuinen P, Ledbetter DH (1983) Cytogenetic comparison and phylogeny of three species of Hylobatidae. Am J Phys Anthropol 61: 453– 466.
23. Stanyon R, Sineo L, Chiarelli B, Camperio-Ciani A, Mootnick AR, et al. (1987) Banded karyotypes of the 44-chromosomes gibbons. Folia Primatol 48: 56–64.
24. Prouty LA, Buchanan PD, Pollitzer WS, Mootnick AR (1983) A presumptive new hylobatid subgenus with 38 chromosomes. Cytogenet Cell Genet 35: 141–142.
25. Jauch A, Wienberg J, Stanyon R, Arnold N, Tofanelli S, et al. (1992) Reconstruction of genomic rearrangements in great apes and gibbons by chromosome painting. Proc Natl Acad Sci U S A 89: 8611–8615. 26. Koehler U, Arnold N, Wienberg J, Tofanelli S, Stanyon R (1995) Genomic
reorganization and disrupted chromosomal synteny in the siamang (Hylobates syndactylus) revealed by fluorescence in situ hybridization. Am J Phys Anthropol 97: 37–47.
27. Yu D, Yang F, Liu R (1997) [A comparative chromosome map between human and Hylobates hoolock built by chromosome painting]. Yi Chuan Xue Bao 24: 417–423.
28. Nie W, Rens W, Wang J, Yang F (2001) Conserved chromosome segments in
Hylobates hoolock revealed by human and H. leucogenys paint probes. Cytogenet Cell Genet 92: 248–253.
29. Mu¨ller S, Hollatz M, Wienberg J (2003) Chromosomal phylogeny and evolution of gibbons (Hylobatidae). Hum Genet 113: 493–501.
30. Arnold N, Stanyon R, Jauch A, O’Brien P, Wienberg J (1996) Identification of complex chromosome rearrangements in the gibbon by fluorescent in situ hybridization (FISH) of a human chromosome 2q specific microlibrary, yeast artificial chromosomes, and reciprocal chromosome painting. Cytogenet Cell Genet 74: 80–85.
31. Mu¨ller S, O’Brien PC, Ferguson-Smith MA, Wienberg J (1998) Cross-species colour segmenting: A novel tool in human karyotype analysis. Cytometry 33: 445–452.
32. Gribble SM, Fiegler H, Burford DC, Prigmore E, Yang F, et al. (2004) Applications of combined DNA microarray and chromosome sorting technologies. Chromosome Res 12: 35–43.
33. Volik S, Zhao S, Chin K, Brebner JH, Herndon DR, et al. (2003) End-sequence profiling: Sequence-based analysis of aberrant genomes. Proc Natl Acad Sci U S A 100: 7696–7701.
34. Kent WJ (2002) BLAT—the BLAST-like alignment tool. Genome Res 12: 656–664.
35. Yue Y, Grossmann B, Ferguson-Smith M, Yang F, Haaf T (2005) Comparative cytogenetics of human chromosome 3q21.3 reveals a hot spot for ectopic recombination in hominoid evolution. Genomics 85: 36– 47.
36. Mu¨ller S, Finelli P, Neusser M, Wienberg J (2004) The evolutionary history of human chromosome 7. Genomics 84: 458–467.
37. Bailey JA, Gu Z, Clark RA, Reinert K, Samonte RV, et al. (2002) Recent segmental duplications in the human genome. Science 297: 1003–1007. 38. Kehrer-Sawatzki H, Sandig CA, Goidts V, Hameister H (2005) Breakpoint
analysis of the pericentric inversion between chimpanzee chromosome 10 and the homologous chromosome 12 in humans. Cytogenet Genome Res 108: 91–97.
39. Bailey JA, Yavor AM, Massa HF, Trask BJ, Eichler EE (2001) Segmental duplications: Organization and impact within the current human genome project assembly. Genome Res 11: 1005–1017.
40. Ye C, Li Y, Shi P, Zhang YP (2005) Molecular evolution of growth hormone gene family in old world monkeys and hominoids. Gene 350: 183–192. 41. Gotter AL, Shaikh TH, Budarf ML, Rhodes CH, Emanuel BS (2004) A
palindrome-mediated mechanism distinguishes translocations involving LCR-B of chromosome 22q11.2. Hum Mol Genet 13: 103–115.
42. Fauth C, Gribble SM, Porter KM, Codina-Pascual M, Ng BL, et al. (2006) Micro-array analyses decipher exceptional complex familial chromosomal rearrangement. Hum Genet 119: 145–153.
43. Kurahashi H, Inagaki H, Ohye T, Kogo H, Kato T, et al. (2006) Chromosomal translocations mediated by palindromic DNA. Cell Cycle 5: 1297–1303.
44. Coghlan A, Eichler EE, Oliver SG, Paterson AH, Stein L (2005) Chromosome evolution in eukaryotes: A multi-kingdom perspective. Trends Genet 21: 673–682.
45. Goidts V, Szamalek JM, Jong PJd, Cooper DN, Chuzhanova N, et al. (2005) Independent intra-chromosomal recombination events underlie the pericentric inversions of chimpanzee and gorilla chromosomes homolo-gous to human chromosome 16. Genome Res 15: 1232–1242.
46. Ishkanian AS, Malloff CA, Watson SK, DeLeeuw RJ, Chi B, et al. (2004) A tiling resolution DNA microarray with complete coverage of the human genome. Nat Genet 36: 299–303.
47. Krzywinski M, Bosdet I, Smailus D, Chiu R, Mathewson C, et al. (2004) A set of BAC clones spanning the human genome. Nucleic Acids Res 32: 3651– 3660.
48. Schro¨ck E, du Manoir S, Veldman T, Schoell B, Wienberg J, et al. (1996) Multicolor spectral karyotyping of human chromosomes. Science 273: 494– 497.
49. Telenius H, Carter NP, Bebb CE, Nordenskjold M, Ponder BA, et al. (1992) Degenerate oligonucleotide-primed PCR: General amplification of target DNA by a single degenerate primer. Genomics 13: 718–725.
50. Veltman JA, Schoenmakers EF, Eussen BH, Janssen I, Merkx G, et al. (2002) High-throughput analysis of subtelomeric chromosome rearrangements by use of array-based comparative genomic hybridization. Am J Hum Genet 70: 1269–1276.
51. Saal LH, Troein C, Vallon-Christersson J, Gruvberger S, Borg A, et al. (2002) BioArray Software Environment (BASE): A platform for comprehensive management and analysis of microarray data. Genome Biol 3: SOFT-WARE0003.
52. Lichter P, Ledbetter SA, Ledbetter DH, Ward DC (1990) Fluorescence in situ hybridization with Alu and L1 polymerase chain reaction probes for rapid characterization of human chromosomes in hybrid cell lines. Proc Natl Acad Sci U S A 87: 6634–6638.
53. McPherson JD, Marra M, Hillier L, Waterston RH, Chinwalla A, et al. (2001) A physical map of the human genome. Nature 409: 934–941.