More Accurate Prediction of Metastatic
Pancreatic Cancer Patients
’
Survival with
Prognostic Model Using Both Host Immunity
and Tumor Metabolic Activity
Younak Choi1¤, Do-Youn Oh1,2*, Hyunkyung Park1☯, Tae-Yong Kim1,2☯, Kyung-Hun Lee1,2☯, Sae-Won Han1,2☯, Seock-Ah Im1,2☯, Tae-You Kim1,2☯, Yung-Jue Bang1,2☯
1Department of Internal Medicine, Seoul National University Hospital, Seoul, Korea,2Cancer Research Institute, Seoul National University College of Medicine, Seoul, Korea
☯These authors contributed equally to this work.
¤ Current address: Department of Internal Medicine, Dongguk University Gyeongju Hospital,
Gyeongsangbuk-do, Korea *[email protected]
Abstract
Introduction
Neutrophil to lymphocyte ratio (NLR) and standard uptake value (SUV) by18F-FDG PET represent host immunity and tumor metabolic activity, respectively. We investigated NLR and maximum SUV (SUVmax) as prognostic markers in metastatic pancreatic cancer (MPC) patients who receive palliative chemotherapy.
Methods
We reviewed 396 MPC patients receiving palliative chemotherapy. NLR was obtained before and after the first cycle of chemotherapy. In 118 patients with PET prior to chemo-therapy, SUVmax was collected. Cut-off values were determined by ROC curve.
Results
In multivariate analysis of all patients, NLR and change in NLR after the first cycle of chemo-therapy (ΔNLR) were independent prognostic factors for overall survival (OS). We scored the risk considering NLR andΔNLR and identified 4 risk groups with different prognosis (risk score 0 vs 1 vs 2 vs 3: OS 9.7 vs 7.9 vs 5.7 vs 2.6 months, HR 1 vs 1.329 vs 2.137 vs 7.915, respectively;P<0.001). In PET cohort, NLR and SUVmax were independently prog-nostic for OS. Progprog-nostication model using both NLR and SUVmax could define 4 risk groups with different OS (risk score 0 vs 1 vs 2 vs 3: OS 11.8 vs 9.8 vs 7.2 vs 4.6 months, HR 1 vs 1.536 vs 2.958 vs 5.336, respectively;P<0.001).
a11111
OPEN ACCESS
Citation:Choi Y, Oh D-Y, Park H, Kim T-Y, Lee K-H, Han S-W, et al. (2016) More Accurate Prediction of Metastatic Pancreatic Cancer Patients’Survival with Prognostic Model Using Both Host Immunity and Tumor Metabolic Activity. PLoS ONE 11(1): e0145692. doi:10.1371/journal.pone.0145692
Editor:Yves St-Pierre, INRS, CANADA
Received:October 14, 2015
Accepted:December 7, 2015
Published:January 4, 2016
Copyright:© 2016 Choi et al. This is an open access article distributed under the terms of the Creative Commons Attribution License, which permits unrestricted use, distribution, and reproduction in any medium, provided the original author and source are credited.
Data Availability Statement:All relevant data are within the paper and its Supporting Information files.
Funding:The authors received no specific funding for this work.
Conclusions
NLR and SUVmax as simple parameters of host immunity and metabolic activity of tumor cell, respectively, are independent prognostic factors for OS in MPC patients undergoing palliative chemotherapy.
Introduction
According to the cancer statistics, pancreatic cancer (PC) is the fifth and fourth leading cause
of cancer-related deaths in men and women, respectively [1]. Although rapid progress in the
development of targeted therapies has improved overall cancer survival, the prognosis for
patients with PC remains disappointing [2].
From the early 21stcentury, accumulating evidence has revealed that systemic inflammatory
response affects tumor growth and metastasis [3,4]. With an increasing interest in cancer
immunity, the mechanisms of immune tolerance to cancer as well as those of anticancer
immune response were studied in preclinical animal models and in early clinical trials [5]. The
encouraging results of immune checkpoint inhibitors have accelerated the interest in cancer
immunity [6,7].
In recent years, emerging evidence shows that a high neutrophil to lymphocyte ratio (NLR)
can be a predictor of poor outcomes in various malignancies, such as colorectal cancer [8],
gas-tric cancer [9], renal cell carcinoma [10], breast cancer [11], and lung cancer [12]. There is also
evidence that normalization of NLR after a few cycles of chemotherapy can be used as an early
predictor of response to treatment [9,12], Evidence is accumulating for NLR as an easily
acces-sible tool of immune response and as a prognostic factor in patients with cancer. However, the role of NLR in pancreatic cancer has not been accumulated sufficiently.
Baseline tumor metabolism itself is also an important prognostic factor for cancer
out-comes. Although18F-fluorodeoxyglucose (FDG) uptake in positron emission tomography
(PET) was shown to quantify tumor metabolism [13], evidence for its usefulness as a
prognos-tic tool is limited in solid tumors including pancreaprognos-tic cancer.
In this study, we investigated the clinical implication of tumor immunity and tumor metab-olism in MPC patients as prognostic parameters. Tumor immunity was evaluated with NLR and change in NLR during chemotherapy, and tumor metabolism was evaluated using a
maxi-mum standard uptake value (SUVmax) in18F-FDG PET.
Materials and Methods
Study patients
We assessed all consecutive patients with histologically confirmed pancreatic adenocarcinoma, who received palliative chemotherapy at the Seoul National University Hospital between 2003 and 2012. Among the assessed patients, we included only MPC patients, excluding patients with locally advanced pancreatic cancer. We identified the prognostic value of NLR and change in NLR during chemotherapy in all patients and then analysed the prognostic meanings of
NLR and SUVmax in patients with18F-FDG PET imaging before palliative chemotherapy
Data collection
All relevant clinico-pathological data were retrieved from patient medical records. Laboratory data, including neutrophil and lymphocyte, were obtained within 1 week before the first and second cycle starting dates for first-line chemotherapy. The neutrophils refer to segmented neutrophils and band neutrophils, not including monocytes or myelocytes. The absolute neu-trophil count was calculated by the percentage of segmented neuneu-trophils out of the white blood cells. The NLR was determined by the absolute neutrophil count divided by the absolute
lym-phocyte count. Changes in NLR after one cycle of chemotherapy (ΔNLR) were obtained by
subtracting the initial value from the value obtained after one cycle of chemotherapy (cycle 1-cycle 0). Survival time was calculated from the date of diagnosis of MPC to the date of last follow-up or death.
Acquisition of18F-FDG PET imaging. PET was usually performed within 1 week prior to starting the first cycle of chemotherapy using integrated PET/CT scanners (Gemini, Philips, Cleveland, OH, USA; Biograph True or mCT40, Siemens, Hoffmann Estates, IL, USA). After
fasting for at least 8 hours,18F-FDG (5.18 MBq/kg) was injected, and images were acquired 1
hour later. PET scans were then obtained from the mid-thigh to the skull base, and images were reconstructed using the ordered subset expectation maximum iterative reconstruction algorithm. The SUV was calculated as tissue concentration of radioactivity (kBq/mL) divided by injected dose per weight (kBq/g). To measure the SUVmax of the circular region of interest (ROI), which was defined as the peak SUV in the pixel with the highest count within the ROI, and SUVmax was automatically measured using an analysis software package (Syngo.via, Siemens).
Statistical analysis
We used the receiver operating characteristic (ROC) curve to determine the best cut-off values for overall survival (OS) with NLR and SUVmax. To compare the between-group differences in demographic and clinical data, continuous variables were converted to categorical variables
and examined using the Fisher’s exact test. Median values and mean values of the two groups
were compared by logistic regression and independent t-test, respectively. The relationships
between continuous variables were assessed by Pearson’s correlation coefficients and
Spear-man’srho. The median OS was determined using the Kaplan-Meier method. We performed a
univariate analysis and then a multivariate analysis using Cox proportional hazard model with forward stepwise selection to evaluate the influence of multiple parameters on survival. Hazard ratios (HR) were reported as relative risk with corresponding 95% confidence intervals (CI). All statistical analyses were performed using the SPSS version 19.0 (IBM Corp. Armonk, NY,
USA), and a two-sidedP<0.05 was considered statistically significant.
Ethics. This study was reviewed and approved by the Institutional Review Board of the Seoul National University Hospital (IRB No: H-1307-146-507). All aspects of the study were conducted according to ethical guidelines (Declaration of Helsinki) for biomedical research. Because our study was done with retrospective method, we anonymized patient records/infor-mation to be de-identified prior to analysis instead of receiving informed consent from partici-pants for their clinical records to be used in this study.
Results
Baseline characteristics
Our study included 396 patients with MPC (Table 1). The median age of all patients was 61 years
including 66 patients (16.7%) with gemcitabine monotherapy, 306 patients (77.3%) with gem-citabine-based doublets, and 24 patients (6.0%) of gemgem-citabine-based triplets. The remained
16 patients received fluoropyrimidine-based chemotherapy (S1 Table). After the first cycle of
chemotherapy, NLR was changed from 2.6 to 1.9 and lymphocyte count, 1522 to 1572,
respec-tively. The cut-off values were as follows: NLR, 2.5 and 4.5 (S1A Fig);ΔNLR, 0 (S1B Fig); and
lymphocyte count, 2000. The median OS of all patients was 7.2 months (95% CI, 6.6–7.8
months).
Analysis of all patients: prognostic value of NLR (N = 396)
Univariate analysis of OS identified Eastern Cooperative Group (ECOG) performance status
(PS)2 (P<0.001), elevated carbohydrate antigen 19–9 (CA19-9) (P<0.001), decreased
albu-min (P =0.006), elevated alkaline phosphatase (ALP) (P =0.002), elevated NLR (P<0.001),
ΔNLR0 (P =0.049), and lymphocyte count<2000 (P =0.004) as significant factors.
Multi-variate analysis revealed an increased risk of death in proportion to increases in NLR (NLR
<2.5: HR 1; NLR 2.5–4.4: HR 1.659,P<0.001; NLR4.5: HR 2.926,P<0.001).ΔNLR0
(HR 1.510;P<0.001), ECOG PS2 (HR 1.406;P =0.011) and elevated CA19-9 (HR 1.493;
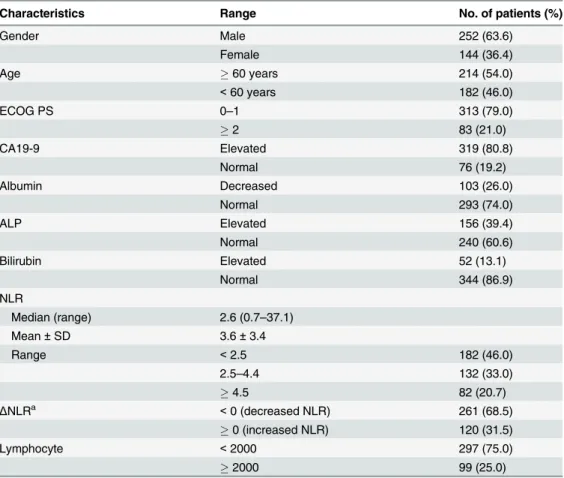
Table 1. Baseline characteristics (N = 396).
Characteristics Range No. of patients (%)
Gender Male 252 (63.6)
Female 144 (36.4)
Age 60 years 214 (54.0)
<60 years 182 (46.0)
ECOG PS 0–1 313 (79.0)
2 83 (21.0)
CA19-9 Elevated 319 (80.8)
Normal 76 (19.2)
Albumin Decreased 103 (26.0)
Normal 293 (74.0)
ALP Elevated 156 (39.4)
Normal 240 (60.6)
Bilirubin Elevated 52 (13.1)
Normal 344 (86.9)
NLR
Median (range) 2.6 (0.7–37.1)
Mean±SD 3.6±3.4
Range <2.5 182 (46.0)
2.5–4.4 132 (33.0)
4.5 82 (20.7)
ΔNLRa <0 (decreased NLR) 261 (68.5)
0 (increased NLR) 120 (31.5)
Lymphocyte <2000 297 (75.0)
2000 99 (25.0)
ALP, alkaline phosphatase; CA19-9, carbohydrate antigen 19–9; ECOG PS, Eastern Cooperative Oncology Group Performance Status; NLR, neutrophil to lymphocyte ratio; SD, standard deviation. a
(NLR after one cycle of chemotherapy)—(initial NLR).
P =0.001) were also significant factors (Table 2). As NLR increased, median OS decreased
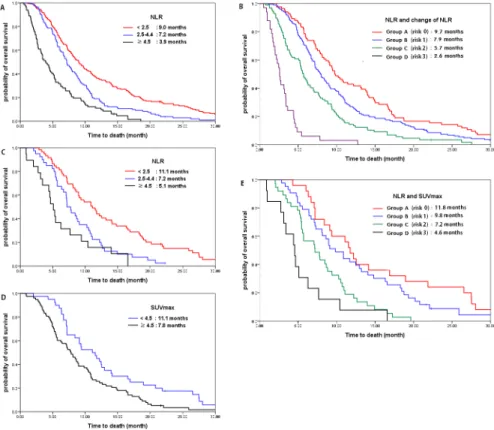
(NLR,<2.5 vs 2.5–4.4 vs4.5; median OS, 9.0 months vs 7.2 months vs 3.9 months;Fig 1a).
We made the risk scoring system considering both NLR (score 0, NLR<2.5; score 1, 2.5
NLR<4.5; score 2, NLR4.5) andΔNLR (score 0:ΔNLR<0; score 1:ΔNLR0). By adding 2
risk scores from NLR andΔNLR, 4 risk groups were identified as follows: group A (risk score
0); group B (risk score 1); group C (risk score 2); group D (risk score 3) (Table 3,Fig 1b).
Multi-variate analysis showed a gradual increased risk for death with increasing risk scores (group A vs B vs C vs D: 9.7 vs 7.9 vs 5.7 vs 2.6 months; HR 1 vs 1.329 vs 2.137 vs 7.915, respectively;
P<0.001), CA19-9 (HR 1.494;P<0.001) and ECOG PS (HR 1.420;P= 0.007).
Analysis of the patients in the PET cohort (N = 118)
Among 118 patients in18F-FDG PET cohort, the median OS was 8.6 months (95% CI, 7.4–9.8
months). In this cohort, we obtained a cut-off value of SUVmax of 4.5 through ROC curve to
discriminate OS (S2 Fig). There was no correlation between NLR and SUVmax (Pearsonr=
-0.019,P= 0.837;S3 Fig) nor any significant difference in the distribution of NLR between
high (SUVmax4.5) and low (SUVmax<4.5) metabolism groups (P =0.105) (Table 4).
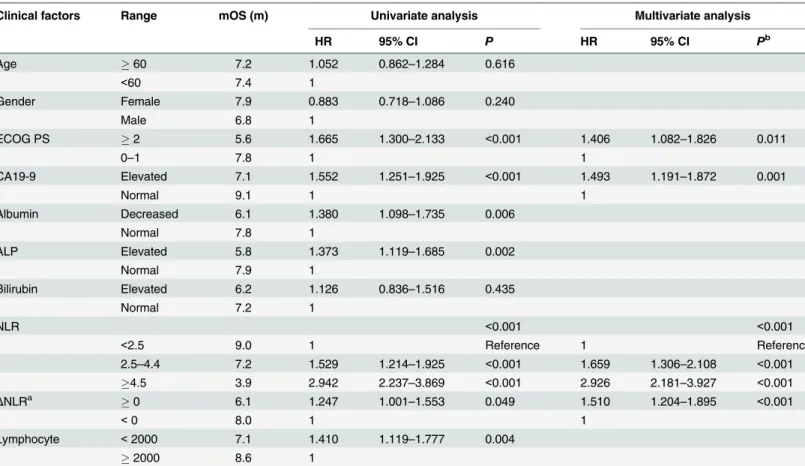
Table 2. Analysis of factors prognostic for overall survival (N = 396).
Clinical factors Range mOS (m) Univariate analysis Multivariate analysis
HR 95% CI P HR 95% CI Pb
Age 60 7.2 1.052 0.862–1.284 0.616
<60 7.4 1
Gender Female 7.9 0.883 0.718–1.086 0.240
Male 6.8 1
ECOG PS 2 5.6 1.665 1.300–2.133 <0.001 1.406 1.082–1.826 0.011
0–1 7.8 1 1
CA19-9 Elevated 7.1 1.552 1.251–1.925 <0.001 1.493 1.191–1.872 0.001
Normal 9.1 1 1
Albumin Decreased 6.1 1.380 1.098–1.735 0.006
Normal 7.8 1
ALP Elevated 5.8 1.373 1.119–1.685 0.002
Normal 7.9 1
Bilirubin Elevated 6.2 1.126 0.836–1.516 0.435
Normal 7.2 1
NLR <0.001 <0.001
<2.5 9.0 1 Reference 1 Referenc
2.5–4.4 7.2 1.529 1.214–1.925 <0.001 1.659 1.306–2.108 <0.001
4.5 3.9 2.942 2.237–3.869 <0.001 2.926 2.181–3.927 <0.001
ΔNLRa 0 6.1 1.247 1.001
–1.553 0.049 1.510 1.204–1.895 <0.001
<0 8.0 1 1
Lymphocyte <2000 7.1 1.410 1.119–1.777 0.004
2000 8.6 1
ALP, alkaline phosphatase; CA19-9, carbohydrate antigen 19–9; CI, confidential; ECOG PS, Eastern Cooperative Oncology Group Performance Status; HR, hazard ratio; mOS, median overall survival; NLR, neutrophil to lymphocyte ratio.
a
(NLR after one cycle of chemotherapy)—(initial NLR). b
Pvalues were calculated using the Multivariate Cox hazard model adjusted with age, gender, ECOG PS, CA19-9, albumin, ALP, bilirubin, NLR,ΔNLR and lymphocyte by forward stepwise selection.
Fig 1. Relationship of NLR and SUVmax with overall survival.(a) Overall survival according to NLR in all patients (N = 396): NLR<2.5: reference; NLR 2.5–4.4: HR 1.659, P<0.001; NLR4.5: HR 2.926 (P<0.001). (b) Overall survival according to the risk scores of whole patients (N = 396): Group A (score 0), group B (score 1), group C (score 2), group D (score 3). Total risk score of patients were calculated by addition of each score of NLR (score 0, NLR<2.5; score 1, 2.5NLR<4.5; score 2, NLR4.5) andΔNLR (score 0:ΔNLR<0; score 1:ΔNLR0). (c) Overall survival according to NLR in PET cohort (N = 118): NLR<2.5: reference; NLR 2.5–
4.4: HR 2.113, P = 0.002; NLR4.5: HR 3.500, P<0.001. (d) Overall survival according to SUVmax in PET
cohort (N = 118): SUVmax<4.5: reference; SUVmax4.5: HR 1.845, P = 0.004. (e) Overall survival according to risk scores with NLR and SUVmax in PET cohort (N = 118): Group A (score 0), group B (score 1), group C (score 2), group D (score 3). Total risk score of patients were calculated by addition of each score of NLR (score 0, NLR<2.5; score 1, 2.5NLR<4.5; score 2, NLR4.5) and SUVmax (score 0: SUVmax
<4.5; score 1: SUVmax4.5).
doi:10.1371/journal.pone.0145692.g001
Table 3. Risk groups based on NLR andΔNLRa.
Clinical factors N mOS (m) HR 95% CI Pb
Risk group Risk score <0.001
A 0 NLR<2.5 &ΔNLR<0 83 9.7 1 reference
B 1 NLR<2.5 &ΔNLR0 or 2.5NLR<4.5 &ΔNLR<0 182 7.9 1.329 1.017–1.736 0.037 C 2 2.5NLR<4.5&ΔNLR0 or NLR4.5 &ΔNLR<0 96 5.7 2.137 1.571–2.906 <0.001
D 3 NLR4.5 &ΔNLR0 33 2.6 7.915 5.033–12.445 <0.001
CI, confidence interval; HR, hazard ratio; mOS, median overall survival; NLR, neutrophil to lymphocyte ratio. a
(NLR after one cycle of chemotherapy)—(initial NLR). bP
values were calculated using the Multivariate Cox hazard model adjusted with age, gender, ECOG PS, CA19-9, albumin, ALP, bilirubin, and lymphocyte by forward stepwise selection.
Multivariate analysis for OS also revealed an increased risk for OS in proportion to NLR
(NLR<2.5: 11.1 months, HR 1; NLR 2.5–4.4: 7.2 months, HR 2.113,P =0.002; NLR4.5: 5.1
months, HR 3.500,P<0.001;Fig 1c). Patients with high metabolism showed shorter survival
than patients with low metabolism (SUVmax<4.5: 11.1 months, HR 1 vs SUVmax4.5: 7.8
months, HR 1.845,P =0.004;Fig 1d) (Table 5).
We made the risk scoring system considering both NLR (score 0, NLR<2.5; score 1, 2.5
NLR<4.5; score 2, NLR4.5) and SUVmax (score 0: SUVmax<4.5; score 1: SUVmax4.5).
Table 4. Comparison of immune markers between high and low metabolism groups.
Low metabolism SUVmax<4.5, N = 40 High metabolism SUVmax4.5, N = 78 Total, N = 118 P
NLR
Median (range) 2.2 (1.2–19.5) 2.8 (0.8–19.0) 2.5 (0.8–19.5) 0.604c
Mean±SD 3.3±3.5 3.7±3.2 3.5±3.3 0.874d
Range
<2.5 25 (62.5%) 34 (43.6%) 59 (50.0%) 0.105b
2.5–4.4 9 (22.5%) 31 (39.7%) 40 (33.9%)
4.5 6 (15.0%) 13 (16.7%) 19 (16.1%)
Difference of NLRa( ΔNLR)
<0 22 (56.4%) 50 (68.5%) 72 (64.3%) 0.220b
0 17 (43.6%) 23 (31.5%) 40 (35.7%)
Lymphocyte
<2000 32 (80.0%) 57 (73.1%) 89 (75.4%) 0.501b
2000 8 (20.0%) 21 (26.9%) 29 (24.6%)
NLR, neutrophil to lymphocyte ratio; SUVmax, maximum standard uptake value. a
(NLR after one cycle of chemotherapy)—(initial NLR) bPvalues were calculated using the Fisher
’s exact test cPvalues were calculated using the Logistic regression dP
values were calculated using the Independent t-test
doi:10.1371/journal.pone.0145692.t004
Table 5. Analysis of prognostic factors for overall survival in PET cohort (N = 118).
Clinical factors Range mOS (m) Univariate analysis Multivariate analysis
HR 95% CI P HR 95% CI Pa
NLR 0.001 <0.001
<2.5 11.1 1 Reference 1 Reference
2.5–4.4 7.2 1.892 1.234–2.902 0.003 2.113 1.330–3.357 0.002
4.5 5.1 3.117 1.810–5.366 <0.001 3.500 1.924–6.366 <0.001
ΔNLRb 0 7.2 1.145 0.770
–1.702 0.503 1.526 1.001–2.328 0.050
<0 9.1 1 1
SUVmax 4.5 7.8 1.773 1.186–2.651 0.005 1.845 1.209–2.814 0.004
<4.5 11.1 1 1
CI, confidence interval; HR, hazard ratio; mOS, median overall survival; NLR, neutrophil to lymphocyte ratio; PET, positron emission tomography; SUVmax, maximum standard uptake value.
a
Pvalues were calculated using the Multivariate Cox hazard model adjusted with age, gender, ECOG PS, CA19-9, albumin, ALP, bilirubin, NLR,ΔNLR, lymphocyte, and SUVmax by forward stepwise selection.
b
(NLR after one cycle of chemotherapy)—(initial NLR).
Using this scoring system, 4 risk groups were identified as follows: group A (risk score 0); group B (risk score 1); group C (risk score 2); group D (risk score 3). Multivariate analysis showed a gradual increased risk for death as risk scores increased (group A vs B vs C vs D:
11.8 vs 9.8 vs 7.2 vs 4.6 months; HR 1 vs 1.536 vs 2.958 vs 5.336, respectively;P<0.001;Table 6;
Fig 1e).
Discussion
In this study, we demonstrated the usefulness of pre-chemotherapy NLR and change of NLR
after the first cycle of chemotherapy (ΔNLR) as outcome predictors for MPC patients
undergo-ing palliative chemotherapy. Our results are consistent with previous studies [14,15]. The new
finding in our study was that by scoring system encountered both NLR andΔNLR, we could
identify 4 risk groups of patients with significantly different prognoses (Table 3;Fig 1b).
Cancer-related chronic inflammation promotes angiogenesis and cell proliferation, protects tumors from apoptosis and contributes to metastasis and regional lymph node invasion. This process was known to be initiated with various chemokines that tumor cells secrete and pro-moted by pro-inflammatory cells, which infiltrate into the tumor microenvironment and make it favorable for cancer progression by the secretion of inflammatory mediators, such as
inter-leukins, tumor necrosis factor-α(TNF-α) and vascular endothelial growth factor (VEGF) [4,
16,17].
Several recent studies have provided a potential mechanism for increased metastasis in the presence of neutrophilia. The circulating neutrophils could act as a surrogate for the number of tumor-associated neutrophils (TANs), which act as adhesive adapters between circulating
tumor cells and the metastatic target [18] and which play an important role in tumor
angiogen-esis and growth by secreting VEGF and matrix metalloproteinase 9 [19,20].
Lymphocytes play a substantial role in cell-mediated immunity against tumor cells. CD8 + T-cells are responsible for suppressing tumor growth by inducing cytotoxic T-cell killing, whereas CD4+ T-cells are essential to antitumor immune response. An elevated level of tumor-infiltrating lymphocytes (TILs) is associated with improved outcomes in a variety of cancers
[21]. On the other hand, memory T-cells are considered to have a crucial role in carcinogenesis
[22]. As a result, lymphopenia is controversial as a poor prognostic factor [23], and its
signifi-cance was not confirmed in our study.
The most intriguing finding of our study is that host immune response and metabolic activ-ity of the tumor cell itself are independent predictors for outcomes in MPC patients who received palliative chemotherapy. The NLR as a marker of immunity did not correlate with
SUVmax as a marker of tumor metabolism (Table 4,S4 Fig). Therefore, we made scoring
Table 6. Prognostic value of NLR and SUVmax.
Clinical factors N mOS (m) HR 95% CI Pa
Risk group Risk score <0.001
A 0 NLR<2.5 &SUVmax<4.5 25 11.8 1 reference
B 1 NLR<2.5 &SUVmax4.5 or 2.5NLR<4.5 &SUVmax<4.5 43 9.8 1.536 0.896–2.630 0.118
C 2 2.5NLR<4.5 &SUVmax4.5 or NLR4.5 &SUVmax<4.5 37 7.2 2.958 1.658–5.279 <0.001
D 3 NLR4.5 &SUVmax4.5 13 4.6 5.336 2.484–11.461 <0.001
CI, confidence interval; HR, hazard ratio; mOS, median overall survival; NLR, neutrophil to lymphocyte ratio; SUVmax, maximum standard uptake value. a
Pvalues were calculated using the Multivariate Cox hazard model adjusted with age, gender, ECOG PS, CA19-9, albumin, ALP, bilirubin,ΔNLR, and lymphocyte by forward stepwise selection.
system consisting of both NLR and SUVmax, which could divide four patient groups with
dif-ferent prognoses (Table 6;Fig 1e). We demonstrated that patients with low NLR and low
SUV-max (risk score 0) had longest OS (11.8 months). As the risk score increased to 1, 2 and 3, patient survival was reduced linearly to 0.83 times, 0.61 times and 0.38 times the risk of group
A (Spearmanrho-1.000;S4 Fig). We could establish the prognostic model to more accurately
predict patient survival using simple parameters of both host immunity and tumor metabolic activity.
18F-FDG PET has already been considered as a predictor of treatment response through
more rapid changes in metabolic activity compared to tumor size [24]. The degree of18F-FDG
uptake can be semiquantified by SUV, which is an easily measurable and reliable indicator of
tumor metabolic activity [25]. However, even though PET was approved to predict final
treat-ment outcomes in lymphoma [26], there remains limited evidence for other malignancies.
SUV in PET also could be increased by pancreatitis or peritumoral inflammation, not only by tumor metabolic activity. Recent effort is just limited in methodologic aspect of SUV, not tumor specificity. To obtain a more accurate reflection of the metabolic tumor burden, new PET-based volumetric imaging parameters such as metabolic tumor volume (MTV) and the
total lesion glycolysis (TLG) are being attempted for use in various malignancies [27].
Our current study has the limitation of a retrospective approach and needs to be further val-idated through a prospective study.
In conclusion, pre-treatment NLR and change in NLR after the first cycle of chemotherapy
(ΔNLR) could provide predictive information regarding the prognosis of patients with MPC
who receive palliative chemotherapy. Furthermore, patient immunity was not correlated with the metabolism of cancer cells themselves. Therefore, consideration of both NLR and SUVmax could provide a more accurate prognosis for patients with MPC. After additional validation studies with a larger cohort, we could potentially apply this easily accessible prognostic model in early decision-making in a clinical setting.
Supporting Information
S1 Fig. ROC curve of NLR (A) and of difference of NLR (B). (TIF)
S2 Fig. ROC curve of SUVmax. (TIF)
S3 Fig. Correlation between NLR and SUVmax. (TIF)
S4 Fig. Linear proportionality of survival to risk score. (TIF)
S1 Table. First line chemotherapy (N = 396). (DOC)
Author Contributions
References
1. Siegel RL, Miller KD, Jemal A. Cancer statistics, 2015. (2015) CA Cancer J Clin. 65:5–29. doi:10. 3322/caac.21254PMID:25559415
2. Raimondi S, Maisonneuve P, Lowenfels AB. Epidemiology of pancreatic cancer: an overview. (2009) Nat Rev Gastroenterol Hepatol. 6:699–708. doi:10.1038/nrgastro.2009.177PMID:19806144 3. Balkwill F, Mantovani A. Inflammation and cancer: back to Virchow? (2001) Lancet. 357:539–545.
PMID:11229684
4. Allavena P, Sica A, Solinas G, Porta C, Mantovani A. The inflammatory micro-environment in tumor progression: the role of tumor-associated macrophages. (2008) Crit Rev Oncol Hematol. 66:1–9. PMID:17913510
5. Topalian SL, Weiner GJ, Pardoll DM. Cancer immunotherapy comes of age. (2011) J Clin Oncol. 29:4828–4836. doi:10.1200/JCO.2011.38.0899PMID:22042955
6. Hodi FS, O'Day SJ, McDermott DF, Weber RW, Sosman JA, Haanen JB, et al. (2010) Improved sur-vival with ipilimumab in patients with metastatic melanoma. N Engl J Med. 363:711–723. doi:10.1056/ NEJMoa1003466PMID:20525992
7. Topalian SL, Hodi FS, Brahmer JR, Gettinger SN, Smith DC, McDermott DF, et al. Safety, activity, and immune correlates of anti-PD-1 antibody in cancer. (2012) N Engl J Med. 366:2443–2454. doi:10. 1056/NEJMoa1200690PMID:22658127
8. Chua W, Charles KA, Baracos VE, Clarke SJ. Neutrophil/lymphocyte ratio predicts chemotherapy out-comes in patients with advanced colorectal cancer. (2011) Br J Cancer. 104:1288–1295. doi:10.1038/ bjc.2011.100PMID:21448173
9. Cho IR, Park JC, Park CH, Jo JH, Lee HJ, Kim S, et al. Pre-treatment neutrophil to lymphocyte ratio as a prognostic marker to predict chemotherapeutic response and survival outcomes in metastatic advanced gastric cancer. (2014) Gastric Cancer. 17:703–710. doi:10.1007/s10120-013-0330-2PMID: 24442663
10. Pichler M, Hutterer GC, Stoeckigt C, Chromecki TF, Stojakovic T, Golbeck S, et al. Validation of the pre-treatment neutrophil-lymphocyte ratio as a prognostic factor in a large European cohort of renal cell carcinoma patients. (2013) Br J Cancer. 108:901–907. doi:10.1038/bjc.2013.28PMID:23385728 11. Azab B, Bhatt VR, Phookan J, Murukutla S, Kohn N, Terjanian T, et al. Usefulness of the
neutrophil-to-lymphocyte ratio in predicting short- and long-term mortality in breast cancer patients. (2012) Ann Surg Oncol. 19:217–224. doi:10.1245/s10434-011-1814-0PMID:21638095
12. Yao Y, Yuan D, Liu H, Gu X, Song Y. Pretreatment neutrophil to lymphocyte ratio is associated with response to therapy and prognosis of advanced non-small cell lung cancer patients treated with first-line platinum-based chemotherapy. (2013) Cancer Immunol Immunother. 62:471–479. doi:10.1007/ s00262-012-1347-9PMID:22986452
13. Hawkins RA, Choi Y, Huang SC, Messa C, Hoh CK, Phelps ME. Quantitating tumor glucose metabo-lism with FDG and PET. (1992) J Nucl Med. 33:339–344. PMID:1740699
14. Stotz M, Gerger A, Eisner F, Szkandera J, Loibner H, Ress AL, et al. Increased neutrophil-lymphocyte ratio is a poor prognostic factor in patients with primary operable and inoperable pancreatic cancer. (2013) Br J Cancer. 109:416–421. doi:10.1038/bjc.2013.332PMID:23799847
15. Luo G, Guo M, Liu Z, Xiao Z, Jin K, Long J, et al. Blood neutrophil-lymphocyte ratio predicts survival in patients with advanced pancreatic cancer treated with chemotherapy. (2015) Ann Surg Oncol. 22:670–
676. doi:10.1245/s10434-014-4021-yPMID:25155401
16. Mantovani A, Allavena P, Sica A, Balkwill F. Cancer-related inflammation. (2008) Nature. 454:436–
444. doi:10.1038/nature07205PMID:18650914
17. McColl SR, Paquin R, Menard C, Beaulieu AD. Human neutrophils produce high levels of the interleu-kin 1 receptor antagonist in response to granulocyte/macrophage colony-stimulating factor and tumor necrosis factor alpha. (1992) J Exp Med. 176:593–598. PMID:1386877
18. Spicer JD, McDonald B, Cools-Lartigue JJ, Chow SC, Giannias B, Kubes P, et al. Neutrophils promote liver metastasis via Mac-1-mediated interactions with circulating tumor cells. (2012) Cancer Res. 72:3919–3927. doi:10.1158/0008-5472.CAN-11-2393PMID:22751466
19. Fridlender ZG, Sun J, Kim S, Kapoor V, Cheng G, Ling L, et al. Polarization of tumor-associated neutro-phil phenotype by TGF-beta: "N1" versus "N2" TAN. (2009) Cancer Cell. 16:183–194. doi:10.1016/j. ccr.2009.06.017PMID:19732719
21. Azimi F, Scolyer RA, Rumcheva P, Moncrieff M, Murali R, McCarthy SW, et al. Tumor-infiltrating lym-phocyte grade is an independent predictor of sentinel lymph node status and survival in patients with cutaneous melanoma. (2012) J Clin Oncol. 30:2678–2683. doi:10.1200/JCO.2011.37.8539PMID: 22711850
22. Ino Y, Yamazaki-Itoh R, Shimada K, Iwasaki M, Kosuge T, Kanai Y, et al. Immune cell infiltration as an indicator of the immune microenvironment of pancreatic cancer. (2013) Br J Cancer. 108:914–923. doi:10.1038/bjc.2013.32PMID:23385730
23. Ray-Coquard I, Cropet C, Van Glabbeke M, Sebban C, Le Cesne A, Judson I, et al. Lymphopenia as a prognostic factor for overall survival in advanced carcinomas, sarcomas, and lymphomas. (2009) Can-cer Res. 69:5383–5391. doi:10.1158/0008-5472.CAN-08-3845PMID:19549917
24. Minn H, Paul R, Ahonen A. Evaluation of treatment response to radiotherapy in head and neck cancer with fluorine-18 fluorodeoxyglucose. (1988) J Nucl Med. 29:1521–1525. PMID:3137316
25. Zasadny KR, Wahl RL. Standardized uptake values of normal tissues at PET with 2-[fluorine-18]-fluoro-2-deoxy-D-glucose: variations with body weight and a method for correction. (1993) Radiology. 189:847–850. PMID:8234714
26. Fletcher JW, Djulbegovic B, Soares HP, Siegel BA, Lowe VJ, Lyman GH, et al. Recommendations on the use of 18F-FDG PET in oncology. (2008) J Nucl Med. 49:480–508. doi:10.2967/jnumed.107. 047787PMID:18287273