ACPD
11, 24671–24725, 2011Bulk microphysical properties of semi transparent cirrus
from AIRS
A. Guignard et al.
Title Page
Abstract Introduction
Conclusions References
Tables Figures
◭ ◮
◭ ◮
Back Close
Full Screen / Esc
Printer-friendly Version Interactive Discussion
Discussion
P
a
per
|
Dis
cussion
P
a
per
|
Discussion
P
a
per
|
Discussio
n
P
a
per
|
Atmos. Chem. Phys. Discuss., 11, 24671–24725, 2011 www.atmos-chem-phys-discuss.net/11/24671/2011/ doi:10.5194/acpd-11-24671-2011
© Author(s) 2011. CC Attribution 3.0 License.
Atmospheric Chemistry and Physics Discussions
This discussion paper is/has been under review for the journal Atmospheric Chemistry and Physics (ACP). Please refer to the corresponding final paper in ACP if available.
Bulk microphysical properties of semi
transparent cirrus from AIRS: a six years
global climatology and statistical analysis
in synergy with CALIPSO and CloudSat
A. Guignard1, C. J. Stubenrauch1, A. J. Baran2, and R. Armante1
1
Laboratoire de M ´et ´eorologie Dynamique, Ecole Polytechnique, UMR8539, Palaiseau, France 2
Met Office, Fitzroy Road, Exeter, EX1 3PB, UK
Received: 30 July 2011 – Accepted: 9 August 2011 – Published: 1 September 2011
Correspondence to: A. Guignard ([email protected])
Published by Copernicus Publications on behalf of the European Geosciences Union.
ACPD
11, 24671–24725, 2011Bulk microphysical properties of semi transparent cirrus
from AIRS
A. Guignard et al.
Title Page
Abstract Introduction
Conclusions References
Tables Figures
◭ ◮
◭ ◮
Back Close
Full Screen / Esc
Printer-friendly Version Interactive Discussion
Discussion
P
a
per
|
Dis
cussion
P
a
per
|
Discussion
P
a
per
|
Discussio
n
P
a
per
|
Abstract
This article presents a retrieval method and a statistical analysis of the bulk micropys-ical properties of semi-transparent ice clouds using the Atmospheric Infrared Sounder (AIRS). Global and long-term coverage provides information on the effective diameter (De) and habits of ice crystals in relation with their environment, ice water path (IWP)
5
and temperature. The method relies on spectral absorption differences between 8 and 12 µm that depend on ice crystal properties. Using single scattering properties for column-like or aggregate-like ice crystals, the method is sensitive toDeof up to 85 µm
and IWP of up to 120 g m−2. Uncertainties due to the hypotheses on atmospheric parameters and ice crystal single scattering properties as well as horizontal
hetero-10
geneities have been demonstrated to be small. The behaviour of bulk microphysical properties as a function of temperature demonstrates that pure ice clouds only occur whenTcld<230 K. On a global scale, these clouds represent practically 25 % of all high clouds and are mainly encountered in the mid-latitudes during winter and in the trop-ics. Colocated Radar-Lidar Geometrical Profiling (GEOPROF) data reveal an increase
15
in the vertical extent of these cloud layers during mid-latitude winter but which does not significantly impact ice crystal characteristics. A comparative study with bulk mi-crophysical properties from the TIROS-N Operational Vertical Sounder (TOVS) reveals improvements, especially for optically thin and thick semi-transparent ice clouds. Fi-nally, we investigated parametrizations ofDeas a function of IWP or Ice Water Content
20
(IWC), which could be useful for modelling cirrus in General Circulation Models.
1 Introduction
High clouds (with cloud top pressure smaller than 440 hPa) cover about 30 % of the globe (Wylie and Menzel., 1999; Wylie et al., 2004; Chepfer et al., 2010; Stubenrauch et al., 2006, 2010) and therefore strongly influence the radiation budget of the Earth.
25
ACPD
11, 24671–24725, 2011Bulk microphysical properties of semi transparent cirrus
from AIRS
A. Guignard et al.
Title Page
Abstract Introduction
Conclusions References
Tables Figures
◭ ◮
◭ ◮
Back Close
Full Screen / Esc
Printer-friendly Version Interactive Discussion
Discussion
P
a
per
|
Dis
cussion
P
a
per
|
Discussion
P
a
per
|
Discussio
n
P
a
per
|
atmospheric waves (Ivanova et al., 2001; Stith et al., 2002; Boehm et al., 2003; Luo et al., 2004), one expects a resulting difference in their microphysical properties. These then influence the Earth’s radiation budget. In General Circulation Models (GCM),Deis
often parameterized as a function of IWC or cloud temperature (Mc Farlane et al., 1992; Donner et al., 1997; Bony et al., 2001; Edwards et al., 2007). Cloud optical properties
5
are then calculated from the GCM diagnosed De, assuming a dominant ice crystal
shape. Most such relationships are based on data from only a few places on Earth and for very limited time periods (Heymsfield et al., 1984; Korolev et al., 2001; Boudala et al., 2002; Mc Farquhar et al., 2003; Garrett et al., 2004), and are also likely to be affected by ice crystal shattering (Korolev et al., 2004; Field et al., 2006; Mc Farquhar
10
et al., 2007). Even if satellite observations only allow us to retrieve bulk microphysical properties and rely on various assumptions, they provide a unique possibility to study correlations over the whole globe.
Compared to other passive remote sensing instruments, the high spectral resolu-tion infrared (IR) vertical sounders provide reliable properties of cirrus with an optical
15
depth as low as 0.1, day and night (Wylie and Menzel, 1994; Ackerman et al., 1995; Stubenrauch et al., 1999; Chung et al., 2000; Kahn et al., 2004, 2007; Stubenrauch et al., 2010). CO2-sensitive channels of IR vertical sounders allow the determination of
cloud height and cloud emissivity, and the spectral range between 8 and 12 µm allows an estimation of the De and IWP of semi-transparent cirrus (e.g. Kahn et al., 2008;
20
R ¨adel et al., 2003). This type of instrument is used to observe our planet since 1979, with improving spectral resolution: the TIROS-N Operational Vertical Sounders (TOVS) onboard the NOAA polar satellites, the Atmospheric InfraRed Sounder (AIRS) onboard Aqua (since 2002) and the InfraRed Atmospheric Sounding Interferometer (IASI) on-board METOP (since 2006). The retrieval of De relies on the fact that the spectral
25
differences in absorption (and scattering) of radiation depends on the size of the cloud particles and also on the IWP. Whereas techniques combining visible and near IR in-formation (e.g., Hong et al., 2007; Platnick et al., 2003; Roebeling et al., 2006) provide estimations ofDefor all ice clouds (however only near the top of the cloud for optically
ACPD
11, 24671–24725, 2011Bulk microphysical properties of semi transparent cirrus
from AIRS
A. Guignard et al.
Title Page
Abstract Introduction
Conclusions References
Tables Figures
◭ ◮
◭ ◮
Back Close
Full Screen / Esc
Printer-friendly Version Interactive Discussion
Discussion
P
a
per
|
Dis
cussion
P
a
per
|
Discussion
P
a
per
|
Discussio
n
P
a
per
|
thick clouds), IR techniques, based essentially on the spectral absorption differences between two or more wavelengths, are restricted to semi-transparent ice clouds.
The active instruments, Cloud-Aerosol Lidar with Orthogonal Polarization (CALIOP) and Cloud Profiling Radar (CPR) of the A-Train (Stephens et al., 2002) help us to characterize the cirrus vertical structure and to study relationships with the bulk
micro-5
physical properties.
This article is structured in the following way: Sect. 2 describes essentially our AIRS retrieval method as well as the coincident data from CALIOP and CPR. After sensitivity studies in Sect. 3, we discuss the retrieval applicability in Sect. 4, Sect. 5 presents results of the statistical analysis and our findings are summarized in Sect. 6.
10
2 Data and methods
2.1 AIRS cloud properties
Launched in May 2002 onboard the Earth Observing System (EOS) platform Aqua, the AIRS instrument (Aumann et al., 2003; Chahine et al., 2006) provides very high spectral resolution measurements of Earth-emitted radiation in three spectral bands
15
(3.74−4.61 µm, 6.20−8.22 µm and 8.80−15.40 µm) using 2378 channels with a
spec-tral resolution given by∆λ/λ=0.0008. The polar orbiting Aqua satellite provides obser-vations at 1:30 and 13:30 local time (LT, equator crossing time). The spatial resolution of these measurements is 13.5 km at nadir. Nine AIRS measurements (3×3)
corre-spond to one footprint of the Advanced Microwave Sounder Unit (AMSU), also called a
20
golf ball.
NASA L2 atmospheric temperature and water vapor profiles (Susskind et al., 2003, 2006) are retrieved from cloud-cleared AIRS radiances (Chahine et al., 2006) within each AMSU footprint.
The Thermodynamic Initial Guess Retrieval (TIGR) dataset (Ch ´edin et al., 1985;
25
ACPD
11, 24671–24725, 2011Bulk microphysical properties of semi transparent cirrus
from AIRS
A. Guignard et al.
Title Page
Abstract Introduction
Conclusions References
Tables Figures
◭ ◮
◭ ◮
Back Close
Full Screen / Esc
Printer-friendly Version Interactive Discussion
Discussion
P
a
per
|
Dis
cussion
P
a
per
|
Discussion
P
a
per
|
Discussio
n
P
a
per
|
thermodynamic profiles (T,H2O,O3), the second with the corresponding transmissivity profiles obtained from a radiative transfer model. Special attention is given to proximity recognition between the retrieved atmospheric profiles and the ones collected in the TIGR data set. Spectral surface emissivities are determined from AIRS (P ´equignot et al. (2008), calculated at the Laboratoire de M ´et ´eorologie Dynamique and available
5
at: http://ara.abct.lmd.polytechnique.fr/) in the tropics (30◦N–30◦S) and taken from MODIS (Seemann et al., 2008) at higher latitudes.
The LMD cloud property retrieval scheme provides cloud pressure and emissivity of a single cloud layer (of the uppermost cloud layer in the case of multi layer clouds). It is based on a weightedχ2 (χw2) method using eight channels around the 15 µm CO2
10
absorption band (Stubenrauch et al., 2010). Theχw2 method determines the pressure
level for which the measured radiances at all wavelengths provide the most coherent cloud emissivity,ǫcld :
ǫcld(pk,λi)=
Im(λi)−Iclr(λi)
Icld(pk,λi)−Iclr(λi)
for i=1.8 (1)
where λi is the wavelength of AIRS channel i, pk is the pressure level k out of 40 levels,Imis the measured radiance,IclrandIcldare the computed clear sky and cloudy
15
(opaque) radiances, respectively. Theχw2 method was developed to take into account
(1) the vertical weighting of the different channels, (2) the growing uncertainty in the computation of ǫcld with increasing pk and (3) uncertainties in atmospheric profiles. When the χw2 method leads to a non-acceptable value of ǫcld (larger than 1.5), the
scene is set to clear sky (as well as in the case ofǫcld<0.05). Cloud temperatureTcld
20
is determined from pcld, using the AIRS L2 temperature profile. The cloud property
retrieval is applied to all AIRS footprints. The distinction between cloudy and clear sky (or slightly cloudy so that cloud properties would not be reliable) is essentially based on the spectral coherence of cloud emissivity, using the retrieved cloud pressure. Cloud amount and cloud properties have been evaluated using two years of collocated
25
ACPD
11, 24671–24725, 2011Bulk microphysical properties of semi transparent cirrus
from AIRS
A. Guignard et al.
Title Page
Abstract Introduction
Conclusions References
Tables Figures
◭ ◮
◭ ◮
Back Close
Full Screen / Esc
Printer-friendly Version Interactive Discussion
Discussion
P
a
per
|
Dis
cussion
P
a
per
|
Discussion
P
a
per
|
Discussio
n
P
a
per
|
CALIPSO data (Stubenrauch et al., 2008, 2010): the retrieved AIRS cloud pressure of 72 % of high (pcld<440 hPa) and of 59 % of lowlevel (pcld>680 hPa) clouds lies within
75 hPa of the apparent middle (see Sect. 2.3) of the CALIPSO cloud layers.
2.2 AIRS bulk microphysical properties of semi-transparent cirrus
In the following we describe the methodology used to retrieve theDeand IWP of
semi-5
transparent cirrus. The spectral behaviour of cirrus emissivity allows us to distinguish between cirrus containing mostly column-like or aggregate-like ice crystals. In a first step, the single scattering properties (SSPs) of ice crystals have been integrated into a radiative transfer model to simulate look-up tables (LUTs) of cirrus emissivities between 8 and 12 µm as function of De and IWP. These LUTs are then used in the AIRS
10
retrieval.
2.2.1 Simulation of cirrus emissivities
The calculation of the radiative impact of cirrus requires the precise knowledge of the SSPs of ice crystals. SSPs depend on the complex refractive index of the par-ticle, on particle shape as well as on size parameter (the ratio between the
char-15
acteristic particle dimension and the incident wavelength). We use extinction cross section, single scattering albedo and asymmetry parameter determined for column-like and aggregate-column-like ice crystals by Baran and Francis (2004). The aspect ratio of the column-like ice crystals decreases with maximum dimension and is constant for aggregate-like ice crystals.
20
To compute interactions between ice crystals and radiation over an entire population of randomly oriented particles, the SSPs of the individual crystals have been integrated over a bimodal size distribution, with an exponential behaviour for small ice crystals and a Γ distribution for larger ones (Mitchell et al., 1996). This kind of particle size distribution (PSD) is predicted from growth processes of water vapour deposition and
25
ACPD
11, 24671–24725, 2011Bulk microphysical properties of semi transparent cirrus
from AIRS
A. Guignard et al.
Title Page
Abstract Introduction
Conclusions References
Tables Figures
◭ ◮
◭ ◮
Back Close
Full Screen / Esc
Printer-friendly Version Interactive Discussion
Discussion
P
a
per
|
Dis
cussion
P
a
per
|
Discussion
P
a
per
|
Discussio
n
P
a
per
|
confirmed by in situ measurements (Mitchell et al., 1996; Mace et al., 1998; Field et al., 2005, 2007). The PSD used in this study was probably not affected by the shattering problem (Mitchell et al., 2011).
This population is characterized by its crystal habit and by its ice-crystal mean De
which is considered as an effective photon path through the PSD (before internal
re-5
flection takes place). It can be calculated, according to Mc Farquhar and Heymsfield (1997) and Mitchell et al. (2002), as the ratio of total volume to total projected area of the entire crystal population as in Eq. (2):
De= 3 2
R∞
0 V n(r)dr
R∞
0 P n(r)dr
(2)
whereV andP are the volume and projected area of an ice crystal in a size distribution
n(r) with respect to radius.
10
These SSPs are then implemented, as a function ofDeand wavelength, into the
line-by-line Automatized Atmospheric Absorption Atlas (4A) radiative transfer model (Scott and Ch ´edin, 1981) coupled (Pierangelo et al;, 2005) with a multiple scattering model based on discrete ordinate radiative transfer (DISORT, Stamnes et al., 1988). Cloud, atmospheric and surface properties for simulation of cirrus emissivities are the same
15
as in R ¨adel et al. (2003): cloud top height is 10 km (corresponding to cloud top temper-ature of 237 K), cloud vertical extent is 1 km, surface tempertemper-ature is 300 K, lapse rate is 6.5 K km−1 and surface emissivity is set to 1. Section 3 describes sensitivity studies linked to changes in these parameters. To determine the cirrus spectral emissivity, we also need to simulate radiances for clear sky and for an opaque cloud situated at the
20
same height as the cirrus. Spectral cirrus emissivities are then calculated in the same manner as in Eq. (1), only withImalso depending onDeand IWP.
For the retrieval application we construct LUTs composed of spectral cirrus emissiv-ities between 8 and 12 µm depending on theDeand IWP, with theDevarying from 7 to
85 µm and the IWP varying from 1 to 120 g m−2, separately for two different ice crystal
25
ACPD
11, 24671–24725, 2011Bulk microphysical properties of semi transparent cirrus
from AIRS
A. Guignard et al.
Title Page
Abstract Introduction
Conclusions References
Tables Figures
◭ ◮
◭ ◮
Back Close
Full Screen / Esc
Printer-friendly Version Interactive Discussion
Discussion
P
a
per
|
Dis
cussion
P
a
per
|
Discussion
P
a
per
|
Discussio
n
P
a
per
|
habits (column-like and aggregate-like) and for eight different viewing angles between 0 and 30◦(see Sect. 4). We note that by using cirrus emissivities instead of brightness temperatures, the surrounding atmosphere is taken into account (R ¨adel et al., 2003); therefore, one does not need to produce LUTs for different atmospheres.
Figure 1 presents the simulated range ofDeand IWP for a given emissivity at 12 µm
5
of a cloud composed of aggregate-like ice crystals. Whereas the range ofDe is the
same, the range of IWP increases with increasing cirrus emissivity. For a given emis-sivity and largerDe the total extinction is large and therefore the resulting IWP is also
large.
Figure 2 presents the normalized spectral emissivities differences, compared to
10
the emissivity at 12 µm, as a function of wavelength, separately for column-like and aggregate-like ice crystals. We present simulations for a small IWP of 10 g m−2and for a larger IWP at 20 g m−2, each distinguishing three values of De (10, 30 and 50 µm).
Wavelengths between 8 and 10 µm are the most sensitive to De variation. We note
that the sensitivity toDe will decrease with increasing IWP. It appears that the cirrus
15
emissivity between 8 and 10 µm is also sensitive to crystal habit with larger emissivity differences for aggregate-like ice crystals than for columns-like ice crystals.
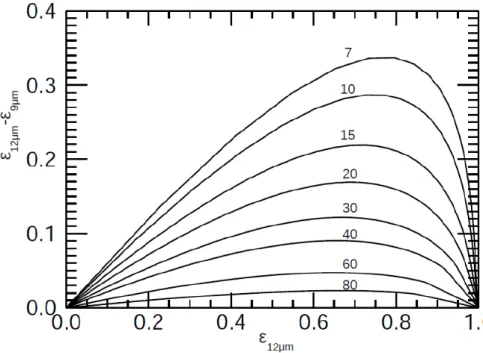
To better illustrate the cirrus emissivity range for which a retrieval ofDeis possible,
Fig. 3 presents ice cloud emissivity differences between 12 and 9 µm (∆ǫ12−9) as a
function of ice cloud emissivity at 12 µm for various mean effective ice crystal
diam-20
eters. For a given cirrus emissivity at 12 µm (ǫ12), which corresponds to a certain
IWP, ∆ǫ12−9 increases with decreasing De. The difference is maximum for a
semi-transparent cirrus ofǫ12≃0.7 and becomes zero if the emissivity reaches 0 or 1. This
figure is similar to the one for TOVS, using a cirrus emissivity difference between 11.1 and 8.3 µm (R ¨adel et al., 2003).
25
ACPD
11, 24671–24725, 2011Bulk microphysical properties of semi transparent cirrus
from AIRS
A. Guignard et al.
Title Page
Abstract Introduction
Conclusions References
Tables Figures
◭ ◮
◭ ◮
Back Close
Full Screen / Esc
Printer-friendly Version Interactive Discussion
Discussion
P
a
per
|
Dis
cussion
P
a
per
|
Discussion
P
a
per
|
Discussio
n
P
a
per
|
the whole period, we obtained similar results and it has been shown by L’Ecuyer et al., 2006 and Kahn et al., 2008) that cloud property retrieval does not improve anymore by adding additional spectral information when the most sensitive channels are already being used.
2.2.2 Retrieval
5
Once the physical cloud properties (pcld and ǫcld) are determined (see Sect. 2.1), six
spectral emissivities at 8.87,9.12,10.41,10.70,12.02 and 12.33 µm are determined for high clouds (pcld<440hPa). For the assumed ice crystal habits (column-like or
aggregate-like) the retrievedDe-IWP couple is given by Eq. (3). The cirrus emissivities
(ǫm) are compared with the LUT’s (ǫs) and proximity recognition, weighted by the root
10
mean square of the spectral variability of the emissivities, is applied.
∆θv(De,IWP)=
P6
i=1(ǫ
m λi,θv−ǫ
s
λi,θv(De,IWP)) 2
·σ(ǫsλ
i,θv) P6
j=1σ(ǫ
s λj,θv)
(3)
whereλi represents the i-th channel selected, θv is the viewing angle and σ(ǫ
s λj,θv)
is the root mean square of the simulated emissivity for a particular channel and a particular viewing angle.
2.3 Cloud vertical structure from Radar-Lidar GEOPROF data
15
The lidar CALIOP (Winker et al., 2007, 2009) of the CALIPSO mission, provides backscatter profiles at 532 nm and at 1064 nm with a vertical and horizontal resolu-tion of about 30 m and 90 m, respectively. Horizontal sampling is 333 m along the track and the distance between two orbits is about 1000 km. CALIPSO provides information on the geometrical height of cloud top and apparent cloud base. The latter is higher
20
ACPD
11, 24671–24725, 2011Bulk microphysical properties of semi transparent cirrus
from AIRS
A. Guignard et al.
Title Page
Abstract Introduction
Conclusions References
Tables Figures
◭ ◮
◭ ◮
Back Close
Full Screen / Esc
Printer-friendly Version Interactive Discussion
Discussion
P
a
per
|
Dis
cussion
P
a
per
|
Discussion
P
a
per
|
Discussio
n
P
a
per
|
penetrates the cloud only up to an optical depth of about 5 (Winker et al., 2003). The radar CPR of the Cloudsat mission (Stephens et al., 2002), is a 94 GHz nadir-viewing radar which measures the profile of the power backscattered by clouds at a vertical resolution of about 250 m and with an horizontal resolution of about 2.5 km×1.4 km.
It is able to probe optically thick cloud layers and therefore provides the correct cloud
5
base. Combining these two instruments has the potential of providing a complete de-scription of the vertical structure of clouds. However, one has to remember that the laser-like view of these platforms means that they observe only a small fraction of all cloudy scenes. In this study we use the L2 Radar-Lidar GEOPROF data (Version 3, Mace et al., 2009) that merge the geometrical profiling of CALIOP and CPR. The AIRS
10
data have been collocated with the L2 Radar Lidar GEOPROF data (Stubenrauch et al., 2010). In addition, we determine horizontal scene homogeneity by using cloud type information (according to pcld and ǫcld) of the 3×3 AIRS footprints per AMSU
golf ball. For the analysis of semi transparent high ice clouds, we only keep situations with overcast AMSU golf balls (all AIRS footprints are cloudy) and for which the AIRS
15
cloud radiative altitude lies between the top and the base altitude determined by the Radar-Lidar sample.
3 Sensitivity studies
When creating Look Up Tables (Sect. 2.2.1), we had to make several assumptions on the physical parameters of the cloud as well as on the ice crystals. In this section, we
20
study the uncertainties on the retrieved De associated with these assumptions. We
resume the standard conditions for the simulation of ice cloud spectral emissivities:
– vertical extentZcld=1 km
– cloud heighthcld=10 km, correspondingtoTcld=237 K in the tropics
– randomly-oriented aggregate-like ice crystals integrated over a bimodal Γ size
25
ACPD
11, 24671–24725, 2011Bulk microphysical properties of semi transparent cirrus
from AIRS
A. Guignard et al.
Title Page
Abstract Introduction
Conclusions References
Tables Figures
◭ ◮
◭ ◮
Back Close
Full Screen / Esc
Printer-friendly Version Interactive Discussion
Discussion
P
a
per
|
Dis
cussion
P
a
per
|
Discussion
P
a
per
|
Discussio
n
P
a
per
|
– atmospheric lapse rate equal to 6.5 K km−1
– surface temperatureTs=300 K
– surface emissivityǫs=1
3.1 Sensitivity to atmospheric properties
We have independently made the following changes: increasing cloud vertical extent by
5
1 km, cloud height by 4 km (decreasingTcldby 27 K), increasing atmospheric lapse rate
to 11.5 K km−1and decreasing surface temperature by 15 K. The resulting differences in the initially retrievedDecalledD
std
e compared to the retrieval with the new parameter
calledD′eare presented in the upper part of Table 1. The differences are normalized
toDestd, and are shown separately for optically thin clouds (ǫ12µm≃0.3) and relatively
10
thick clouds (ǫ12µm≈0.75) and also for small and large De (De≃19 µm and De≃
60 µm, respectively). In general, all changes are small and lie around 1 % to 2 %. Only the lapse rate increase in the case of optically thin clouds consisting of small particles leads to a decrease of 6 %. In addition, we increased the vertical extent up to 5 km which is a relevant extent according to Fig. 4. For clouds with vertical extents between
15
4 and 5 km, the uncertainty remains small for optically thick cirrus (D′
e1 % smaller than
Destd). For optically thin cirrus and small particles,De’ can be up to 10 % smaller than
Destdbut these cases are very rare.
To evaluate the effect of horizontal heterogeneity, we have compared results obtained for golf balls containing only cirrus to those obtained for golf balls containing also other
20
cloud types (but that are fully cloud covered: overcast golf balls). The hypothesis is that heterogeneous scenes have a higher probability for an AIRS footprint to be partially covered by an ice cloud and by a low cloud. When including heterogeneous overcast scenes (which add 12 % to the statistics of golf balls that are entirely covered by cirrus), the retrieved De is only 3 % smaller. However, including partially
cloud-25
covered footprints (not surrounded by other cloudy footprints), De can be up to 10 %
ACPD
11, 24671–24725, 2011Bulk microphysical properties of semi transparent cirrus
from AIRS
A. Guignard et al.
Title Page
Abstract Introduction
Conclusions References
Tables Figures
◭ ◮
◭ ◮
Back Close
Full Screen / Esc
Printer-friendly Version Interactive Discussion
Discussion
P
a
per
|
Dis
cussion
P
a
per
|
Discussion
P
a
per
|
Discussio
n
P
a
per
|
smaller than in the case of a fully covered AIRS footprint. The population of partially cloud- covered golf balls is, on a global scale, 10 times smaller than the population of overcast golfballs. A partially covered AIRS footprint leads to an overestimation ofDe
that is smaller than the one mentioned in (R ¨adel et al., 2003) for the TOVS retrieval. This is partly due to the better spatial resolution of the AIRS retrieval (13 km instead
5
of 100 km for TOVS). To minimize the uncertainty due to horizontal heterogeneity but keeping an important statistics we decide to keep only overcast golf balls.
3.2 Sensitivity to ice crystal properties
The first sensitivity study concerns other ice crystal shapes and approaches to de-termine the single scattering properties. Whereas SSPs by Baran (2004) have been
10
determined using the T-Matrix approximation, the SSP determination by Mitchell (1996, 2002) is based on the Anomalous Diffraction Approximation. Comparisons by Mitchell et al. (2006) have shown a good agreement between both methods. Therefore, only the difference in shape remains: aggregated columns (Baran) compared to aggregated plates (Mitchell). For each case, cirrus emissivities were calculated using the same
15
crystal size distribution. The lower part of Table 1 presents normalized differences betweenDestd and newly retrievedD
′
e, separately for optically thin and thick cirrus and
separately for smallDeand largeDe. Differences are small, lying around−1 % to−2 %,
assuming aggregated plates instead of aggregated columns.
The retrieval also provides an estimation of the most probable ice crystal shape.
20
For each event it retains the two best fits for each crystal habit and then compares the overall best fit to the second best fit. For most of the cases, the first and second best fits ofDestem from the same ice crystal habit (96 % and 87 % for small and large particles
respectively), and so the uncertainty on the retrievedDe is quite small and lies within
4 % (this uncertainty is smaller for large particles in an optically thick cloud and slightly
25
larger for column-like than for aggregate-like ice crystals). When the two best fits do not present the same habit (4 % and 13 % for small and large particles respectively),De
ACPD
11, 24671–24725, 2011Bulk microphysical properties of semi transparent cirrus
from AIRS
A. Guignard et al.
Title Page
Abstract Introduction
Conclusions References
Tables Figures
◭ ◮
◭ ◮
Back Close
Full Screen / Esc
Printer-friendly Version Interactive Discussion
Discussion
P
a
per
|
Dis
cussion
P
a
per
|
Discussion
P
a
per
|
Discussio
n
P
a
per
|
Therefore, even when a particular shape can not be distinguished, the uncertainty on
Deremains very small. In this case, we choose to average the two effective diameters
and the shape is set to uncertain.
4 Retrieval applicability
We apply the retrieval of bulk microphysical properties to all AIRS footprints supposed
5
to be covered by ice clouds. Therefore, we select footprints of overcast golf balls, con-taining high clouds (pcld<440 hPa) with Tcld<260 K (as the distinction for ice clouds by the International Satellite Cloud Climatology Project (ISCCP, Rossow and Schiffer, 1999). For each of these two cloud properties, we compare the bestχw2 solution with
the second best one (Sect. 2.1) and keep only those clouds with stable solutions. In
ad-10
dition, we reject AIRS footprints with a viewing zenith angle greater than 30◦, because the IWP corresponds to a trajectory considerably longer than the cloud vertical extent. In a first step, no particular attention is accorded to the cloud effective emissivity except to be between 0 and 1. These cuts leave us with the basic population of high clouds which will be referenced as HC hereafter. In this section we investigate the
relation-15
ships between the bulk microphysical properties and the physical cloud properties.
4.1 Relationship with cloud effective emissivity
As already seen in Fig. 3, the retrieval is not sensitive anymore toDefor clouds with low
and high emissivity. In Fig. 5, we present the retrieved bulk microphysical properties as a function of the AIRS cloud emissivity determined by the χw2-method separately
20
for different latitude bands and different seasons. To determine the range of cloud emissivity in which the bulk microphysical properties are well retrieved, we study their behaviour. We observe that the fraction of uncertain shape (Sect. 3.2) is larger for low cloud emissvities, with a large spread between the different regions forǫcld<0.20,
and drops to nearly 0 whenǫcld>0.85 as well as the fraction of aggregate-like ice
crys-25
ACPD
11, 24671–24725, 2011Bulk microphysical properties of semi transparent cirrus
from AIRS
A. Guignard et al.
Title Page
Abstract Introduction
Conclusions References
Tables Figures
◭ ◮
◭ ◮
Back Close
Full Screen / Esc
Printer-friendly Version Interactive Discussion
Discussion
P
a
per
|
Dis
cussion
P
a
per
|
Discussion
P
a
per
|
Discussio
n
P
a
per
|
tals.Deincreases slightly withǫcldbut we observe a change in the slope of increase for
ǫcld≃0.2 andǫcld≃0.85. IWP strongly increases withǫcldand then stays constant and
even drops forǫcld>0.85. All these behaviours lead us to the conclusion that the
re-trieval of bulk microphysical properties can be conducted for AIRS forǫcld between 0.2
and 0.85, corresponding to semi-transparent cirrus. It is interesting to note that within
5
this range, IWP behaves the same for all latitude bands and seasons, the behaviour of
De is similar, except with smaller values and a slightly stronger increase in the
South-ern Hemisphere (SH) midlatitude summer. The fraction of aggregate-like ice crystals also increases withǫcld, reaching 0.6 for ǫcld>0.55. There is a spread of about 0.1
between the different latitude bands and seasons, with less complex shapes in
North-10
ern Hemisphere (NH) mid-latitudes during winter. These thresholds are consistent with previous studies (R ¨adel et al., 2003). For optically thin clouds the atmosphere plays a more important role, and it has been shown that choosing a wrong atmospheric profile can lead to a bias inDe. In R ¨adel et al. (2003), the lower emissivity threshold for TOVS
was fixed atǫcld=0.3, but the improvement of the spectral and spatial resolution of the
15
AIRS instrument allows us to reduce this value toǫcld=0.2. Bulk microphysical
prop-erties of these semi-transparent cirrus correspond to an average over the whole cloud vertical extent (R ¨adel et al., 2003), whereas for optically thick clouds, the instrument only sounds the upper part of the cloud (Sect. 5.2.2).
4.2 Distinction between ice clouds and mixed phase clouds
20
We study the microphysical properties as a function of cloud temperature. In Fig. 6, when considering the different latitude bands and seasons, we distinguish two regimes:
– Tcld<230 K : De and IWP increase with increasing Tcld and the fraction of
aggregate-like ice crystals (≃0.6) remains approximately constant.
– Tcld>230 K :Deand IWP decrease with increasingTcldand the fraction of
column-25
ACPD
11, 24671–24725, 2011Bulk microphysical properties of semi transparent cirrus
from AIRS
A. Guignard et al.
Title Page
Abstract Introduction
Conclusions References
Tables Figures
◭ ◮
◭ ◮
Back Close
Full Screen / Esc
Printer-friendly Version Interactive Discussion
Discussion
P
a
per
|
Dis
cussion
P
a
per
|
Discussion
P
a
per
|
Discussio
n
P
a
per
|
The change in behaviours ofDeand IWP at 230 K as well as the increase of the rate of
columns-like ice crystals (the latter have SSPs closer to spheres than aggregate-like ice crystals) demonstrate that pure ice clouds only occur whenTcld<230 K. This is in
agreement with previous studies (Yang et al., 2002; Hu et al., 2009; Riedi et al., 2010; Martins et al., 2011). It also seems from Fig. 6 that the temperature does not much
5
affect the crystal shape in pure ice clouds, which is consistent with the fact that the roundness of particles is a weak function of temperature (Korolev and Isaac., 2003).
4.3 Occurrence of semi-transparent high ice clouds
From the findings in Sects. 4.1 and 4.2 we conclude to consider in the following only Semi-Transparent High Clouds of pure ice, referenced as ST-HIC and defined as below:
high clouds: pcld≤440hPa
pure ice clouds: Tcld≤230K
semi-transparent clouds: 0.2≤ǫcld≤0.85
(corresponding to visible optical depth: 0.4≤τvis≤3.8)
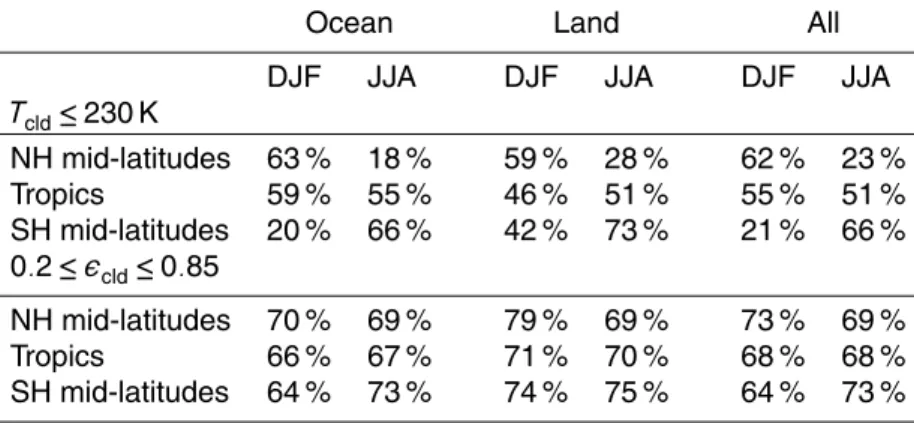
Globally the cut on cloud emissivity retains about 70 % of high clouds, slightly more over land than over ocean (see Table 2). Figure 7 presents distributions ofTcld, in NH
10
mid-latitudes, the tropics and SH mid-latitudes, separately in boreal winter and in bo-real summer. We observe a strong summer-winter difference in the mid-latitudes and much broader distributions in the tropics. While in the mid-latitudes more than 60 % of semi-transparent cirrus present a temperature lower than 230 K in winter and only less than 20 % in summer, this rate is almost constant in the tropics (55 %). The seasonal
15
difference is stronger over ocean than over land (Table 2). Cuts on cloud emissivity do not present any particular seasonal cycle. Howeverǫcld(Fig. 9), is in general larger in
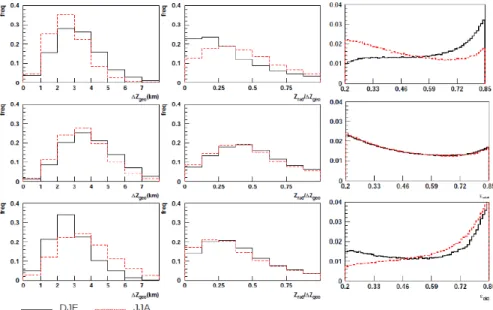
the mid-latitudes (frontal systems) than in the tropics (anvils), and in the mid-latitudes values are in general lower in summer than in winter. On the right column of Fig. 4, theǫcld distributions of ST-HIC, in NH mid-latitudes, tropics and SH mid-latitudes are
20
ACPD
11, 24671–24725, 2011Bulk microphysical properties of semi transparent cirrus
from AIRS
A. Guignard et al.
Title Page
Abstract Introduction
Conclusions References
Tables Figures
◭ ◮
◭ ◮
Back Close
Full Screen / Esc
Printer-friendly Version Interactive Discussion
Discussion
P
a
per
|
Dis
cussion
P
a
per
|
Discussion
P
a
per
|
Discussio
n
P
a
per
|
presented, separately in boreal winter and in boreal summer. Distributions are not Gaussian and present two peaks at low and large values. In the NH mid-latitudes, the seasonal cycle of ST-HIC effective emissivity has been reinforced by cuts on tem-perature and in summer the emissivity presents almost the same distribution as in the tropics, in contrary to SH mid-latitudes where the seasonal cycle is weaker. This
5
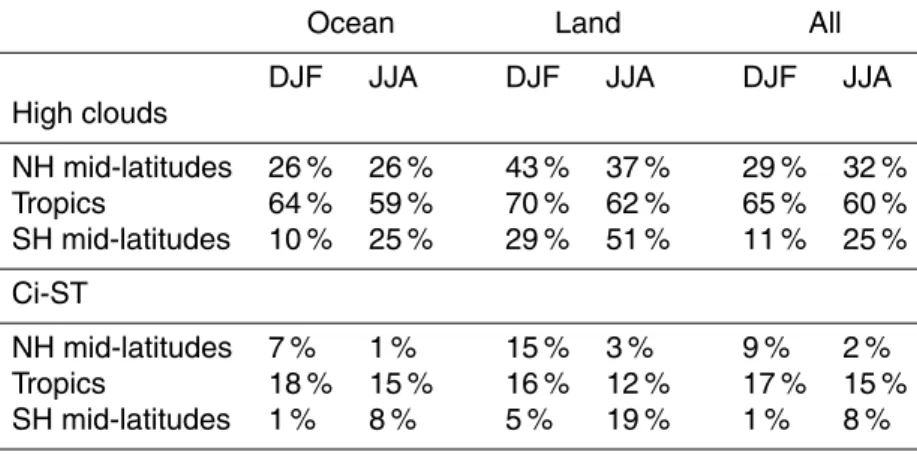
may be linked to the atmospheric general circulation. Figure 8 presents geographi-cal maps of the relative high cloud amount (sgeographi-caled to total cloud amount) and relative semi-transparent high ice cloud amount over the period 2003–2009. ST-HIC amount is significantly smaller than HC amount but follows the same geographical pattern. Associated statistics are resumed in Table 3. The Inter Tropical Convergence Zone
10
(ITCZ) presents the highest relative HC amount and relative ST-HIC amount (about 15 % of all clouds or 25 % of high clouds) with almost no difference between ocean and land. Relative HC amount presents a significant seasonal difference in the SH mid-latitudes whereas it is nearly constant in the NH mid-latitudes. On the contrary, the seasonal difference of the relative ST-HIC amount is pronounced in both hemispheres.
15
Mainly because of temperature distributions, ST-HIC occur mostly during winter where they represent practically 30 % of high clouds. We also note that the relative ST-HIC amount is significantly higher over land than over ocean.
5 Analysis ofDe, IWP and ice crystal habit
5.1 Geographical and seasonal variations
20
Figure 9 shows geographical maps of ST-HIC effective emissivity and IWP, separately for boreal winter and for boreal summer, averaged over the period 2003–2009. As already observed in Fig. 5, these two parameters are highly correlated. Cold and moist air masses generate cirrus with large IWP and infrared emissivity. The largest values are encountered in the mid-latitudes in winter and can be associated to winter
25
ST-ACPD
11, 24671–24725, 2011Bulk microphysical properties of semi transparent cirrus
from AIRS
A. Guignard et al.
Title Page
Abstract Introduction
Conclusions References
Tables Figures
◭ ◮
◭ ◮
Back Close
Full Screen / Esc
Printer-friendly Version Interactive Discussion
Discussion
P
a
per
|
Dis
cussion
P
a
per
|
Discussion
P
a
per
|
Discussio
n
P
a
per
|
HIC amount, by middle range values of both IR emissivity and IWP. Figure 10 shows geographical maps ofDe and the dominating ice crystal shape, separately for boreal
winter and for boreal summer. As IR emissivity and IWP,Deis larger in winter than in
summer in the mid-latitudes.
On a global scale, the most representative form of ice crystals seems to be
5
aggregate-like. That is consistent with in situ measurements that suggest that irregular is the dominant habit of ice particle grown in natural clouds (Francis and Foot, 1999; Korolev and Isaac., 2003; Gayet et al., 2011). Nevertheless, in the SH mid-latitudes during summer, in some oceanic regions of the NH, mid-latitudes and generally over land ST-HIC seems to be mainly composed of column-like ice crystals. On average,
10
the fraction of ice clouds containing aggregate-like ice crystal shapes is about 44 %, 54 % and 55–60 % in the NH mid-latitudes tropics and SH mid-latitudes, respectively. Figure 11 presents for different latitude bands and seasons correlations of the fraction of aggregate-like ice crystals with IWP(top) as well as withDe (below). We note that
the fraction aggregate-like ice crystals increases with IWP, thus explaining the higher
15
frequency of this shape in the mid-latitudes during winter. For a fixed IWP, the fraction of aggregate-like ice crystals decreases with increasingDe.
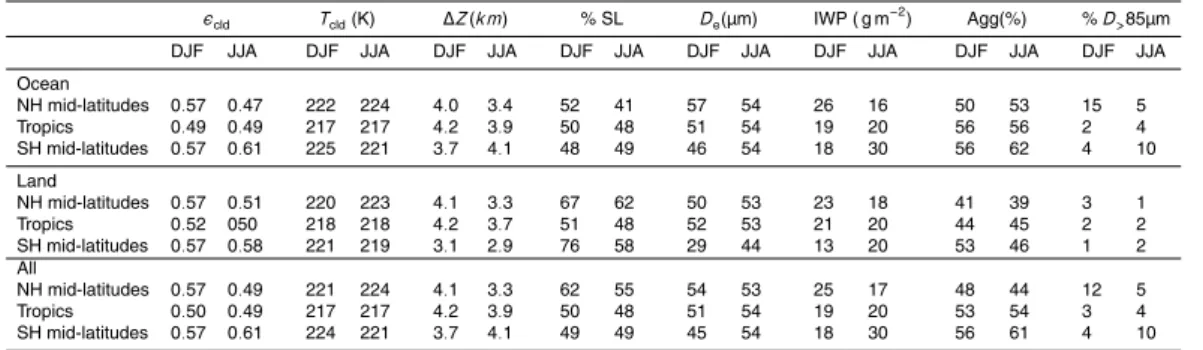
This is consistent with in situ measurements that show that the shape of ice crystals becomes less spherical as its size increases (Mitchell., 2009). Figure 12 presents normalized frequency distributions of the microphysical properties (De, IWP and shape)
20
for three latitude bands (NH mid-latitudes, tropics and SH mid-latitudes), separately for boreal summer and for boreal winter. Table 4 presents averages, also separately over ocean and over land. For the bulk microphysical properties (De and IWP) we present
the medians of the distributions. These are very similar to the averages, but about 10 % smaller. In general, IWP distributions are very asymmetric, with a peak around
25
10 g m−2 and a long tail towards large values. Whereas in the tropics there is no seasonal difference, with a median value of about 20 g m−2, there are more ST-HICs with small IWP in summer than in winter in the mid-latitudes, leading to differences in the median of about 10 g m−2. In the SH the winter peak is even shifted towards a
ACPD
11, 24671–24725, 2011Bulk microphysical properties of semi transparent cirrus
from AIRS
A. Guignard et al.
Title Page
Abstract Introduction
Conclusions References
Tables Figures
◭ ◮
◭ ◮
Back Close
Full Screen / Esc
Printer-friendly Version Interactive Discussion
Discussion
P
a
per
|
Dis
cussion
P
a
per
|
Discussion
P
a
per
|
Discussio
n
P
a
per
|
larger value.
5.2 Relationship with cloud vertical structure
5.2.1 Single and multi layer clouds
The Radar-Lidar GEOPROF data that have been collocated with AIRS data, allow us to characterize the vertical structure of the ST-HIC. Figure 13 presents geographical maps
5
of the fraction of single layer clouds and of the vertical extent of the ST-HIC population, separately for boreal winter and for boreal summer. The relative amount of single layer ST-HIC is presented in the column named %SL of Table 4, separately for the three latitude bands and for boreal winter and boreal summer. In general, we observe less single layer ST-HICs in the tropics and in the case of winter storm tracks in the
10
mid-latitudes and more single layer ST-HICs over land, especially in the mid-latitudes. Single layer ST-HICs also largely dominate over the Sahara. The vertical extent of the uppermost ST-HICs in multi layer systems is in general smaller than the one in single layer ST-HICs, in agreement with other general cloud observations (e.g. Wang et al., 2000). We observe the smallest averages in regions where no convection occurs.
ST-15
HICs are on average vertically more extended in the mid-latitudes (especially in the SH and in winter in the NH) than in the tropics, except over very small areas of intense convection over land. Comparing bulk microphysical properties, single layer and multi layer ST-HICs present similar distributions (not shown) but contain larger values for a single layer. It also seems that the fraction of aggregated columns is slightly larger for
20
single layer than for multi layer ST-HICs.
5.2.2 Dependance with cirrus geometrical depth
Figure 14 presents the dependency of bulk microphysical properties on the cloud ver-tical extent for different latitude bands and seasons, separately over ocean and over land. In general, the ST-HIC emissivity increases with vertical extent. No seasonal
ACPD
11, 24671–24725, 2011Bulk microphysical properties of semi transparent cirrus
from AIRS
A. Guignard et al.
Title Page
Abstract Introduction
Conclusions References
Tables Figures
◭ ◮
◭ ◮
Back Close
Full Screen / Esc
Printer-friendly Version Interactive Discussion
Discussion
P
a
per
|
Dis
cussion
P
a
per
|
Discussion
P
a
per
|
Discussio
n
P
a
per
|
differences are observed in the tropics and SH latitudes, whereas for NH mid-latitudes the behaviour corresponds more to the one in the tropics during summer and to the one in the SH mid-latitudes during winter. Cirrus over ocean and over land demonstrate a similar behaviour. It is interesting to note that for the same vertical extent, the emissivity of clouds is largest in the SH mid-latitudes and smallest in the
5
tropics. This is probably linked to the different types of cirrus, those from anvils in the tropics and those from waves and storms in the mid-latitudes. However, their IWP is very similar and constant for cloud vertical extent up to 4 km, and then it increases for ST-HICs in the mid-latitudes and much less for ST-HICs in the tropics. In general,De
shows a similar behaviour as a function of vertical extent, with even smaller changes
10
with vertical extent. However, at the same vertical extent, ST-HICs have slightly larger
De in the tropics and NH mid-latitude summer than in the SH mid-latitudes and in NH
mid-latitude winter.In fact, it appears that the bulk microphysical properties depend es-sentially on the optical thickness and are almost independent of the vertical extent of the cloud. One exception is the behaviour of ST-HICs over NH mid-latitudes land in
15
winter, with smaller column-like ice crystals for ST-HICs with less vertical extent and larger crystals in geometrically thicker ST-HICs.
5.3 Comparison with TOVS
Bulk microphysical properties of semi-transparent cirrus have already been retrieved with the TIROS-N Operational Vertical Sounder (TOVS) (R ¨adel et al., 2003;
Stuben-20
rauch et al., 2004). The methodology is similar, with the following main differences compared to our AIRS retrieval: single scattering properties have been determined by assuming ice crystals as aggregated plates (Mitchell et al., 1996), only two channels (at 8.3 and 11.9 µm) were available and therefore firstDe (using LUTs depending onǫcld
at 8.3 and 11.9 µm) and in a second step IWP (using LUTs depending onDeandǫ11)
25
were retrieved, for semi-transparent cirrus (0.3< ǫcld<0.85 ) over the period 1989–
1990. Another important difference is the spatial resolution of the retrievals: 100 km for TOVS compared to 13.5 km for AIRS.
ACPD
11, 24671–24725, 2011Bulk microphysical properties of semi transparent cirrus
from AIRS
A. Guignard et al.
Title Page
Abstract Introduction
Conclusions References
Tables Figures
◭ ◮
◭ ◮
Back Close
Full Screen / Esc
Printer-friendly Version Interactive Discussion
Discussion
P
a
per
|
Dis
cussion
P
a
per
|
Discussion
P
a
per
|
Discussio
n
P
a
per
|
In Fig. 15, we compare the global annual distributions of De and IWP from TOVS
and AIRS separately for several cirrus emissivity intervals. We also include results from a retrieval using the two AIRS channels that are the closest to the TOVS ones, for aggregate-like ice crystals only. All distributions consider clouds withTcld<230 K.
In general, the overall distributions (lowest panel) agree quite well, with a slightly wider
5
IWP distribution from AIRS. Considering the different cirrus emissivity intervals, we ob-serve that both instruments provide very similar results onDeand IWP forǫcldbetween 0.5 and 0.7, which corresponds to the range of maximum sensitivity (Fig. 3 and Fig. 1 of R ¨adel et al., 2003). Differences appear when considering smaller and larger emis-sivities, for which the TOVS spectral cirrus emissivity differences are smaller and larger
10
than the ones of AIRS, respectively (not shown). This leads to larger and smallerDe
obtained by TOVS for optically thin and optically thicker clouds, respectively, compared to those obtained by AIRS. Assuming that the better spectral and spatial resolution of AIRS has led to improvements in the retrieval, a slight overestimation ofDe by TOVS
for clouds with small emissivity could be explained by partial cloud cover or spatial
15
heterogeneity (Table 1 of R ¨adel et al., 2003). The better spectral resolution and the ad-ditional channels at wavelengths greater than 8.3 µm of AIRS lead to a slightly deeper sounding (see Fig. 8 of R ¨adel et al., 2003), which in the case of optically thicker clouds (see Fig. 15) leads therefore to largerDe(if one assumes thatDeincreases from cloud
top to cloud base are due to aggregation). From Fig. 15, we also observe that in
gen-20
eral, IWP increases withǫcld. We observe however a stronger increase by using AIRS
than by using TOVS. This is becauseDeobtained from AIRS also increases with ǫcld
. Moreover, the IWP distributions from AIRS become wider, whereas those from TOVS stay quite narrow. This is probably due to the fact that the TOVS two channel method first determinesDeand then IWP fromDe andǫcld , whereas the AIRS multi-channel
25
ACPD
11, 24671–24725, 2011Bulk microphysical properties of semi transparent cirrus
from AIRS
A. Guignard et al.
Title Page
Abstract Introduction
Conclusions References
Tables Figures
◭ ◮
◭ ◮
Back Close
Full Screen / Esc
Printer-friendly Version Interactive Discussion
Discussion
P
a
per
|
Dis
cussion
P
a
per
|
Discussion
P
a
per
|
Discussio
n
P
a
per
|
5.4 Deparameterization
As mentioned in the introduction, cirrus bulk microphysical properties depend on many environmental factors. However, for modelling cirrus radiative effects in GCMs),Dehas
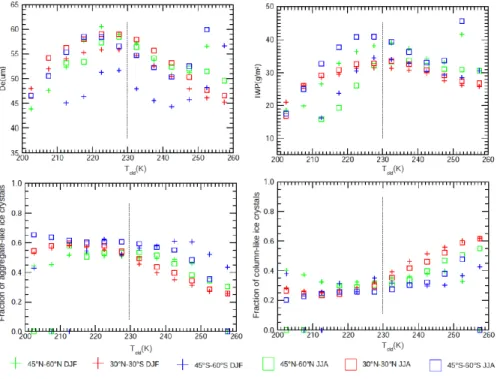
to be predicted from other variables. Simple relationships between temperature, ice water content andDe have been suggested (Kristjansson et al., 2000; Ou and Liou, 1995; Donovan and van Lammeren, 2002). Our global data set allows us to examine such relationships and to verify if a global parameterization may be found suitable for GCMs. Figure 16 presents the correlation between De and IWP, separately for the
three latitude bands, each for three cloud temperature intervals. A positive correla-tion exists between these two variables, already revealed by different field campaigns (Mitchell et al., 1996; Korolev et al., 2001). We note a rapid growth ofDefor IWP smaller
than 20 g m−2. For larger IWP values, the increase becomes weaker but remains strong compared to studies above where the relationship rapidly tends to become flatter. The same is true for the relationship betweenDeand IWP obtained from collocated
Scan-ner of Radiation Balance (ScaRaB) and TOVS data in Stubenrauch et al. (2007) (black dashed line). The difference in behaviour may be explained by the deeper sound-ing (see Sect. 5.2.2) and also by the fact that we only consider pure ice clouds with
Tcld<230 K, whereas retrieved microphysical properties for clouds with temperatures
lower than 260 K may contain smaller liquid water droplets. The parameterization ofDe
as a function of IWP that fits best the data observed at the global scale (full black line) is described by the expression:
De(IWP)= 4
X
i=0
αi·l n(IWP)i (4)
withα0=9.945,α1=−11.245,α2=27.426,α3=−9.192 andα4=0.974.
We studied the robustness of the parameterization by randomly separating the data set into two halves and refitting the data again. The coefficients were stable within
ACPD
11, 24671–24725, 2011Bulk microphysical properties of semi transparent cirrus
from AIRS
A. Guignard et al.
Title Page
Abstract Introduction
Conclusions References
Tables Figures
◭ ◮
◭ ◮
Back Close
Full Screen / Esc
Printer-friendly Version Interactive Discussion
Discussion
P
a
per
|
Dis
cussion
P
a
per
|
Discussion
P
a
per
|
Discussio
n
P
a
per
|
0.005. For a fixed IWP, when considering the different latitude bands and cloud tem-perature intervals, the overall spread of De is about 10 %. This indicates that De
de-pends strongly on IWP (which itself is also related to cloud temperature as shown in Fig. 6), and only slightly on cloud temperature in addition. Considering the different latitude bands, one even observes a different behaviour in tropics and mid-latitudes:
5
for cirrus with the same IWP,Deincreases withTcldin the tropics whereas it decreases
in the mid-latitudes.
Previous studies (Ivanova et al., 2001; Boudala et al., 2002; Edwards et al., 2007) used the temperature to parameterizeDe. We found that these parameterizations,
gen-erally established for clouds warmer than 230 K, underestimate the mean effective ice
10
crystal diameter by about 10 to 20 µm compared to our data (not shown). De varies
only about 10 to 20 µm within the temperature range between 200 and 230 K and the spread ofDefor a fixed temperature is also larger than the one for a fixed IWP, another
sign that the dependence on IWP is more important (Baran et al., 2009). Compared to a parameterization developed for in situ measurements at a specific latitude band
15
as for example by Boudala et al. (2002), it is difficult to determine a global multivari-ate parameterization for De dependent on both IWP and temperature, because IWP
and temperature present a weak dependence which varies with regions and seasons (Fig. 6).
Since field experiments presentDeparameterized as a function of ice water content
20
(IWC) (references above) and IR sounders only provide the integrated IWC (which is the IWP), we make use of the synergy with radar-lidar GEOPROF data to provide an estimation of IWC. Therefore, we determine IWC as the ratio between IWP and the ver-tical extent of the cloud layer, by assuming a verver-tically constant IWC. This assumption is only realistic for cirrus with a relatively small vertical extent (Seo and Liu, 2006).
25
Figure 16 presents the correlation between De and IWC, separately for the three
ACPD
11, 24671–24725, 2011Bulk microphysical properties of semi transparent cirrus
from AIRS
A. Guignard et al.
Title Page
Abstract Introduction
Conclusions References
Tables Figures
◭ ◮
◭ ◮
Back Close
Full Screen / Esc
Printer-friendly Version Interactive Discussion
Discussion
P
a
per
|
Dis
cussion
P
a
per
|
Discussion
P
a
per
|
Discussio
n
P
a
per
|
two variables, already revealed by different field campaigns ( Korolev et al., 2001; Mc Farquhar et al., 2003; Heymsfield et al., 2003; Garrett et al., 2004). We note a rapid growth of De for IWC smaller than 0.025 g m
−3
. For larger IWC values, the increase becomes weaker but flattens less compared to the studies above. One reason is that we only consider clouds with a relatively small vertical extent. We deduce further from Fig. 17 that for cirrus with low IWC,Deincreases more strongly for geometrically thicker
clouds than for geometrically thinner clouds. The parametrization ofDe as a function
of IWC that fits best the data obsreved at the global scale (full black lines) is described by the equation:
De(IWC)= 2
X
i=0
αi·ln(IWC)i (5)
with the following parameters for different vertical extents:
∆Z <1 km: α0=92.608α1=16.544, α2=−5.126
∆Z <2 km: α0=83.582, α1=3.981, α2=−6.319
Some GCMs use a parameterization of De as a function of IWC at each pressure
layer in which there is enough humidity to form clouds. The vertical cloud extent is determined by the number of adjacent cloud layers. However, it should be noted that this kind of parameterization depends for geometrically thicker clouds on the position relative to the cloud top. Therefore, it could be interesting for radiative flux computations
5
to use the parameterization betweenDeand IWP.
6 Conclusions
We have conducted a retrieval and a climatological analysis of the microphysical prop-erties of semi-transparent ice clouds using AIRS observations.
ACPD
11, 24671–24725, 2011Bulk microphysical properties of semi transparent cirrus
from AIRS
A. Guignard et al.
Title Page
Abstract Introduction
Conclusions References
Tables Figures
◭ ◮
◭ ◮
Back Close
Full Screen / Esc
Printer-friendly Version Interactive Discussion
Discussion
P
a
per
|
Dis
cussion
P
a
per
|
Discussion
P
a
per
|
Discussio
n
P
a
per
|
The retrieval is based on a look-up table approach, for which cirrus emissivities in the spectral range between 8 and 12 µm have been simulated as a function of De
and IWP. Therefore single scattering properties of randomly oriented column-like or aggregate-like ice crystals, distributed according to a bimodal-Γsize distribution, have been implemented into the radiative transfer model 4A-OP. Sensitivity studies lead in
5
general to the same conclusions as an earlier study using TOVS data R ¨adel et al. (2003), with even lower uncertainties linked to assumptions of atmospheric parameters and horizontal homogeneity (in general less than 5 %), essentially because of spatial and spectral resolution improvements of the AIRS instrument. Uncertainties due to ice crystal habit are also small (less than 5 %). Nevertheless, the use of six channels
10
between 8.5 and 12.5 µm allows a distinction between column-like and aggregate-like ice crystals.
Our retrieval is applicable to clouds with an effective emissivity from 0.2 to 0.85, compared to a range from 0.3 to 0.85 for a retrieval using TOVS data. By studying the relationship between retrieved bulk microphysical properties and cloud
tempera-15
ture, we revealed that pure ice clouds exist only at temperatures below 230K, which is consistent with theoretical and in-situ studies. Therefore, our retrieval of bulk mi-crophysical properties only considers semi-transparent high ice clouds (ST-HIC) that represent almost 15 % of all clouds and up to 30 % of high clouds during midlatitude winter.
20
For these clouds,Deand IWP increase with cloud temperature. The averages of
ef-fective emissivity, IWP andDe, as well as the vertical extent and the amount of multiple
cloud layers, present a strong seasonal cycle in the mid-latitudes, the larger values be-ing associated with winter storm-tracks, in contrary to the tropics that present constant middle range values. Whereas the NH mid-latitudes show more seasonal difference in
25
effective cloud emissivity and vertical extent, the SH mid-latitudes show a larger sea-sonal difference inDe, IWP and fraction of aggregate-like ice crystal habit. In general
ACPD
11, 24671–24725, 2011Bulk microphysical properties of semi transparent cirrus
from AIRS
A. Guignard et al.
Title Page
Abstract Introduction
Conclusions References
Tables Figures
◭ ◮
◭ ◮
Back Close
Full Screen / Esc
Printer-friendly Version Interactive Discussion
Discussion
P
a
per
|
Dis
cussion
P
a
per
|
Discussion
P
a
per
|
Discussio
n
P
a
per
|
differences have to be studied further in relation with dynamical parameters. Concern-ing the estimation of ice crystal shape, on a global scale and consistent with in-situ measurements, the most representative shape appears to be aggregate-like. On the other hand, the column-like ice crystal shape dominates over land.
The use of the Radar-Lidar GEOPROF data demonstrates that the retrieved bulk
5
microphysical properties depend essentially on cloud optical thickness (or emissivity) and are almost independent of their vertical extent.
The comparison with TOVS has shown a good agreement on the overall distribu-tions. Nevertheless, it appears that the better spatial resolution and deeper sounding of AIRS due to the use of additional channels leads to an increased sensitivity on
mi-10
crophysical properties for optically thin and thicker cirrus. Whereas IWP increases with effective cirrus emissivity in both datasets, the IWP distributions obtained from AIRS are broader, becauseDealso increases, in contrary to those retrieved from TOVS.
The large extent of this global study, the reliability of the method and consistency with in-situ measurements allowed us to study relations between cloud bulk microphysical
15
properties of relevance to GCM parametrizations. Whereas the relationship between
De and cloud temperature is only weak and depends on many other factors, we have
shown that a parameterization of De as a function of IWP is more robust than one
as a function of temperature. The spread of De due to other factors is only about
10%. By using the synergy with Radar-Lidar GEOPROF data and assuming a vertically
20
constant IWC, we have also investigated a parameterization ofDeas a function of IWC
for cirrus with relatively small vertical extent.However, it should be noted that this kind of parameterization depends for geometrically thicker clouds on the position relative to the cloud top.
Therefore, it could be interesting for radiative flux computations to use a
parameter-25
ization betweenDeand IWP, before De and IWC profiles have been investigated on a
global scale, for example using CALIPSO and CloudSat.
ACPD
11, 24671–24725, 2011Bulk microphysical properties of semi transparent cirrus
from AIRS
A. Guignard et al.
Title Page
Abstract Introduction
Conclusions References
Tables Figures
◭ ◮
◭ ◮
Back Close
Full Screen / Esc
Printer-friendly Version Interactive Discussion
Discussion
P
a
per
|
Dis
cussion
P
a
per
|
Discussion
P
a
per
|
Discussio
n
P
a
per
|
Acknowledgements. This work has been financially supported by CNRS and CNES. The au-thors thank the members of the AIRS, CALIPSO and CloudSat science teams for their efforts and cooperation in providing the data as well as the engineers and space agencies who control the quality of the data. We also want to thank our colleagues from the Atmospheric Radiation Analysis ( ARA) group at Laboratoire de M ´et ´eorologie Dynamique for technical support.
5
The publication of this article is financed by CNRS-INSU.
References
Ackerman, S. A., Smith, W. L., Collard, A. D., Ma, X. L., Revercomb, H. E., and Knuteson,
10
R. O.: Cirrus cloud properties derived from high-spectral resolution infrared spectrometry during FIRE II, Part II: Aircraft HIS results, J. Atmos. Sci., 52, 4246–4263, 1995. 24673 Arnott, W. P., Dong, Y. Y. and Hallett, J.: Extinction efficiency in the infrared A218 mmB of
laboratory ice clouds: observations of scattering minima in the Christiansen bands of ice, J. Opt. Soc. Am., 34, 541–551, 1995.
15
Aumann, H. H., Chahine, M. T., Gautier, C., Goldberg, M. D., Kalnay, E., McMillin, L. M., Revercomb, H., Rosenkranz, P. W., Smith, W. L., Staelin, D. H., Strow, L. L., and Susskind, J.: AIRS/AMSU/HSB on the Aqua mission: Design, science objectives, data products, and processing systems, IEEE T. Geosci. Remote, 41, 253–264, 2003. 24674
Baran, A. J. and Francis, P. N.: On the radiative properties of cirrus cloud at solar and thermal
20
wavelengths: A test of model consistency using high-resolution airborne radiance measure-ments, Q. J. Roy. Meteor. Soc.,130, 763–778, 2004. 24676
Baran, A. : On the scattering and absorption properties of cirrus cloud, J. Quant. Spectrosc. Ra., 89, 17–36, 2004.
Baran, A. J., Connolly, P. J., and Lee, C.: Testing an ensemble model of cirrus ice crystals using