MicroRNA-499 Expression Distinctively
Correlates to Target Genes
sox6
and
rod1
Profiles to Resolve the Skeletal Muscle
Phenotype in Nile Tilapia
Pedro G. Nachtigall1☯, Marcos C. Dias2,3☯, Robson F. Carvalho2, Cesar Martins2, Danillo Pinhal1*
1Department of Genetics, Institute of Biosciences, Sao Paulo State University (UNESP), Botucatu, Sao Paulo, 18618-970, Brazil,2Department of Morphology, Institute of Biosciences, Sao Paulo State University (UNESP), Botucatu, Sao Paulo, 18618-970, Brazil,3Health Sciences Institute, Federal University of Mato Grosso (UFMT), Sinop, Mato Grosso, 78550-000, Brazil
☯These authors contributed equally to this work. *[email protected]
Abstract
A class of small non-coding RNAs, the microRNAs (miRNAs), has been shown to be essen-tial for the regulation of specific cell pathways, including skeletal muscle development, maintenance and homeostasis in vertebrates. However, the relative contribution of miRNAs for determining the red and white muscle cell phenotypes is far from being fully compre-hended. To better characterize the role of miRNA in skeletal muscle cell biology, we investi-gated muscle-specific miRNA (myomiR) signatures in Nile tilapia fish. Quantitative (RT-qPCR) and spatial (FISH) expression analyses revealed a highly differential expression (forty-four-fold) of miR-499 in red skeletal muscle compared to white skeletal muscle, whereas the remaining known myomiRs were equally expressed in both muscle cell types. Detailed examination of the miR-499 targets through bioinformatics led us to thesox6and
rod1genes, which had low expression in red muscle cells according to RT-qPCR, FISH, and protein immunofluorescence profiling experiments. Interestingly, we verified that the high expression of miR-499 perfectly correlates with a low expression ofsox6androd1 tar-get genes, as verified by a distinctive predominance of mRNA destabilization and protein translational decay to these genes, respectively. Through a genome-wide comparative analysis of SOX6 and ROD1 protein domains and through anin silicogene regulatory net-work, we also demonstrate that both proteins are essentially similar in vertebrate genomes, suggesting their gene regulatory network may also be widely conserved. Overall, our data shed light on the potential regulation of targets by miR-499 associated with the slow-twitch muscle fiber type phenotype. Additionally the results provide novel insights into the evolu-tionary dynamics of miRNA and target genes enrolled in a putative constrained molecular pathway in the skeletal muscle cells of vertebrates.
OPEN ACCESS
Citation:Nachtigall PG, Dias MC, Carvalho RF, Martins C, Pinhal D (2015) MicroRNA-499 Expression Distinctively Correlates to Target Genes
sox6androd1Profiles to Resolve the Skeletal Muscle Phenotype in Nile Tilapia. PLoS ONE 10(3): e0119804. doi:10.1371/journal.pone.0119804
Academic Editor:Rossella Rota, Ospedale Pediatrico Bambino Gesu', ITALY
Received:July 11, 2014
Accepted:February 2, 2015
Published:March 20, 2015
Copyright:© 2015 Nachtigall et al. This is an open access article distributed under the terms of the
Creative Commons Attribution License, which permits unrestricted use, distribution, and reproduction in any medium, provided the original author and source are credited.
Data Availability Statement:All relevant data are within the paper and its Supporting Information files.
Introduction
Skeletal muscle fibers are cylindrical multinucleate cells of the skeletal muscle tissue. In verte-brates, muscle tissue displays two distinct cell-dependent phenotypes, whose categorization is based on the prevalence of fast-twitch or slow-twitch fibers. Fast-twitch fibers are paler-colored muscle cells (white muscle) with larger diameter than slow-twitch fibers. Since fast-twitch fi-bers have less sarcoplasm and more prominent cross-striping, they are used for forceful and rapid contractions over short periods of time [1,2]. Slow-twitch fibers are small, dark muscle cells (red muscle) that are rich in mitochondria and myoglobin but poor in sarcoplasm, with only faint cross-striping. These cells are designed for slow but repetitive contractions over long periods of time [3]. Dissimilarities between red and white muscle cells in functionality, physiol-ogy, and tissue organization are well documented, but the regulation of gene expression pro-grams underlying muscle cell fate, which involves their differentiation and maintenance over time, remain unclear.
In this context, an abundant class of small endogenous non-coding RNA molecules (17–
25nt), the microRNAs (miRNAs), has been recognized as posttranscriptional regulators of gene expression. Widely distributed and highly conserved in animal genomes, miRNAs play pivotal regulatory roles and participate in virtually all cellular processes [4]. It is well docu-mented in distinct types of cells from various organisms that miRNA expression varies tempo-rally and spatially, which broadly contributes to producing variable target mRNA and protein expression profiles. Consequently, embryos at distinct developmental stages, as well as tissues and organs from adults, usually show cell-type specific miRNA signatures [5]. In fact, recent studies on mammals have proven that miRNAs are highly enriched or specifically expressed in muscle cells (where they are referred to as myomiRs). MyomiRs act in an intricate gene net-work regulating cell (fiber) type switching, among other key roles in muscle development and homeostasis [6–8]. Interestingly, experiments carried out on fruit flies (Drosophila
melanoga-ster)and zebrafish (Danio rerio) have led to similar conclusions, implying that molecular
mechanisms regulated by myomiRs may be widely conserved through metazoa [9–12]. Howev-er these reports wHowev-ere gathHowev-ered from early embryos, thHowev-erefore requiring deep examination of new taxa and at later developmental life stages (differentiated adult tissues) to attest myomiRs conservation.
Another aspect of miRNAs function is that they can modulate the signal transduction path-ways by targeting multiple genes (even hundreds of targetspermiRNA), and a single mRNA displays multiple 3’UTR binding sites for different miRNAs [13]. In this sense, miRNAs-target relationships have evolved in distinct contexts, in which miRNAs may sharpen developmental transitions, act as cell-fate switches, support developmental identity, fine-tune gene expression or insulate target genes expression by reducing transcriptome noise [14,15]. Since myomiRs display a variable set of relationships to target mRNAs, they may be integrated into multiple models of regulation.
Although it is well established that miRNAs promote mRNA cleavage or translational re-pression [16], the most prevalent effect derived from miRNA activity may differ among organ-isms. For the majority of target genes investigated so far, the miRNA-mediated effects have not been systematically elucidated. In the present work, we attempt to determine the connection between myomiR expression and muscle cell phenotype in the Nile tilapia,Oreochromis niloti-cus. We also intend to contribute for a better understanding of the miRNA regulatory mecha-nism (i.e., mRNA degradation or translation repression) potentially operating upon elected target genes
MyomiRs Expression and the Regulation of Muscle Cell Phenotype
Results
Quantitative and spatial expression of myomiRs
Analysis of myomiRs in the red and white skeletal muscle of Nile tilapia by qPCR revealed that miR-1, -133a, -133b, and -206 had a non-significant difference in expression between red and white muscle tissue (p>0.05,Fig. 1A). We also detected non-significant sex-biased differential expression for all myomiRs evaluated (S1 Fig.). Endogenous U6 snRNA and 18S rRNA were correspondingly expressed in red and white muscles proven to be suitable as reference genes for qPCR profiling in skeletal muscle tissue (S1 Table).
Spatial analysis by fluorescentin situhybridization (FISH) pinpointed myomiR expression to the sarcoplasmatic inner edge surrounding the contractile protein core of muscle fibers and at small spots within it. We envision that these are the translation sites of muscle fiber cells where myomiRs would have regulatory action over target mRNAs. Curiously, 1 and miR-206 shared an unpredicted tissue expression pattern (Fig. 1B-M). Both are detected not only in nuclear regions of muscle fibers, but also in connective cells of the endomysium and perimysi-um of Nile tilapia skeletal muscle (Fig. 1D).
Conversely, quantitative analysis revealed that miR-499 had forty-four times higher expres-sion in slow-twitch red fibers than in fast-twitch white fibers (p<0.001,Fig. 1A). The high ex-pression of miR-499 in red muscle was further confirmed by spatial fluorescent analysis (Fig. 1J-M). Such expression profiles were consistent with reports for mammalian, and embry-os of zebrafish and medaka (Oryzias latipes) [17–19]. Therefore, we directed our attention to investigate miR-499 features in detail, including target genes, potential regulatory mechanisms of target silencing, and functions in adult Nile tilapia skeletal muscle cells.
miR-499 target prediction and selection
Nearly 200 target genes containing binding sites in their 3’UTR for miR-499 were initially pre-dicted. In our strategy, the 3’UTRs of Nile tilapia were acquired by BLAST searches, and multi-ple alignments of genome sequences were carried out for Nile tilapia and other vertebrate species. After matching was confirmed, targets were screened using TargetScan. Then, genes with low scores (<1) were removed, leaving a group of twenty-five genes (S2 Table). From the remaining genes, we selected those with higher complementarity to miR-499, conserved 3’UTR binding sites, and known involvement in skeletal muscle biology. After this last filtering step, we selected target genessox6(SRY-sex-determining region box-6) androd1(regulator of
differ-entiation1) for better examination, as both genes have known functions in cell proliferation
Target gene transcripts and protein expression in red and white skeletal
muscle
The quantitative expression analysis ofsox6androd1mRNA was carried out in red and white skeletal muscles. Because miR-499 is intronic, its host genemyh7b(myosin heavy chain 7 beta,
ormyh14), which encodes a slow-twitch heavy chain myosin abundant in the red muscle of
fishes and mammals [23–25], was included as positive control. The genemyh7bwas forty-four times more expressed in the red muscle than in the white muscle of Nile tilapia (Fig. 3A). This result is in accordance with the miR-499 expression, although dissociation between intronic miRNAs and host genes has also been observed [26]. Nevertheless, target genes have shown contrasting mRNA expression levels between cell types. Notably,sox6mRNA was seven times
Fig 1. MyomiR expression profile in red and white skeletal muscle fibers of joined males and females adults of Nile tilapia fish.RT-qPCR shows gene expression levels of myomiRs miR-1, -133a, -133b, -206, and -499 between red and white muscle (A). Relative quantification (RQ) values are relative amount of transcripts shown on linear basis.*Statistically significant in comparison to white muscle (P<0.05). MicroRNA fluorescencein situhybridization with LNA probes demonstrates the tissue location of miR-1 at200xmagnification (B and C) and400xmagnification (D and E); miR-206 at200xmagnification (F and G) and400xmagnification (H and I); and miR-499 at200xmagnification (J and K) and400xmagnification (L and M) on red and white skeletal muscle fibers. The miR-1 and miR-206 are clearly expressed in muscle fibers and also connective tissue cells (arrow-head), whereas miR-499 is muscle-fiber-specific. RM = red muscle; WM = white muscle.
doi:10.1371/journal.pone.0119804.g001
less expressed in red muscle compared to white muscle, whereasrod1mRNA was two times more expressed in red muscle than in white muscle (sox6: RQ = 0.154, p = 0.001;rod1: RQ = 2.33, p = 0.001;Fig. 3A). FISH experiments also demonstrated the differential spatial expres-sion ofsox6androd1mRNA in red and white muscle cells (Fig. 3B-I).
Regarding protein, both SOX6 and ROD1 were clearly more abundant in white muscle, but they could not be detected in red muscle (Fig. 4). SOX6 and ROD1 were mainly expressed in translation sites of muscle fibers located in the sarcoplasmic inner edge surrounding the con-tractile protein core of muscle fibers and at small spots within it (S3 Fig.). These proteins were clearly specifically detected in muscle fiber cells with no visible FISH signal in the endomysium (Fig. 4D, H).
From qPCR and immunodetection results, we observed two strongly negative correlations. In white muscle, the low expression of miR-499 correlates with high translation ofsox6and
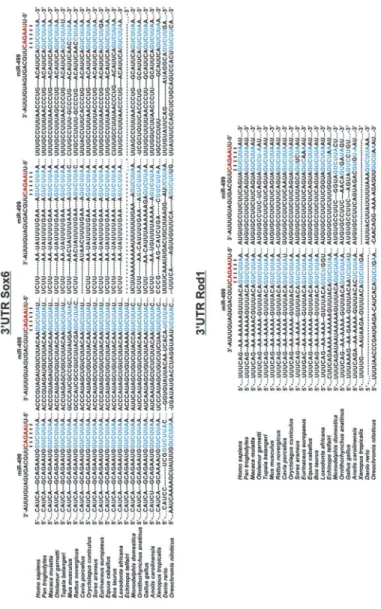
Fig 2. miR-499 binding sites at 3´UTR ofsox6androd1genes from 22 species of vertebrates.Red letters correspond to the seed regions of miR-499. Blue letters stand for complementary base pairing regions (microRNA recognition elements or MRE) at 3´UTR ofsox6androd1mRNAs. Dashes are manually inserted gaps, and dots represent continuity of the target mRNAs at both the 5' and 3' ends.
rod1mRNA into proteins. In red muscle, the opposite occurs, as the high expression of miR-499 correlates with low translation, and therefore with a scarce detection of both SOX6 and ROD1 proteins. However, in the latter case, when miR-499 was highly expressed, we found a clear difference in mRNA target levels with a very low expression ofsox6mRNA. This con-trasts with the diminished but still higherrod1mRNA levels (Fig. 4). In other words, our find-ings indicate that miR-499 high expression distinctively connects to the profiles of its target genes, as we detected a prevalence ofsox6mRNA destabilization contrasting to ROD1 transla-tional decay, which as better discussed below.
Fig 3.sox6androd1gene expression (miR-499 targets) in red and white skeletal muscle fibers of Nile tilapia.RT-qPCR shows gene expression levels ofsox6,rod1, andmyh7b(miR-499 host gene) between muscle cell types (A). Relative quantification values are shown on Log 2 basis.*Statistical significance in comparison to white muscle (P<0.05). RM = red muscle; WM = white muscle; RQ = relative amount of transcripts. Fluorescentin situ
hybridization demonstrates the spatial location ofsox6mRNA at200xmagnification (B and C) and400xmagnification (D and E) androd1mRNA at200x
magnification (F and G) and400xmagnification (H and I) in red and white muscle fibers.
doi:10.1371/journal.pone.0119804.g003
Fig 4. Immunoexpression of SOX6 and ROD1 in red and white skeletal muscle fibers of Nile tilapia.Fluorescent immunostainning demonstrates the SOX6 protein expression at200xmagnification (A and B) and400xmagnification (C and D) and ROD1 protein expression at200xmagnification (E and F) and400xmagnification (G and H) on red and white muscle fibers. Both of them are expressed only in muscle fiber. RM = red muscle; WM = white muscle.
Target genes domains and regulatory network
After measuring the mRNA transcript and protein abundance of SOX6 and ROD1, we looked at their peptide sequences in several vertebrate species. This comparative analysis revealed that both proteins have highly conserved functional domains within the vertebrate genomes exam-ined (Fig. 5A). Once protein functions are determined by the interactions of their functional domains [27], the conservation of SOX6 and ROD1 domains throughout vertebrates would be indicative of conserved protein-protein interactions (PPIs), and consequently, of evolutionary conserved gene regulatory networks. Then, to further explore SOX6 and ROD1 PPIs in muscle cells, we constructed a putative skeletal muscle gene regulatory network based on PPIs and added recognized miR-499 target interactions (Fig. 5B).
We also performed gene ontology (GO) pathway analysis based on GO term enrichment. This analysis supports the relationship of all associated genes in the network as part of the skel-etal muscle regulatory network (S3 Table).Fig. 5Bshows that the miR-499 network has many interconnections of other myomiRs, proteins, and transcriptional factors associated with dis-tinctive functional categories from regulatory pathways to muscle cell development, prolifera-tion, and differentiaprolifera-tion, meaning they might overlap in such critical processes.
Discussion
Several studies focusing on miRNA gene expression analysis have been carried out on verte-brates with aims to elucidate the real functional significance of myomiRs in distinct fundamen-tal pathways, such as embryonic development, gain or loss of muscle mass, physiology, and
Fig 5. Comparative analysis of protein domains andin silicoprediction of protein-to-protein interactions (PPI) in the miR-499 gene regulatory network.(A) Alignment of SOX6 and ROD1 sequences retrieved from representatives of the main vertebrate groups. (B) mir-499 gene regulatory network based on PPI filtered using gene ontology. miR-499 are indicated as blue nodes and other myomiRs as white nodes, whereas green nodes correspond to miR-499 target genes evaluated. Transcription factors are shown as dashed-line border nodes, and validated interactions are shown as thick-line bridges.
doi:10.1371/journal.pone.0119804.g005
maintenance and differentiation of muscle fiber types [28]. Indeed, most myomiR family mem-bers such as miR-1, -133, -206, and -499 were reported to be enriched in heart or skeletal mus-cle, fulfilling distinct roles in transcriptional circuits that control skeletal muscle gene
expression [28–30]. Functionally, miR-133 enhances myoblast proliferation during embryonic development, while miR-206 controls the re-innervation and maintenance of neuromuscular junctions and terminal differentiation of myoblasts [31,32]. The miR-1 is critical for myoblast differentiation (as miR-206) and also contributes to the maintenance of the striated phenotype of muscle fibers in adults [29,33]. Whereas, miR-499 expression was shown to be essential for slow muscle fiber type specification and maintenance in some vertebrate species [6,18,19].
In this work, the analysis of myomiR expression in Nile tilapia indicated that miR-1, -133a, -133b, and -206 have equivalently low expression in red and white muscle, and they seem to have no major impact on the adult cell-specific phenotype. Nevertheless, even their basal ex-pression must be important for the control of targetsox6androd1mRNA and protein levels, as evidenced by the presence, in the human genome, of two miR-133a/b binding sites inrod1, as well as one miR-1/206 binding site insox6. Similarly, in zebrafish one binding site each was found for miR-133 and miR-1/206 in rod1, whereas only binding sites for miR-499 where de-tected insox6. Such findings suggest a putative conjugated fine-tuning effect of myomiRs-me-diated repression ofsox6androd1expression, resulting in the maintenance of the slow contractile pattern of the red skeletal muscle cells. Phenotypic and functional differences be-tween red and white muscle cells could be strongly associated with a remarkably high expres-sion of miR-499 in slow-twitch red fibers. This emphasizes the idea that miR-499 plays key roles in the differentiation and maintenance of the slow-twitch fiber phenotype in Nile tilapia skeletal muscle.
The overexpression of miR-499 in slow contractile machinery muscles was first described in mice by van Rooij and coworkers [6]. A related pattern of miR-499 expression was reported in zebrafish, medaka, and mandarin fish (Siniperca chuatsi) [18,19,34]. Furthermore, miR-499 transcription was found to be regulated bysox6in a feedback-like response mechanism in zeb-rafish and mammals [6,26]. In the zebrafish-described mechanism,sox6downregulation is me-diated by an initial inhibitory action ofprdm1athat activates the transcription ofmyh7b, together with its intronic miR-499 [18,35]. As a result, miR-499 further decreasessox6 expres-sion, thus bolstering high miR-499 expression.
In Nile tilapia, we demonstrated for the first time that high miR-499 expression in slow-twitch fibers corresponds with both mRNA target cleavage and translational repression ofsox6 androd1genes. However, remarkably, miR-499 expression occurs at distinctive magnitudes in skeletal red and white muscle cells of Nile tilapia adults. In this sense, our data suggest that miR-499-mediated target repression matches with a reduction in both mRNA and protein lev-els ofsox6. In contrast, translational-repression prevails forrod1, which suggests decreased translation with a slight mRNA change.
A feasible explanation for ROD1 decay as the major mechanism induced by miR-499 might be related to the limited number of functional miR-499 binding sites on 3’UTR of mRNA (see
S2B Fig.). Indeed, a specific miRNA can inhibit gene expression by multiple different mecha-nisms on individual target genes, and individual miRNAs neither act alone nor target only a unique gene within a network [36]. In this scenario, miR-499 binds on 3´UTR and represses ROD1 translation, probably by competing for cap binding or elF6/60S, inducing mRNA deade-nylation or nascent peptide destruction, blocking translation elongation, or inducing a drop-off in ribosome complex [37].
same correlational pattern for miR-499 androd1despite of being performed in distinct muscle cells (i.e., cardiac and skeletal muscle). Furthermore, we found a significant reduction in the sox6transcripts in slow-twitch fibers of Nile tilapia, indicating that miR-499 might inducesox6 mRNA destabilization and cleavage, leading to protein decay. One interpretation of these re-sults is that the different types of regulatory mechanisms can be dependent on the number of target sites on 3’UTR of each gene, which is constituted by four target sites onsox6and two tar-get sites onrod1(Fig. 2).
We detected conserved protein domains and miR-499 binding sites onsox6androd1 3’UTR in several vertebrate groups. Such findings give strong evidence for addingrod1into the
prdm1a/miR-499/sox6gene regulatory network, described to play important roles for red
mus-cle differentiation and homeostasis in zebrafish [18]. Therod1gene would act indirectly on this network vianrd1,ncor2,hdac1, andrb1genes. Furthermore, ROD1 is a protein that can bind directly to RNA molecules and modulate the cell differentiation in adult tissues [38]. This protein is also downregulated in slow-twitch muscle, as evidenced in mouse (Mus musculus) and human myocardium cells [17]. In the slow-twitch muscle of Nile tilapia. ROD1 was also found to have low expression (Fig. 4E,G).rod1transcripts were actually detected in myosatel-lite cells that are fiber precursor stem cells living in the myocardium and skeletal muscle of ver-tebrates [17,39].rod1is a gene that negatively regulate differentiation in cellular process through ROD1 binding in RNA target molecules [38]. Thus, considering we found ROD1 was low expressed within the slow muscle and miR-499 was highly expressed, myosatellite cells would differentiate in slow-twitch phenotype muscle fibers,.
We found that the miR-499 regulatory network (Fig. 5) congregates genes associated with skeletal muscle development, differentiation, maintenance, and homeostasis. Our network based on Nile tilapia data expanded upon the previously reported gene regulatory network in zebrafish [18]. Specifically, we could detect many prospective regulatory elements (e.g.rod1 gene) that could be added into the muscle cell network, which may serve as reference for future studies aimed at a better characterization of the complex scenario involved in the determina-tion of the skeletal muscle cell phenotype. Furthermore, the high conservadetermina-tion of target miRNA recognition element sequences (MREs) into 3'UTR binding sites and the similarity of protein domains verified byin silicopredictions of PPIs also are noteworthy, considering the hypothesis that the miR-499 network may be functionally widely conserved in higher verte-brates, from fish to mammals. However, future experiments must be carried out to eliminate a possible caveat for the interaction and modulation activities ofrod1on theprdm1a/miR-499/ sox6gene regulatory network in fish and mammals.
Concluding Remarks
In summary, we have used quantitative andin situexpression associated with gene network and protein sequence analysis to assign a prospective function to miR-499 and target genes sox6androd1in regulating fish skeletal muscle cells. Although the knowledge on miR499 func-tion in Nile tilapia can only be assigned by using direct evidence through inhibifunc-tion-type stud-ies, previous functional studies on other species as well as our spatial and quantitative data (enhanced with protein domain conservation analysis) lead to the establishment of a robust correlation, and it is an indicative of the important role of miR-499 in establishing the white and red muscle tissue phenotype. Also, from protein and mRNA expression data, a distinctive imbalance in mRNA cleavage/translational repression ofsox6androd1was pioneering re-ported in fish species. Finally, we recognize that other elements, such as transcription factors, or factors acting on mRNA and protein turnover, may be important in regulating the white and red muscle tissue specific expression ofsox6androd1[15]. We also can not rule out the
existence of a signaling crosstalk among myosatellite, fast and slow muscle cells, given that the intercellular mobility of miRNAs confer robustness to gene expression, which is critical in sharpening the interface between target expression domains [40,41]. For these reasons we pro-posed a miR-499 gene network (also referring to other myomiRs) that underpins novel associa-tions of genes potentially shaping muscle tissue phenotype, thus providing a likely scenario for the evolutionary dynamics of constrained molecular pathways in the genome of vertebrates.
Materials and Methods
Animals and sampling
The Nile Tilapia samples used in this study were obtained from the Royal Fish farm (Jundiaí, Brazil) and maintained at 25±2°C with 12-h light-dark cycles in the Fish Room of the Integra-tive Genomics Laboratory at Sao Paulo State University—UNESP (Botucatu, Brazil). All ani-mals were handled in accordance with ethical principles for animal research adopted by the local Ethical Commission for Animal Experimentation (CEUA) of the Sao Paulo State Univer-sity. The experimental protocol of this study was approved by CEUA (protocol number: 352/ 11).
The adults of Nile Tilapia (16 individuals, 8 males and 8 females) were anesthetized with 50 mg/L tricaine-methanesulfonate (MS-222; Sigma-Aldrich, USA) and sacrificed prior to collec-tion of tissue samples. Red and white muscle samples were processed for real-time qPCR reac-tion orin situhistological detection of microRNAs, target mRNAs, and proteins. Muscle samples were immediately cooled in liquid nitrogen and stored at -80°C until either RNA ex-traction for qPCR or 10-μm-thick sectioning in a -20°C cryostat for fluorescentin situ hybrid-ization (FISH) and immunofluorescence labeling.
Target prediction and
in silico
analysis of miR-499 gene regulatory
network
Prediction of miR-499 targets was performed using the online algorithm TargetScan (http:// www.targetscan.org/; release 6.2). Three features were considered for the selection of miR-499 target genes: (a) the number of binding sites on miRNA recognition element sequences (MRE); (b) sequence similarity between miRNA and MRE; and (c) known biological functions of target genes. 3’UTR sequences of putative target genes from 22 vertebrate species were recovered from USCS Genome Browser (https://genome.ucsc.edu/) and aligned in the MUSCLE algo-rithm using default parameters [42]. The conservation of miR-499 binding sites was then ana-lyzed in MEGA 5 [43]. Beforehand, the 3’UTR of putative target genes from vertebrate species were subjected to BLAST searches against the genome of Nile tilapia for the identification of their orthologs. Also, in order to confirm 3’UTR locations in their respective genes, searches were carried out in Ensembl Genome Browser [44] (Sox6—ENSONIG00000006148; and Rod1—ENSONIG00000012535). The minimum free energy between miR-499 and each target site sequence from 3’UTRs of Nile tilapia was calculated with RNAhybrid [22].
Human information was preferably recovered once interactions and proteins are better elucidated and annotated in the human genome.
In this way, the gene interaction network was built to find known and predicted protein-protein interactions (PPI) on regulatory genes linked to biological pathways in the skeletal muscle tissue. Sequences of prdm1a,sox6, andmyh7bgenes were uploaded to a String accord-ing to their known contribution for the prdm1a/miR-499/sox6gene regulatory network, as pre-viously described [18]. After the insertion ofrod1and other gene partners into the biological network, the computational data source was exported and manually edited in Cytoscape 3.0.2 (http://cytoscape.org). In order to detect only muscle-related proteins in the predicted network, we analyzed the putative enriched terms in the“Biological Process”category in Gene Ontology by using the BiNGO app implemented on Cytoscape. No muscle-related proteins were trimmed out from the network.
RT-qPCR analysis of myomiRs and target genes
RT-qPCR was applied to evaluate the expression levels of miR-1, -133a, -133b, -206, and -499, along with target genessox6androd1, in red and white muscle samples of male and female specimens of Nile tilapia adults. These myomiR family members where choosen based on their distinct roles in transcriptional circuits that control skeletal muscle gene expression in other vertebrate species. The total RNA was extracted from snap-frozen specimens using Tri Reagent (Invitrogen/Life Technologies, CA, USA). Muscle samples were mechanically dissociated in 1 mL of ice-cold Tri Reagent using a T25 Digital UltraTurrax homogenizer (IKA, China). Total RNA samples were solubilized in RNase-free water (Sigma Aldrich, USA) and quantified by measuring UV-absorbance at 260 nm using a NanoDrop 1000 (Thermo Scientific, USA). RNA purity was ensured by obtaining A260/280ratio>1.8. The total RNA samples were then treated
with TURBO DNase (Ambion, USA) to ensure no genomic DNA contamination. RNA quality was assessed using an Agilent 2100 Bioanalyzer system (Agilent Technologies, USA), and only samples with RIN (RNA integrity number)>8.0 were used for RT-qPCR experiments.
The expression levels of myomiRs and target mRNA genes were measured in triplicate on a StepOnePlus Real-Time PCR System (Life-Technologies, USA) following MIQE guidelines [45]. MyomiRs were detected by miRNA cDNA synthesis (reverse transcription) and real-time qPCR amplification using TaqMan MicroRNA Assays (Life-Technologies, USA) following the manufacturer´s protocol. These standard qPCR assays contain probes and primers designed for zebrafish miRNAs (miR-1, -133a, -133b, -206 and -499), which are known to be mature miRNAs that are highly conserved among vertebrates.
The mRNA expression levels of miR-499 target genessox6androd1as well as genemyh7b (miR-499 host gene in vertebrates) were detected by total cDNA synthesis (reverse transcription) using a High-Capacity cDNA Reverse Transcription kit (Life Technologies, EUA), followed by real-time qPCR amplification using TaqMan Gene Expression Custom Assays (Life-Technolo-gies, USA) according to the manufacturer´s protocol. These qPCR assays were customized to contain probes and primers designed on exons sites of the investigated genes (highly conserved in fish), which were manually annotated on the Nile tilapia genome (available atBouillabase.org) with Geneious software. The accession numbers of reference sequences used to recover the geno-mic sequences of targets on NCBI were XM_001335708 (myh7b), XM_003440147 (rod1), and XM_003442295 (sox6). The two genes, the U6 snRNA (small nucleolar RNA), and the 18S rRNA (ribosomal RNA) were used for miRNA and target gene normalization, respectively, in all qPCR reactions. The sequence of all primers and probes used in this work are listed inS4 Table.
Efficiency and quantitative expression data analysis
Analysis of qPCR experiments was carried out with LinRegPCR and REST softwares [45,46]. LinRegPCR was used to assess the efficiency of each individual qPCR reaction and represented the gold standard method for quantitative expression experiments using a probe-based approach. This efficiency calculation method is considered a good estimator for the“real efficiency,” be-cause data evaluation is calculated in the exponential phase of PCR amplification [46]. All reac-tions with efficiency>0.750 were approved for subsequent analysis (S5 Table). REST was used to calculate the individual expression levels by“Pair-Wise Fixed Reallocation Randomization Test”and relative quantification (RQ). Statistical significance was accepted for p<0.05.
Fluorescent
in situ
hybridization detection of miRNAs and mRNAs
The miR-1, miR-206, and miR-499 were detected by fluorescentin situhybridization (FISH) with miRCURY LNA microRNA Detection probes (Exiqon, Denmark). Standardin situ hy-bridization reactions were performed as described [47]. We did not analyze the muscle-specific microRNAs miR-133a and miR-133b byin situhybridization due to their genomic organiza-tion into clusters miR-1/133a and miR-206/133b [48]. FISH reactions were performed on 10-μm-thick cryosection slides using LNA-specific probes and signal amplification detected with an HNPP Fluorescent Detection Set (Roche, Germany) following manufacturer´s proto-col. Nuclear counterstaining was assessed by DAPI. Controls were performed using LNA miR-scrambled and LNA U6 snRNA probes (Exiqon, Denmark) (S4 Fig.).We also performed fluorescentin situlocalization ofmyh7b,sox6, androd1genes on 10-μm-thick cryosection slides from the red and white muscle of Nile tilapias. Specific DNA biotin-labeled probes complementary to the target gene sequences were synthetized by PCR with biotin-labeled nucleotides using tilapia red and white muscle pool RNA template. Like the primers and probes designed previously, the primers used to generate DNA probes for this step were constructed in exon intersection sites (CDS sequence) of the target genes manually anno-tated on the Nile tilapia genome. We used the forward 50 -TGGCAGGTGTATCCCCGA-GAGC-30and reverse 50-AGCTCCTGTGGTGGCTGCCT-30primers for tilapiamyh7bprobe synthesis; forward 50-GCTGCACAGTCTGCTTCATG-30and reverse 50 -TGTGGGGAAGTG-GAATTGTTC-30for tilapiasox6; and forward 50-TGCATCCCATCGCGGGTCCT-30and re-verse 50-TGGTGGGTGTGGCTGAGGTGT-30for tilapiarod1. Thus, probe synthesis was carried out by adding 0.00672 mM of 16-biotin-dUTP (Roche, Germany) into a PCR master mix containing 3.2 mM dATP, 3.2 mM dCTP, 3.2 mM dGTP, 1.92 mM dTTP, 0.252 mM of each forward and reverse specific primer, 1x PCR buffer, 2.5 mM MgCl2, 1 unity of Taq
Plati-num, and template-mixed cDNA from red and white muscle samples of Nile tilapia. The PCR products (DNA probes) were purified by ExoStar (Illustra, USA) and sequenced by Sanger to confirm the nucleotide sequence composition [49]. The fluorescentin situdetection of target genes was performed on 10-μm-thick cryosection slides using the DNA-specific probes and sig-nal amplification identified by an HNPP Fluorescent Detection Set (Roche, Germany) following the manufacturer´s protocol. Nuclear counterstaining was done with propidium iodide (Vector Laboratories Inc., USA) at room temperature for 5 minutes. Images were acquired with an Olym-pus BX61 fluorescence microscope coupled to a DP71 digital camera (OlymOlym-pus, Japan).
Immunofluorescence detection of SOX6 and ROD1 proteins in muscle
cells
controls lacking primary and/or secondary antibodies were also investigated to ensure maxi-mum specificity. IF was performed on 10-μm-thick cryosection StarFrostplusslides using pri-mary antibodies polyclonal rabbit-IgG anti-SOX6 (1:100, Sigma-Aldrich, USA) and polyclonal rabbit-IgG anti-ROD1 (1:75, Abcam, USA). The permeabilization of tissue membranes was performed by digestion with proteinase K (10mg.ml-1) at 37°C for 5 minutes, and non-specific antibody attachment was blocked with nonfat milk diluted to 1% in PBS at room temperature for 60 minutes. The slides were then incubated overnight at 4°C with the primary antibodies as previously described.
After saline buffer washes, the slides were incubated with secondary antibody biotin-conju-gated anti-rabbit-IgG (1:200, Sigma-Aldrich, USA) at room temperature for 60 minutes. Detec-tion of antibody binding sites was done by repeated streptavidin FITC-conjugated (1:100, Life-Technologies, USA) and anti-FITC biotin-conjugated (Sigma-Aldrich, USA) addiction in slides at 37°C for 30 minutes. Nuclear counterstaining was done with propidium iodide (Vector Laboratories Inc., USA) at room temperature for 5 minutes. Images were acquired with an Olympus BX61 fluorescence microscope coupled to a DP71 digital camera (Olympus, Japan).
Supporting Information
S1 Fig. Sex-biased expression comparison of myomiRs in red and white muscle cells of Nile tilapia.RT-qPCR shows gene expression levels of myomiRs miR-1, -133a, -133b, -206, and -499 between males and females in red muscle (A) and white muscle (B). RM = red muscle; WM = white muscle.
(TIF)
S2 Fig. Bond strength between miR-499 and target sites at 3´UTR sequence ofsox6and rod1genes from Nile tilapia.Minimum free energy (MFE) in which green lines represents the
miR-499 sequence and red lines represent 4 microRNA recognition elements (MRE) onsox6 mRNA (A) or 2 MREs onrod1mRNA (B).
(TIF)
S3 Fig. ROD1 expression in the transitional interface of red and white muscle cells. Fluores-cent immunostainning demonstrates the difference of ROD1 expression in red, intermediate, and white muscles,200xmagnification. RM = red muscle; IM = intermediate muscle; WM = white muscle.
(TIF)
S4 Fig. Experimental controls of fluorescencein situhybridizations.U6 snRNA and scram-ble LNA probes detection at red (RM) and white (WM) muscles.
(TIF)
S1 Table. Expression of endogenous gene controls by qPCR.U6 snRNA and 18S rRNA were equivalently expressed in red and white skeletal muscle of Nile tilapia.
(TIF)
S2 Table. Predicted target genes for miR-499.List of 20 muscle-related predicted target genes for miR-499 in the human genome.
(TIF)
S3 Table. Top 20 enriched GO terms associated with skeletal muscle regulatory pathways.
Gene Ontology terms and corresponding genes related to predicted miR-499 gene regulatory network in vertebrates.
(TIF)
S4 Table. Primers used for the analysis of miR-499 target genes expression.
(TIF)
S5 Table. Values of efficiency of qPCR reactions as calculated in LinRegPCR.
(TIF)
Author Contributions
Conceived and designed the experiments: PGN MCD DP. Performed the experiments: PGN MCD. Analyzed the data: PGN MCD DP. Contributed reagents/materials/analysis tools: RFC CM DP. Wrote the paper: PGN MCD DP. Critically edited and revised drafts of the manu-script: PGN MCD RFC CM DP.
References
1. Driedzic WR, Hochachka PW. Control of energy metabolism in fish white muscle. Am J Phisiol. 1976; 230: 579–582. PMID:131493
2. Schiaffino S, Reggiani C. Fiber types in mammalian skeletal muscles. Physiol Rev. 2011; 91(4): 1447–
1531. doi:10.1152/physrev.00031.2010PMID:22013216
3. Pette D, Staron RS. Myosin isoforms, muscle fiber types, and transitions. Microsc Res Tech. 2000; 50 (6): 500–509. PMID:10998639
4. Berezikov E. Evolution of microRNA diversity and regulation in animals. Nat Reviews. 2012; 12: 846–
860.
5. Sood P, Krek A, Zavolan M, Macino G, Rajewsky N. Cell-type-specific signatures of microRNAs on tar-get mRNA expression. Proc Natl Acad Sci USA. 2006; 103: 2746–2751. PMID:16477010
6. van Rooij E, Quiat D, Johnson BA, Sutherland LB, Qi X, Richardson JA, et al. A family of microRNAs encoded by myosin genes governs myosin expression and muscle performance. Dev Cell. 2009; 17(5): 662–673. doi:10.1016/j.devcel.2009.10.013PMID:19922871
7. Small EM, O'Rourke JR, Moresi V, Sutherland LB, McAnally J, Gerard RD, et al. Regulation of PI3-ki-nase/Akt signaling by muscle-enriched microRNA-486. Proc Natl Acad Sci USA. 2010; 107(9): 4218–
4223. doi:10.1073/pnas.1000300107PMID:20142475
8. Ge Y, Chen J. MicroRNAs in skeletal myogenesis. Cell Cycle. 2011; 10(3): 441–448. PMID:21270519
9. Kwon C, Han Z, Olson EN, Srivastava D. MicroRNA1 influences cardiac differentiation inDrosophila
and regulates Notch signaling. Proc Natl Acad Sci USA. 2005; 102:18986–18991. PMID:16357195
10. Flynt AS, Li N, Thatcher EJ, Solnica-Krezel L, Patton JG. Zebrafish miR-214 modulates Hedgehog sig-naling to specify muscle cell fate. Nat Genet. 2007; 39(2): 259–263. PMID:17220889
11. Mishima Y, Abreu-Goodger C, Staton AA, Stahlhut C, Shou C, Cheng C, et al. Zebrafish miR-1 and miR-133 shape muscle gene expression and regulate sarcomeric actin organization. Genes Dev. 2009; 23: 619–632. doi:10.1101/gad.1760209PMID:19240126
12. Ketley A, Warren A, Holmes E, Gering M, Aboobaker AA, Brook JD. The miR-30 microRNA family tar-gets smoothened to regulate hedgehog signalling in zebrafish early muscle development. PLoS One. 2013; 8(6): e65170. doi:10.1371/journal.pone.0065170PMID:23755189
13. Guo H, Ingolia NT, Weissman JS, Bartel DP. Mammalian microRNAs predominantly act to decrease target mRNA levels. Nature. 2010; 466(7308): 835–840. doi:10.1038/nature09267PMID:20703300
14. Pase L, Lieschke GJ. Discerning differentin vivoroles of microRNAs by experimental approaches in zebrafish. In: Detrich HW, Westerfield M, Zon LI, editors. The Zebrafish: Genetics, Genomics and Infor-matics. Waltham: Academic Press; 2011. pp. 353–378.
15. Ebert M, Sharp P. Roles for microRNAs in conferring robustness to biological processes. Cell. 2012; 149: 515–524. doi:10.1016/j.cell.2012.04.005PMID:22541426
16. Bartel DP, Chen CZ. Micromanagers of gene expression: the potentially widespread influence of meta-zoan microRNAs. Nature. 2004; 5: 396–400.
17. Hosoda T, Zheng H, Cabral-da-Silva M, Sanada F, Ide-Iwata N, Ogórek B, et al. Human cardiac stem cell differentiation is regulated by a mircrine mechanism. Circulation. 2011; 123: 1287–1296. doi:10. 1161/CIRCULATIONAHA.110.982918PMID:21403094
19. Bhuiyan SS, Kinoshita S, Wongwarangkana C, Asaduzzaman M, Asakawa S, Watabe S. Evolution of the myosin heavy chain gene MYH14 and its intronic microRNA miR-499: muscle-specific miR-499 ex-pression persists in the absence of the ancestral host gene. BMC Evol Biol. 2013; 13: 142. doi:10. 1186/1471-2148-13-142PMID:24059862
20. Hagiwara N, Yeh M, Liu A. Sox6 is required for normal fiber type differentiation of fetal skeletal muscle in mice. Dev Dynamics. 2007; 236: 2062–2076. PMID:17584907
21. Sadvakassova G, Dobocan MC, Difalco MR, Congote LF. Regulator of differentiation 1 (ROD1) binds to the amphipathic C-terminal peptide of thrombospondin-4 and is involved in its mitogenic activity. J Cell Physiol. 2009; 220: 672–679. doi:10.1002/jcp.21817PMID:19441079
22. Kruger J, Rehmsmeier M. RNAhybrid: microRNA target prediction easy, fast and flexible. Nucleic Acids Res. 2006; 34: W451–W454. PMID:16845047
23. Cohen-Barak O, Yi Z, Hagiwara N, Monzen K, Komuro I, Brilliant MH. Sox6 regulation of cardiac myo-cyte development. Nucleic Acids Res. 2003; 31: 5941–5948. PMID:14530442
24. An C, Dong Y, Hagiwara N. Genome-wide mapping of Sox6 binding sites in skeletal muscle reveals both direct and indirect regulation of muscle terminal differentiation by Sox6. BMC Develop Biol. 2011; 11: 59.
25. Quiat D, Voelker KA, Pei J, Grishinc NV, Grange RW, Bassel-Duby R, et al. Concerted regulation of myofiber-specific gene expression and muscle performance by the transcriptional repressor Sox6. Proc Natl Acad Sci USA. 2011; 108(25): 10196–10201. doi:10.1073/pnas.1107413108PMID: 21633012
26. Bell ML, Buvoli M, Leinwand LA. Uncoupling of expression of an intronic microRNA and its myosin host gene by exon skipping. Mol Cell Biol. 2010; 30 (8): 1937–1945. doi:10.1128/MCB.01370-09PMID: 20154144
27. Vogel C, Bashton M, Kerrison N, Chothia C, Teichmann SA. Structure, function and evolution of multi-domain proteins. Curr Opinion Struc Bio. 2004; 14(2): 208–216. PMID:15093836
28. McCarthy JJ. The MyomiR network in skeletal muscle plasticity. Exerc Sport Sci Rev. 2011; 39(3): 150–154. doi:10.1097/JES.0b013e31821c01e1PMID:21467943
29. Chen JF, Mandel EM, Thomson JM, Wu Q, Callis TE, Hammond SM, et al. The role of microRNA-1 and microRNA-133 in skeletal muscle proliferation and differentiation. Nat Genet. 2006; 38: 228–233.
PMID:16380711
30. Gagan J, Dey BK, Dutta A. MicroRNAs regulate and provide robustness to the myogenic transcriptional network. Cur Op in Phar. 2012; 12: 1–6.
31. McCarthy JJ. MicroRNA-206: the skeletal muscle-specific myomiR. Biochim et Biophys Acta. 2008; 1779: 682–691. doi:10.1016/j.bbagrm.2008.03.001PMID:18381085
32. Williams AH, Valdez G, Moresi V, Qi X, McAnally J, Elliott JL, et al. MicroRNA-206 delays ALS progres-sion and promotes regeneration of neuromuscular synapses in mice. Science. 2009; 326: 1549–1554.
doi:10.1126/science.1181046PMID:20007902
33. Sweetman D, Goljanek K, Rathjen T, Oustanina S, Braun T, Dalmay T, et al. Specific requirements of MRFs for the expression of muscle specific microRNAs,miR-1, miR-206 and miR-133. Dev Biol. 2008; 321: 491–499. doi:10.1016/j.ydbio.2008.06.019PMID:18619954
34. Chu WY, Du S, Li HH, Li YL, Liu LS, Wang KZ, et al. Systematic identification and differential expres-sion profiling of MicroRNAs from white and red muscles ofSiniperca chuatsi. Curr Mol Med 2013; 13(8): 1397–1407. PMID:23826919
35. von Hofsten J, Elworthy S, Gilchrist MJ, Smith JC, Wardle FC, Ingham PW. Prdm1- and Sox6-mediated transcriptional repression specifies muscle fiber type in the zebrafish embryo. EMBO Rep. 2008; 9: 683–689. doi:10.1038/embor.2008.73PMID:18535625
36. Stadler M, Artiles K, Pak J, Fire A. Contributions of mRNA abundance, ribosome loading, and post- or peri-translational effects to temporal repression ofC.elegansheterochronic miRNA targets. Genome Res 2012; 22: 2418–2426. doi:10.1101/gr.136515.111PMID:22855835
37. Filipowicz W, Bhattacharyya SN, Sonenberg N. Mechanisms of post-transcriptional regulation by microRNAs: are the answers in sight? Nat Rev Genet. 2008; 9: 102–114. doi:10.1038/nrg2290PMID: 18197166
38. Yamamoto H, Tsukahara K, Kanaoka Y, Jinno S, Okayama H. Isolation of a mammalian homologue of a fission yeast differentiation regulator. Mol Cell Biol. 1999; 19: 3829–3841. PMID:10207106
39. Bearzi C, Leri A, Lo Monaco F, Rota M, Gonzalez A, Hosoda T, et al. Identification of a coronary vascu-lar progenitor cell in the human heart. Proc Natl Acad Sci USA. 2009; 106: 15885–15890. doi:10.1073/ pnas.0907622106PMID:19717420
40. Stark A, Brennecke J, Bushati N, Russell RB, Cohen SM. Animal MicroRNAs confer robustness to gene expression and have a significant impact on 3UTR evolution. Cell. 2005; 123: 1133–1146. PMID: 16337999
41. Levine E, McHale P, Levine H. Small regulatory RNAs may sharpen spatial expression patterns. PLoS Comput Biol, 3, p. e233.Edgar RC. Muscle: multiple sequence alignment with high accuracy and high throughput. Nucleic Acids Res. 2007; 32(5): 1792–1797.
42. Tamura K, Peterson D, Peterson N, Stecher G, Nei M, Kumar S. MEGA5: molecular evolutionary genet-ics analysis using maximum likelihood, evolutionary distance and maximum parsimony methods. Mol Biol Evol. 2011; 28: 2731–2739. doi:10.1093/molbev/msr121PMID:21546353
43. Flicek P, Amode MR, Barrell D, Beal K, Billis K, Brent S, et al. Ensembl 2014. Nucleic Acids Res. 2014; 42: D749–755. doi:10.1093/nar/gkt1196PMID:24316576
44. Bustin SA, Benes V, Garson JA, Hellemans J, Huggett J, Kubista M, et al. The MIQE guidelines: mini-mum information for publication of quantitative real-time PCR experiments. Clin Chem. 2009; 55(4): 611–622. doi:10.1373/clinchem.2008.112797PMID:19246619
45. Ramakers C, Ruijter JM, Deprez RHL, Moorman AFM. Assumption-free analysis of quantitative real-time polymerase chain reaction (PCR) data. Neurosci Lett. 2003; 339: 62–66. PMID:12618301
46. Pfaffl MW, Horgan GW, Dempfle L. Relative expression software tool (REST) for group-wise compari-son and statistical analysis of relative expression results in real-time PCR. Nucleic Ac Res. 2002; 30(9): e36 PMID:11972351
47. Obernosterer G, Martinez J, Alenius M. Locked nucleic acid basedin situdetection of microRNAs in mouse tissue sections. Nat Protoc. 2007; 2: 1508–1514. PMID:17571058
48. Tani S, Kuraku S, Sakamoto H, Inoue K, Kusakabe R. Developmental expression and evolution of mus-cle-specific microRNAs conserved in vertebrates. Evol Dev 2013; 15(4): 293–304. doi:10.1111/ede. 12039PMID:23809703
49. Nakajima RT, Cabral-de-Mello DC, Valente GT, Venere PC, Martins C. Evolutionary dynamics of rRNA gene clusters in cichlid fish. BMC Evol Biol. 2012; 12: 198. doi:10.1186/1471-2148-12-198PMID: