NHESSD
3, 5777–5804, 2015Effectiveness and efficiency of slot-check dam system on debris
flow control
Y. H. Zou and X. Q. Chen
Title Page
Abstract Introduction
Conclusions References
Tables Figures
◭ ◮
◭ ◮
Back Close
Full Screen / Esc
Printer-friendly Version Interactive Discussion
Discussion
P
a
per
|
Discussion
P
a
per
|
Discussion
P
a
per
|
Discussion
P
a
per
|
Nat. Hazards Earth Syst. Sci. Discuss., 3, 5777–5804, 2015 www.nat-hazards-earth-syst-sci-discuss.net/3/5777/2015/ doi:10.5194/nhessd-3-5777-2015
© Author(s) 2015. CC Attribution 3.0 License.
This discussion paper is/has been under review for the journal Natural Hazards and Earth System Sciences (NHESS). Please refer to the corresponding final paper in NHESS if available.
E
ff
ectiveness and e
ffi
ciency of slot-check
dam system on debris flow control
Y. H. Zou and X. Q. Chen
Key Laboratory of Mountain Hazards and Earth Surface Processes, Institute of Mountain Hazards and Environment, CAS, Chengdu, 610041, China
Received: 24 July 2015 – Accepted: 31 August 2015 – Published: 29 September 2015
Correspondence to: Y. H. Zou ([email protected])
Published by Copernicus Publications on behalf of the European Geosciences Union.
NHESSD
3, 5777–5804, 2015Effectiveness and efficiency of slot-check dam system on debris
flow control
Y. H. Zou and X. Q. Chen
Title Page
Abstract Introduction
Conclusions References
Tables Figures
◭ ◮
◭ ◮
Back Close
Full Screen / Esc
Printer-friendly Version Interactive Discussion
Discussion
P
a
per
|
Discussion
P
a
per
|
Discussion
P
a
per
|
Discussion
P
a
per
|
Abstract
Slot-check dam system is commonly used to control sediment transport associated with debris flows and mitigate debris flow hazards. This paper aims to estimate the per-formance of the slot-check dam system in the field and set up a verification to evaluate
the efficiency of a slot-check dam system and each subsystem in debris flow sediment
5
control. Field survey on a group of a series of slot-check dams at Shengou Basin in Yunnan, China reveals that the conserving sediment volume of each dam is related to its relative location in the group, gradually decreasing from upstream to downstream. The cumulative sediment volume within a subsystem of slot-check dams closely re-lated to the characteristics of the catchment controlled by the subsystem. It increases
10
with the controlled catchment area of the most downstream dam in subsystem and the distance from the dam to the upstream most. Evaluation models for the conserving
efficiency of a slot-check dam system on debris flow control in a river basin and each
subsystem within the group associate to the controlled catchment characteristics have been proposed. The layout principle of a slot-check dam system in a river basin has
15
been developed based on the conserving efficiency of a subsystem of slot-check dams
which would allow the slot-check dam system to be designed in a more scientific way.
1 Introduction
Debris flows are widely recognized as one of the dominant geomorphic processes in steep mountainous terrain (Remaître and Malet, 2010). Debris flows occur when
20
masses of poorly sorted sediment, agitated and saturated with water, surge down slopes in response to gravitational attraction. They can travel long distances in chan-nels with modest slopes and to inundate vast areas. Large debris flows can exceed
109m3 in volume and release more that 1016J of potential energy, but even
common-place flow of∼103m3can denude vegetation, clog drainage-ways, damage structures
25
and endanger humans (Iverson, 1997).
NHESSD
3, 5777–5804, 2015Effectiveness and efficiency of slot-check dam system on debris
flow control
Y. H. Zou and X. Q. Chen
Title Page
Abstract Introduction
Conclusions References
Tables Figures
◭ ◮
◭ ◮
Back Close
Full Screen / Esc
Printer-friendly Version Interactive Discussion
Discussion
P
a
per
|
Discussion
P
a
per
|
Discussion
P
a
per
|
Discussion
P
a
per
|
One of the most effective techniques to manage debris-flow hazards is to
con-struct series of check dams (Takahashi, 1981; Remaître and Malet, 2010; Chen et al., 2013; Fiebiger, 1997; Heumader, 2000; Huebl and Fiebiger, 2005; Hungr et al., 1987; Mizuyama, 2008). They play an important role in the management and development of a river basin (Busnelli et al., 2001). One of their most common functions is to enhance
5
sediment deposition, reducing the bed gradient and flow velocity in order to check soil erosion within a stream, such as a gully (Castillo et al., 2014).
Two kinds of check dams can be distinguished: closed and open (Busnelli et al., 2001; Li, 1997; Catella et al., 2005). Conventional closed check dams are overflowed by the water discharge and intercept all but the fine particles of the solid material.
10
Hence they are rapidly filled up by the sediment transport. Conversely, open check dams are constructed with suitable openings in the body of the structure, thus part of the sediment is allowed to pass through (Busnelli et al., 2001). Slot-check dam, an
open-type check dam with slot shaped openings, has been shown to be efficient in
reducing debris flow run-out (Remaître et al., 2008; Jia et al., 2011). If the opening
15
slots of the check dam are large enough, deposition upstream the check dam during ordinary events is negligible, its storage capacity is left available for the very large debris flows (Busnelli et al., 2001; Chen et al., 2013; Li, 1997).
Considerable theoretical and numerical works have been performed on the size, shape and structure of torrential check dams, allowing the definition of general design
20
criteria (Remaître and Malet, 2010; Armanini and Larcher, 2001; Han and Ou, 2004; Jia et al., 2011; Johnson and McCuen, 1989; Lien, 2003; Li, 1997; Catella et al., 2005; Shrestha et al., 2008). Some researchers studied the river bed variations after check dam system construction (Conesa-García et al., 2007; Xu et al., 2004; Zimmermann and Church, 2001). Less research has focused on the optimal number and location
25
of these dams along the debris-flow track (Osti and Egashira, 2008; Hassanli et al., 2009; Remaître and Malet, 2010) as well as the quantitative evaluation on slot-check
dam system efficiency in sediment control in the field (Remaître and Malet, 2010).
Pre-liminary study on the efficiency of the subsystem in a slot-check dam group has been
NHESSD
3, 5777–5804, 2015Effectiveness and efficiency of slot-check dam system on debris
flow control
Y. H. Zou and X. Q. Chen
Title Page
Abstract Introduction
Conclusions References
Tables Figures
◭ ◮
◭ ◮
Back Close
Full Screen / Esc
Printer-friendly Version Interactive Discussion
Discussion
P
a
per
|
Discussion
P
a
per
|
Discussion
P
a
per
|
Discussion
P
a
per
|
proposed (Zou et al., 2014). In the study, a new way for the analysis on the efficiency
of a slot-check dam group was provided. The conserving efficiency of the subsystem
within a slot-dam group was associated with catchment shape characteristics. But it was only focused on the contribution of a subsystem to the whole slot-check dam group. The efficiency of the single slot-check dam and the efficiency of the whole
slot-5
check dam system and its subsystem on the sediment control in a river basin were not evaluated. And it is important that more related catchment characteristics associated
with sediment erosion and dam parameters should be considered in the efficiency
eval-uation. Principle on the layout of a slot-check dam system in a debris flow river basin is also needed to be proposed for the mitigation of debris flow hazards.
10
This paper is aimed at evaluating the efficiency of the slot-check dam system and its subsystem in sediment control for the river basin. A quantitative method is proposed for estimating the efficiency of slot-check dam system in debris flow hazards mitigation. The layout principle of a slot-check dam system in a river basin is analyzed based on
the efficiency of a subsystem of slot-check dams on sediment control.
15
2 Study area
The study area is Shengou Basin in Dongchuan district, Kunming in China. Shengou Basin is a tributary of the right bank of Xiaojiang River, and a typical debris-flow gully in the mountainous regions of southwestern China (Fig. 1). It covers an area of about 32 km2 and is located in the northeastern Dongchuan district, extending 103◦09′07′′–
20
103◦15′00′′E and 26◦04′47′′–26◦09′03′′N. The basic parameters of Shengou Basin are listed in Table 1.
Shengou Basin pertains to a subtropical monsoon climate zone with distinct dry and wet seasons, vertical zoning and regional heavy rainstorm. It has an annual rainfall 600–1200 mm in the river valley and 700 mm in the alpine region. The precipitation in
25
the rainy season from May to October accounts for 88 % of total annual precipitation. Rainstorm and rain shower accounted for above half of the total annual precipitation.
NHESSD
3, 5777–5804, 2015Effectiveness and efficiency of slot-check dam system on debris
flow control
Y. H. Zou and X. Q. Chen
Title Page
Abstract Introduction
Conclusions References
Tables Figures
◭ ◮
◭ ◮
Back Close
Full Screen / Esc
Printer-friendly Version Interactive Discussion
Discussion
P
a
per
|
Discussion
P
a
per
|
Discussion
P
a
per
|
Discussion
P
a
per
|
The centers of rainstorms mainly occurred at the zone from 2500 to 3000 m in the river basin. The annual rate of rainstorm is 0.8–1.5 times per year, maximum rainfall intensity reached 123.6 mm in 24 h, 63.4 mm in 1 h and 20.8 mm in 10 min.
The water discharge in the river trench is about 0.5 m3s−1. Water level would sud-denly arise if rainstorm occurs and the flow discharge could be large than 100 m3s−1.
5
The peak discharge of flood with return year of 50 years is 169.2 m3s−1. Debris flows would properly occur in the rivers under the rainstorm with return year of 10 years.
Debris flows threaten the safety of more than 12 000 people living in Shengou Basin. The outburst of debris flow may damage the highway and railway at the downstream area and block Dabai river which Shengou river flows into. In order to control sediment
10
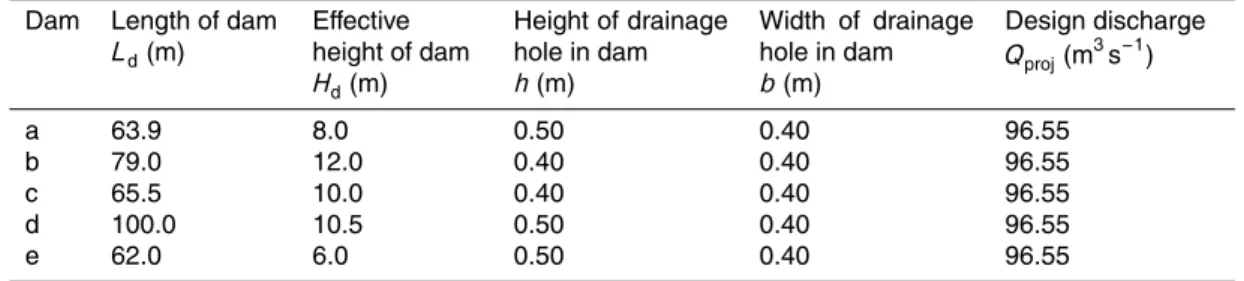
transport and mitigate debris flow hazards, a slot-check dam group with a series of five dams had been built in 2010 at the upper region of Shengou Basin (Figs. 1 and 2). The main characteristics of the slot-check dams are listed in Table 2.
3 Methodology
This research aims to assess the effectiveness of the chain of check-dams and a
in-15
dividual check dam through field survey and analytical study. Field survey had been
conducted to investigate the performance of the slot-check dams. The effectiveness
of the series of slot-check dams in sediment control has been verified from its stabil-ity resistant to the impact of debris flows, soil conservation function and downstream
erosion prevention. The efficiency to assess the function of the mitigation project has
20
been represented by several quantitative evaluation parameters. And the methodology of the derivation of efficiency has been given in the follows.
NHESSD
3, 5777–5804, 2015Effectiveness and efficiency of slot-check dam system on debris
flow control
Y. H. Zou and X. Q. Chen
Title Page
Abstract Introduction
Conclusions References
Tables Figures
◭ ◮
◭ ◮
Back Close
Full Screen / Esc
Printer-friendly Version Interactive Discussion
Discussion
P
a
per
|
Discussion
P
a
per
|
Discussion
P
a
per
|
Discussion
P
a
per
|
3.1 Efficiency of the slot-check dam system in sediment control
The efficiency of an individual check dam in the entire chain of check damsηdi:
ηdi =
vi
P
vn = vi
Vn. (1)
The efficiency of subsystem in the slot-check dam systemηsubs is to be established to
assess the role of a dam and the subsystem in the whole dam system. It can be
repre-5
sented by the ratio of the accumulated volume of deposit stored within the subsystem P
vi to the total sediment volume stored within the dam groupPvn:
ηsubsi = P
vi P
vn = Vi
Vn. (2)
The efficiency of a slot-check dam system in mitigating debris flow ηsys is to be
es-tablished to assess the role of the dam system in mitigating debris flow and sediment
10
control at the river basin. It can be represented by the ratio of the volume of sediment
stored within the storage of the dam groupP
vi to the possible surface erosion volume
of the regionV0:
ηsysi = P
vi V0
= Vi
V0
. (3)
Since the sediment volume in the river basin is related to the characteristics of the
15
catchment area and the rainfall factor in the area, the possible surface erosion volume of the region can be calculated as:
V0=f(Ra,∆p) (4)
whereRais the rainfall factor of debris flow in the river basin,
Ra=
nIr
Ia
(5)
20
NHESSD
3, 5777–5804, 2015Effectiveness and efficiency of slot-check dam system on debris
flow control
Y. H. Zou and X. Q. Chen
Title Page
Abstract Introduction
Conclusions References
Tables Figures
◭ ◮
◭ ◮
Back Close
Full Screen / Esc
Printer-friendly Version Interactive Discussion
Discussion
P
a
per
|
Discussion
P
a
per
|
Discussion
P
a
per
|
Discussion
P
a
per
|
whereIr is the critical rainstorm intensity per 24 h that induced debris flow in the river
basin, n is the frequency of the related rainstorm, Ia is the average annual rainfall
intensity per 24 h, and∆pis the sediment volume base according to the characteristics
of the catchment area,
∆p=α0A0L0 (6)
5
whereα0is the shape factor, that is associated with the erosion ability of debris flows
in the river basin,
α0=
A0
L20 (7)
V0=λRaα0A0L0 (8)
whereλis the volume coefficient, that is a dimensionless parameter. Substitute Eq. (7)
10
into Eq. (8) then,
V0=λRa
A20 L0
. (9)
Intuitively, the cumulative sediment volume stored upstream each dam is related to the characteristics of the catchment area, the rainfall factor in the areaRaand the geometry
of the opening slots of damMd: 15
Vi =f(Ra,∆pi,Mdi) (10)
where
∆pi=αiAciLci (11)
Mdi =(1−εiϕi) (12)
NHESSD
3, 5777–5804, 2015Effectiveness and efficiency of slot-check dam system on debris
flow control
Y. H. Zou and X. Q. Chen
Title Page
Abstract Introduction
Conclusions References
Tables Figures
◭ ◮
◭ ◮
Back Close
Full Screen / Esc
Printer-friendly Version Interactive Discussion
Discussion
P
a
per
|
Discussion
P
a
per
|
Discussion
P
a
per
|
Discussion
P
a
per
|
whereαi is the shape coefficient,
αi =
Aci L2 ci
(13)
Vi =λRaαiAciLci(1−εiϕi). (14)
Substitute Eq. (13) into Eq. (14), then accumulate deposit volume in a subsystem is:
Vi =λRa
A2ci
Lci(1−εiϕi) (15)
5
where Aci is catchment area controlled by slot-check dam; Lci is distance from the
dam to the most upstream point of the region;εi is the open rate of the dam;ϕi is the
coefficient of transport capacity of the slot-check dam, related to the opening size of
the slot of check dam to the representative particle size of debris flow, 0< ϕi <1. Ikeya and Uehara (1980), Mizuyama et al. (1988) and Itoh et al. (2011) studied
vari-10
ous types of open-type dams and pointed out that the debris flow will be trapped when the ratio of representative particle size of debris flow to the post spacing is larger than
its closure threshold. Here from the experimental tests, we introduceK (Eq. 16) as the
closure coefficient of openings in slot-check dam. When K ≥1, sediments of debris
flow would filled the small opening slots in the check dam and gradually deposit within
15
the slot-check dam storage. In this condition, almost no discharge through openings of the dam occurs. On the other hand, debris flow discharge from the large slots.
K=2.5
r
γ γw
D90
bmin
(16)
whereγ is the density of debris flow; D90 is the 90 % particle size of the debris flow;
bminis the minimum width of the opening size.
20
(i) for small slot (K ≥1):
ϕi =0. (17)
NHESSD
3, 5777–5804, 2015Effectiveness and efficiency of slot-check dam system on debris
flow control
Y. H. Zou and X. Q. Chen
Title Page
Abstract Introduction
Conclusions References
Tables Figures
◭ ◮
◭ ◮
Back Close
Full Screen / Esc
Printer-friendly Version Interactive Discussion
Discussion
P
a
per
|
Discussion
P
a
per
|
Discussion
P
a
per
|
Discussion
P
a
per
|
Substitute Eqs. (17) and (15) into Eq. (2), then the conservation efficiency of a subsys-tem of dams in the whole syssubsys-tem can be calculated as:
ηsubsi = i P j=1
A2cj/Lcj
n P j=1
A2 cj/Lcj
. (18)
Substitute Eqs. (17), (9) and (15) into Eq. (3), then the efficiency of the subsystem on erosion control at a river basin:
5
ηsysi = P
A2ci/Lci
A20/L0
. (19)
(ii) for large slot (K <1):
ϕi 6=0. (20)
For a stony debris flow,
ϕi =0.11
B
min
D95
−1
0.36
Ca−0.93 (21)
10
where Bmin is the minimum space of slots, Ca is the sediment concentration at the
peak discharge occurring at the front part of the debris flow andD95is 95 % grain size
(Mizuyama et al., 1995).
Substitute Eqs. (21) and (15) into Eq. (2), then the conservation efficiency of a sub-system of dams in the whole sub-system can be calculated as:
15
ηsubsi = i P j=1
A2cj(1−εjϕj)/Lcj
n P j=1
A2cj(1−εjϕj)/Lcj
. (22)
NHESSD
3, 5777–5804, 2015Effectiveness and efficiency of slot-check dam system on debris
flow control
Y. H. Zou and X. Q. Chen
Title Page
Abstract Introduction
Conclusions References
Tables Figures
◭ ◮
◭ ◮
Back Close
Full Screen / Esc
Printer-friendly Version Interactive Discussion
Discussion
P
a
per
|
Discussion
P
a
per
|
Discussion
P
a
per
|
Discussion
P
a
per
|
Substitute Eqs. (21), (9) and (15) into Eq. (3), then the efficiency of the slot-check dam system on erosion control at a river basin:
ηsysi = P
A2ci(1−εiϕi)/Lci
A20/L0
. (23)
3.2 Optimal design of the layout of a slot-check dam system
The optimal layout of the slot-check dam system is essential in the dam system design.
5
Figure 7 shows the outline of slot-check dam system design for debris flow hazard mit-igation. The layout could be developed based on the characteristics of the controlled catchment area of the subsystem, storage capacity of a single dam, required total
reservation of sediments and the appropriate dam sites. Based on the efficiency
eval-uation model, the efficiency of the whole designed dam system in sediment control in
10
the basin and a subsystem in the group can be estimated. That can provide a quantita-tive base for counter calculation and comparison the optimal layouts. Actually, the dam system to be designed in a river basin is not closed but an open system which is just a subsystem for a more extended system. As shown in Fig. 8, after the design or plan of a layout of a system, a new dam system can also be added or inserted into the existed
15
old system without breaking the original arrangement. And the controlled catchment area as well as the distant to upstream most of a subsystem can be calculated as:
Ac1=a1
Ac2=a1+a2
Ac3=a1+a2+a3
Aci =a1+a2+a3+· · ·+ai = Pi
j=1aj
Aci+1=a1+a2+a3+· · ·+ai+ai+1= Pi+1
j=1aj
(24)
ηsysi+1=
Radesign P
A2ci(1−εiϕi)/Lci
RaA2 0/L0
(25)
NHESSD
3, 5777–5804, 2015Effectiveness and efficiency of slot-check dam system on debris
flow control
Y. H. Zou and X. Q. Chen
Title Page
Abstract Introduction
Conclusions References
Tables Figures
◭ ◮
◭ ◮
Back Close
Full Screen / Esc
Printer-friendly Version Interactive Discussion
Discussion
P
a
per
|
Discussion
P
a
per
|
Discussion
P
a
per
|
Discussion
P
a
per
|
whereRadesignis the rainfall factor with the designed return year of debris flow.
vi+1=Vi+1−Vi = X
vi+1− X
vi (26)
wherevi+1is the storage capacity of the single dam with the number i+1 in the dam
system.
4 Results and discussion
5
Field survey had been conducted to investigate the performance of the slot-check
dams. The effectiveness of the series of slot-check dams in sediment control has been
verified from its stability resistant to the impact of debris flows, soil conservation func-tion and downstream erosion prevenfunc-tion (Fig. 2). Figure 2 shows the performance of the five slot-check dams with a continuous layout from the upstream (Fig. 1) in
Shen-10
gou Basin. Each slot-check dam had played an effective role in erosion conservation
as a certain amount volume of sediments deposited within the storage of each dam. The dams successfully resisted to the impact of debris flows since they were running in good condition without damage in dam body or dam foundation.
The construction of check dams in a gully reach causes a flow perturbation upstream
15
and downstream of each structure. It creates a backwater effect by increasing the
wa-ter depth immediately upstream of the structure (Castillo et al., 2014). An equilibrium regime of sediment deposit formed upstream each dam after encountering a transient subcritical state due to dam block (Fig. 3).
For dam-filling conditions, a hydraulic jump habitually occurs and a flow drop
down-20
stream of the check dam also produces (Castillo et al., 2014). Except for the upstream source, the sediments stored within each couple of check dams mainly come from the bank and the lateral slope on both sides of the gully, rather than from the bed. From the field investigation, the base of each check dam is not exposed. No apparent down-stream bed erosion has been observed expect the partial erosion in the preventing rib
25
downstream the first dam (Fig. 4).
NHESSD
3, 5777–5804, 2015Effectiveness and efficiency of slot-check dam system on debris
flow control
Y. H. Zou and X. Q. Chen
Title Page
Abstract Introduction
Conclusions References
Tables Figures
◭ ◮
◭ ◮
Back Close
Full Screen / Esc
Printer-friendly Version Interactive Discussion
Discussion
P
a
per
|
Discussion
P
a
per
|
Discussion
P
a
per
|
Discussion
P
a
per
|
Figure 5 shows the sketch of equilibrium deposit within the slot-check dam system. Equilibrium deposits had been blocked and formed upstream each dam. Debris flow
sediments with different volume were blocked by the dam at each step and deposited
within the dam group. It shows that the sediment conserving function of a dam largely depends on its relative location in the group.
5
Characteristics of deposits upstream the dams were measured on 29 November
2012 and the efficiency of each dam was estimated (Table 3). From the comparison
of the effective height of dam and the deposit height, all five dams are not completely
used up with remaining capacity for subsequent sediment conservation. Although the
dams have blocked a great amount of sediments, the largest dam efficiency is not more
10
than sixty percent. Since the slope of deposit is slower than the original channel slope (Fig. 3), storage per height at upper layer is larger than that at lower layer in the dam reservior.
The volume of deposit stored within each slot-check dam storage and the accumu-lated volume of deposits upstream each dam are reaccumu-lated to the control catchment area
15
at that point and the distance from the dam to the most upstream point in the catchment (Fig. 6). The volume within the dam storage initially increases with the increase of its controlled catchment area (Fig. 6a). But after the volume increases to a maximum value at a dam located at the midstream, it decreases with the controlled catchment area. However, the accumulated volume upstream the slot check dam always increases with
20
the controlled area, initially it increases sharply, then slightly and gradually approaches to a stable value. About 60 % of sediment has been blocked upstream the third dam in the dam system.
The relationship between the sediment deposit volume upstream the slot-check dam and the distance from the dam to the first dam is similar (Fig. 6b). The accumulated
25
deposit volume upstream the slot check dam approaches to a stable value when the dam sits far away from the first dam in the group.
The efficiency of slot-check dam system associated with the characteristics of the
catchment mountain is listed in Table 4. The conserving efficiency of a slot-check dam
NHESSD
3, 5777–5804, 2015Effectiveness and efficiency of slot-check dam system on debris
flow control
Y. H. Zou and X. Q. Chen
Title Page
Abstract Introduction
Conclusions References
Tables Figures
◭ ◮
◭ ◮
Back Close
Full Screen / Esc
Printer-friendly Version Interactive Discussion
Discussion
P
a
per
|
Discussion
P
a
per
|
Discussion
P
a
per
|
Discussion
P
a
per
|
system on debris flow control in a river basin and each subsystem within the group are associated with the related catchment characteristics. Since the movable sediments
volume in Shengou Basin is about 6.017×10⁵m3, the efficiency of the whole dam
system in sediment control in the basin is calculated and compared with the results of the evaluation model.
5
According to Table 4, the efficiency of each individual dam in the group is different. For an optimal design, (1) the individual dam height or the storage capacity should be determined according to its efficiency in the groupηdi. (2) To make sure the diff
er-ence between two connected subsystems efficiency ηsubsi is more or less the same.
(3) Since the system efficiency in the basin is about 20 %, more mitigation projects or
10
methods should be added in order to prevent debris flow hazards to greater extent.
5 Conclusions
Slot-check dam system, an interconnected defense system, shows its significant eff
ec-tiveness in sediment transport control associated with debris flows.
1. Field survey had been conducted to investigate the performance of the slot-check
15
dams in Shengou Basin. The dams successfully resisted to the impact of debris flows since they were running in good condition without damage in dam body or
dam foundation. Each slot-check dam had played an effective role in erosion
con-servation as a certain amount volume of sediments deposited within the storage of each dam.
20
2. The conserving efficiency of a slot-check dam system on debris flow control in
a river basin and each subsystem within the group are associated with their re-lated catchment parameters. The conserving sediment volume of each dam is related to its relative location and catchment area in the group, gradually decreas-ing from upstream to downstream.
25
NHESSD
3, 5777–5804, 2015Effectiveness and efficiency of slot-check dam system on debris
flow control
Y. H. Zou and X. Q. Chen
Title Page
Abstract Introduction
Conclusions References
Tables Figures
◭ ◮
◭ ◮
Back Close
Full Screen / Esc
Printer-friendly Version Interactive Discussion
Discussion
P
a
per
|
Discussion
P
a
per
|
Discussion
P
a
per
|
Discussion
P
a
per
|
3. Quantitative method were proposed for estimating the efficiency of slot-check dam
system based on the rainfall factor, shape factor and related dam parameters. The data obtained in the Shengou Basin has been come up with a quantitative example of optimal design of the slot-check dam system. The dam height and location in the basin can be better determined based on the evaluation of dam
5
system efficiency, so that they works at maximum efficiency.
Further study and more field data in different river basins are needed to promote the
application of the efficiency evaluation model.
Acknowledgements. This research was substantially supported by Knowledge Innovation
Project of Chinese Academy of Sciences (Approval No. KZZD-EW-05-01) and the National 10
Science and Technology Support Program of China (No. 2014BAL05B01). The great help of K. H. Hu and W. Zhong is also gratefully acknowledged.
References
Armanini, A. and Larcher, M.: Rational criterion for designing opening of slit-check dam, J. Hy-draul. Eng., 127, 94–104, 2001.
15
Busnelli, M. M., Stelling, G. S., and Larcher, M.: Numerical morphological modeling of open-check dams, J. Hydraul. Eng., 127, 105–114, 2001.
Castillo, C., Pérez, R., and Gómez, J. A.: A conceptual model of check dam hydraulics for gully control: efficiency, optimal spacing and relation with step-pools, Hydrol. Earth Syst. Sci., 18, 1705–1721, doi:10.5194/hess-18-1705-2014, 2014.
20
Catella, M., Paris, E., and Solari, L.: Case study: efficiency of slit-check dams in the mountain region of Versilia Basin, J. Hydraul. Eng., 131, 145–152, 2005.
Chen, X. Q., Cui, P., You, Y., and Li, D. J.: Layout methods of control works preventing large scale debris flows in Wenchuan earthquake area, Shuili Xuebao, 44, 586–593, 2013. Conesa-García, C., López-Bermúdez F., and García-Lorenzo, R.: Bed stability variations after 25
check dam construction in torrential channels (south-east Spain), Earth Surf. Proc. Land., 32, 2165–2184, 2007.
NHESSD
3, 5777–5804, 2015Effectiveness and efficiency of slot-check dam system on debris
flow control
Y. H. Zou and X. Q. Chen
Title Page
Abstract Introduction
Conclusions References
Tables Figures
◭ ◮
◭ ◮
Back Close
Full Screen / Esc
Printer-friendly Version Interactive Discussion
Discussion
P
a
per
|
Discussion
P
a
per
|
Discussion
P
a
per
|
Discussion
P
a
per
|
Fiebiger, G.: Structures of debris flow countermeasures, in: Proceedings of 1st International Conference on Debris-Flow Hazards Mitigation: Mechanics, Prediction, and Assessment, ASCE, New York, 596–605, 1997.
Han, W. B. and Ou, G. Q.: Experimental study on effect of intercepting sediment of slit dam, Res. Soil Water Conserv., 11, 286–288, 2004.
5
Hassanli, A. M., Nameghi, A. E., and Beecham, S.: Evaluation of the effect of porous check dam location on fine sediment retention (a case study), Environ. Monit. Assess., 152, 319–326, 2009.
Heumader, J.: Technical debris-flow countermeasures in Austria – a review, in: Proceedings of 2nd International Conference on Debris-Flow Hazards Mitigation: Mechanics, Prediction, 10
and Assessment, ASCE, Taipei, Taiwan, 553–564, 2000.
Huebl, J. and Fiebiger, G.: Debris-flow mitigation measures, in: Debris-flow Hazards and Re-lated Phenomena, edited by: Jakob, M. and Hungr, O., Springer Berlin Heidelberg, 445–487, 2005.
Hungr, O., Morgan, G. C., VanDine, D. F., and Lister, D. R.: Debris flow defenses in British 15
Columbia, in: Debris Flows/Avalanches: Process, Recognition and Mitigation, edited by: Costa, E. J. E. and Wieczorek, G. F., Rev. Eng. Geol., 7, 201–222, 1987.
Ikeya, H. and Uehara, S.: Experimental study about the sediment control of slit sabo dams, J. Jpn. Eros. Contr. Eng. Soc., 14, 37–44, 1980.
Itoh, T., Horiuchi, S., Akanuma, J., Kaitsuka, K., Kuraoka, S., Morita, T., Sugiyama, M., and 20
Mizuyama, T.: Fundamental hydraulic flume tests focused on sediment control function using a grid-type high dam, in: Proceedings of 5th International Conference on Debris-Flow Haz-ards Mitigation: Mechanics, Prediction and Assessment, ASCE, Padua, Italy, 1051–2061, 2011.
Iverson, R. M.: The physics of debris flows, Rev. Geophys., 35, 245–296, 1997. 25
Jia, S. T., Cui, P., Chen, X. Q., Huang, K., and Li, Q.: Experimental study of regulating barrage and transportation properties of debris flow by silt-trap dam, Chinese J. Rock Mech. Eng., 30, 2338–2345, 2011.
Johnson, P. A. and McCuen, R. H.: Slit dam design for debris flow mitigation, J. Hydraul. Eng., 115, 1293–1296, 1989.
30
Li, D. J.: The application of permeable dam in debris flow control, Chinese J. Geol. Hazard Contr., 8, 60–66, 1997.
NHESSD
3, 5777–5804, 2015Effectiveness and efficiency of slot-check dam system on debris
flow control
Y. H. Zou and X. Q. Chen
Title Page
Abstract Introduction
Conclusions References
Tables Figures
◭ ◮
◭ ◮
Back Close
Full Screen / Esc
Printer-friendly Version Interactive Discussion
Discussion
P
a
per
|
Discussion
P
a
per
|
Discussion
P
a
per
|
Discussion
P
a
per
|
Lien, H. P.: Design of slit dams for controlling stony debris flows, Int. J. Sediment Res., 18, 74–87, 2003.
Mizuyama, T.: Structural countermeasures for debris flow disasters, Int. J. Eros. Contr. Eng., 1, 38–43, 2008.
Mizuyama, T., Suzuki, H., Oikawa, Y., and Morita, A.: Experimental study on permeable sabo 5
dam, J. Jpn. Eros. Contr. Eng. Soc., 41, 21–25, 1988.
Mizuyama, T., Kobashi, S., and Mizuno, H.: Control of passing sediment with grid-type dams, J. Jpn. Eros. Contr. Eng. Soc., 47, 8–13, 1995.
Osti, R. and Egashira, S.: Method to improve the mitigative effectiveness of a series of check dams against debris flows, Hydrol. Process., 22, 4986–4996, 2008.
10
Remaître, A. and Malet, J. P.: The effectiveness of torrent check dams to control channel insta-bility: example of debris-flow events in clay shales, in: Check Dams, Morphological Adjust-ments and Erosion Control in Torrential Streams, edited by: Garcia, C. C. and Lenzi, M. A., New York, Nova Science Publisher, 211–237, 2010.
Remaître, A., van Asch, Th. W. J., Malet, J.-P., and Maquaire, O.: Influence of check 15
dams on debris-flow run-out intensity, Nat. Hazards Earth Syst. Sci., 8, 1403–1416, doi:10.5194/nhess-8-1403-2008, 2008.
Shrestha, B. B., Nakagawa, H., Kawaike, K., and Baba, Y.: Numerical and experimental study on debris-flow deposition and erosion upstream of a check dam, Ann. J. Hydr. Eng., JSCE, 52, 139–144, 2008.
20
Takahashi, T.: Debris flow, Annu. Rev. Fluid Mech., 13, 57–77, 1981.
Xu, X. Z., Zhang, H. W., and Zhang, O. Y.: Development of check-dam systems in gullies on the Loess Plateau, China, Environ. Sci. Policy, 7, 79–86, 2004.
Zimmermann, A. and Church, M.: Channel morphology, gradient profiles and bed stresses during flood in a step-pool channel, Geomorphology, 40, 311–327, 2001.
25
Zou, Y. H., Hu, K. H., Chen, X. Q., and Zhong, W.: Efficiency of slot-check dam group in Shen-gou Basin, Kunming, China, in: Proceedings of World Landslide Forum 3, Beijing, 37–43, 2014.
NHESSD
3, 5777–5804, 2015Effectiveness and efficiency of slot-check dam system on debris
flow control
Y. H. Zou and X. Q. Chen
Title Page
Abstract Introduction
Conclusions References
Tables Figures
◭ ◮
◭ ◮
Back Close
Full Screen / Esc
Printer-friendly Version Interactive Discussion
Discussion
P
a
per
|
Discussion
P
a
per
|
Discussion
P
a
per
|
Discussion
P
a
per
|
Table 1.Main characteristics of Shengou Basin.
River basin
Catchment area
A(km2)
Main stream length
L(km)
Average width
B(m)
Relative altitude
Hm(m)
Average slope
S(%)
Debris flow
Qp=0.5 % (m3s−1)
Qp=1 % (m3s−1)
Qp=2 % (m3s−1) Shengou 31.77 13.55 51.20 2520.00 20.30 318.22 282.86 247.51
NHESSD
3, 5777–5804, 2015Effectiveness and efficiency of slot-check dam system on debris
flow control
Y. H. Zou and X. Q. Chen
Title Page
Abstract Introduction
Conclusions References
Tables Figures
◭ ◮
◭ ◮
Back Close
Full Screen / Esc
Printer-friendly Version Interactive Discussion
Discussion
P
a
per
|
Discussion
P
a
per
|
Discussion
P
a
per
|
Discussion
P
a
per
|
Table 2.Basic parameters of the slot-check dams.
Dam Length of dam
Ld(m)
Effective
height of dam Hd(m)
Height of drainage hole in dam h(m)
Width of drainage hole in dam b(m)
Design discharge Qproj(m3s−1)
a 63.9 8.0 0.50 0.40 96.55
b 79.0 12.0 0.40 0.40 96.55
c 65.5 10.0 0.40 0.40 96.55
d 100.0 10.5 0.50 0.40 96.55
e 62.0 6.0 0.50 0.40 96.55
NHESSD
3, 5777–5804, 2015Effectiveness and efficiency of slot-check dam system on debris
flow control
Y. H. Zou and X. Q. Chen
Title Page
Abstract Introduction
Conclusions References
Tables Figures
◭ ◮
◭ ◮
Back Close
Full Screen / Esc
Printer-friendly Version Interactive Discussion
Discussion
P
a
per
|
Discussion
P
a
per
|
Discussion
P
a
per
|
Discussion
P
a
per
|
Table 3.Deposits upstream each slot-check dam measured on 29 November 2012.
Dam Height of deposit
upstream the dam Hs(m)
Volume of deposit upstream the dam Vs(103m3)
Effective height of
dam Hd(m)
Efficiency of each
dam ηselfi=˙Hs2/Hd2
a 2.90 7.20 8.00 0.13
b 6.20 26.40 12.00 0.27
c 7.40 32.80 10.00 0.55
d 6.10 29.00 10.50 0.34
e 4.60 14.50 6.00 0.59
NHESSD
3, 5777–5804, 2015Effectiveness and efficiency of slot-check dam system on debris
flow control
Y. H. Zou and X. Q. Chen
Title Page
Abstract Introduction
Conclusions References
Tables Figures
◭ ◮
◭ ◮
Back Close
Full Screen / Esc
Printer-friendly Version Interactive Discussion
Discussion
P
a
per
|
Discussion
P
a
per
|
Discussion
P
a
per
|
Discussion
P
a
per
|
Table 4.The efficiency and associated catchment parameters of each slot-check dam system.
Dam Controlled
catchment area Aci(km2)
Distance to most upstream point Lci(km)
Deposit volume upstream a dam vi(10
3 m3)
Cumulative deposit volume in the subsystem Vi(103m3)
Individual dam efficiency in the group ηdi
Subsystem efficiency in the group ηsubsi
Subsystem efficiency in the group (model) ηsubsi
System efficiency in the basin ηsysi
System efficiency in the basin (model) ηsysi
a 4.24 1.97 7.20 7.20 0.07 0.07 0.16 0.01 0.03
b 5.60 2.46 26.40 33.60 0.24 0.31 0.42 0.06 0.08
c 7.41 3.06 32.80 66.40 0.30 0.60 0.53 0.11 0.10
d 10.32 3.80 29.00 95.40 0.26 0.87 0.74 0.16 0.14
e 15.26 4.91 14.50 109.90 0.13 1.00 1.00 0.18 0.19
NHESSD
3, 5777–5804, 2015Effectiveness and efficiency of slot-check dam system on debris
flow control
Y. H. Zou and X. Q. Chen
Title Page
Abstract Introduction
Conclusions References
Tables Figures
◭ ◮
◭ ◮
Back Close
Full Screen / Esc
Printer-friendly Version Interactive Discussion
Discussion
P
a
per
|
Discussion
P
a
per
|
Discussion
P
a
per
|
Discussion
P
a
per
|
Dongchuan Slot-Check Dam
Shengou Basin
Dongc
hua
n
Di
s
tric
t
N
a
c b
d
e
Figure 1.The slot-check dam system in Shengou Basin.
NHESSD
3, 5777–5804, 2015Effectiveness and efficiency of slot-check dam system on debris
flow control
Y. H. Zou and X. Q. Chen
Title Page
Abstract Introduction
Conclusions References
Tables Figures
◭ ◮
◭ ◮
Back Close
Full Screen / Esc
Printer-friendly Version Interactive Discussion
Discussion
P
a
per
|
Discussion
P
a
per
|
Discussion
P
a
per
|
Discussion
P
a
per
|
a
1b
2e
1e
2a
2b
1c
1d
1c
2d
2Figure 2. Performance of slot-check dams in Shengou Basin on 29 November 2012. (a1–
e1)View from the downstream, and(a2–e2)view from the upstream of the five check dams.
NHESSD
3, 5777–5804, 2015Effectiveness and efficiency of slot-check dam system on debris
flow control
Y. H. Zou and X. Q. Chen
Title Page
Abstract Introduction
Conclusions References
Tables Figures
◭ ◮
◭ ◮
Back Close
Full Screen / Esc
Printer-friendly Version Interactive Discussion
Discussion
P
a
per
|
Discussion
P
a
per
|
Discussion
P
a
per
|
Discussion
P
a
per
|
Original channel slope i0
Deposition slopeis
Inflow velocity u
Outflow velocity u'
Height of deposition
upstream dam h(t) Vertical height of hole H
Height of downstream flow h'(t)
Figure 3.Debris flow sediment deposit upstream a slot-check dam.
NHESSD
3, 5777–5804, 2015Effectiveness and efficiency of slot-check dam system on debris
flow control
Y. H. Zou and X. Q. Chen
Title Page
Abstract Introduction
Conclusions References
Tables Figures
◭ ◮
◭ ◮
Back Close
Full Screen / Esc
Printer-friendly Version Interactive Discussion
Discussion
P
a
per
|
Discussion
P
a
per
|
Discussion
P
a
per
|
Discussion
P
a
per
|
H =0.5m
b
Downstreamerosion
a
Figure 4.Downstream erosion at the toe of the first slot-check dam.
NHESSD
3, 5777–5804, 2015Effectiveness and efficiency of slot-check dam system on debris
flow control
Y. H. Zou and X. Q. Chen
Title Page
Abstract Introduction
Conclusions References
Tables Figures
◭ ◮
◭ ◮
Back Close
Full Screen / Esc
Printer-friendly Version Interactive Discussion
Discussion
P
a
per
|
Discussion
P
a
per
|
Discussion
P
a
per
|
Discussion
P
a
per
|
Debris flow deposition
Original ground line Check dam
a
b
c
d
e
Original channel degree Source area
No defense works Defense works: series of slot-check dams Transportation zone
channel degree after deposition
Figure 5.Sketch of equilibrium deposit within the slot-check dam system.
NHESSD
3, 5777–5804, 2015Effectiveness and efficiency of slot-check dam system on debris
flow control
Y. H. Zou and X. Q. Chen
Title Page
Abstract Introduction
Conclusions References
Tables Figures
◭ ◮
◭ ◮
Back Close
Full Screen / Esc
Printer-friendly Version Interactive Discussion
Discussion
P
a
per
|
Discussion
P
a
per
|
Discussion
P
a
per
|
Discussion
P
a
per
|
0 30 60 90 120
1.00 2.00 3.00 4.00 5.00
Vin
(1
0
3m 3)
L (km)
upstream each check dam cumulative volume
b
0 30 60 90 120
0 4 8 12 16
Vin
(1
0
3m 3)
Ac (km2)
upstream each check dam cumulative volume
a
Figure 6.Relationship between the volumes of sediment stored upstream the slot-check dam.
(a)The drained catchment area;(b)the position of the check dam along the river.
NHESSD
3, 5777–5804, 2015Effectiveness and efficiency of slot-check dam system on debris
flow control
Y. H. Zou and X. Q. Chen
Title Page
Abstract Introduction
Conclusions References
Tables Figures
◭ ◮
◭ ◮
Back Close
Full Screen / Esc
Printer-friendly Version Interactive Discussion
Discussion
P
a
per
|
Discussion
P
a
per
|
Discussion
P
a
per
|
Discussion
P
a
per
|
Slot-check dam system for debris flow hazard mitigation
Layout of the slot-check dam system
Required dam number Location of each dam
Required total reservation of sediments
Storage capacity of each dam
Conservation capacity of subsystem
Verification of the designed system Geological conditions of the dam sites
Determination of the slot-check dam system
Figure 7.Design procedure of slot-check dam system for debris flow hazard mitigation.
NHESSD
3, 5777–5804, 2015Effectiveness and efficiency of slot-check dam system on debris
flow control
Y. H. Zou and X. Q. Chen
Title Page
Abstract Introduction
Conclusions References
Tables Figures
◭ ◮
◭ ◮
Back Close
Full Screen / Esc
Printer-friendly Version Interactive Discussion
Discussion
P
a
per
|
Discussion
P
a
per
|
Discussion
P
a
per
|
Discussion
P
a
per
|
1 2 3 4 i i+1
a1 a2 a3 a4 ai ai+1 a0
Ac1 Ac2 Ac3 Ac4 Aci Aci+1 Ac0
Figure 8.Controlled catchment area of each subsystem.