Available online at
http://www.anpad.org.br/bar
BAR, Rio de Janeiro, v. 9, n. 1, art. 1, pp. 1-22, Jan./Mar. 2012
Relationships between Learning, Context and Competency: a
Multilevel Study
(1)Hugo Pena Brandão * E-mail address: [email protected] Banco do Brasil, Fundação Getúlio Vargas – FGV Management Brasília, DF, Brazil.
Jairo Eduardo Borges-Andrade E-mail address: [email protected] Universidade de Brasília – IP/UnB Brasília, DF, Brazil.
Katia Puente-Palacios E-mail address: [email protected] Universidade de Brasília – IP/UnB Brasília, DF, Brazil.
Jacob Arie Laros E-mail address: [email protected] Universidade de Brasília – IP/UnB Brasília, DF, Brazil.
* Corresponding author: Hugo Pena Brandão
SCES Trecho 2, Lote 22, Ed. Presidente Tancredo Neves, 1º andar, Brasília, DF, 70200-002, Brazil.
Abstract
This study aims to identify the predictor variables for three types of management competencies: financial business management, process management and socio-environmental management. It was hypothesized that attributes of bank managers (such as the learning strategies they use) and those of the branches where they work (such as organizational support) are associated with the expression of management competencies at work. Structured questionnaires were used for data collection. Multilevel regression analyses (HLM) were performed to test the theoretical model of investigation. The sample was made up of 775 managers from the Bank of Brazil, spread among 239 bank branches. The greatest relative contribution to explain the management competencies came from intrinsic and extrinsic reflection, a learning strategy employed by managers at work. The managers’ perceptions regarding the company’s performance management practices, one dimension of organizational support, appeared as another important predictor. Other learning strategies and dimensions of organizational support, as well as the number of hours spent on training activities, revealed less expressive effects regarding management competencies. Practical recommendations are presented and the study’s limitations and contributions are discussed.
Introduction
Researchers and organizations have shown a growing interest in the topics of learning and competency at work (Calhoun, Vincent, Calhoun, & Brandsen, 2008; Gonczi, 1999). Despite efforts, especially in the theoretical field, to explain the relationship between these constructs and the influence that context has on them, many questions remain unanswered. There are theoretical assumptions and constructions that still lack empirical sustentation (Brandão, 2007).
Furthermore, despite the fact that organizations constitute integrated systems, characterized by having a multiple level structure (Kozlowski & Klein, 2000), the great majority of research done in this field, including that done on learning and competency, does not consider this assumption and simply studies each organizational level in isolation (individual, team, unit or organization as a whole, for example). Due to this, there is a shortage of investigations which not only strive to empirically examine the relationships between these constructs, but which also adopt a multilevel perspective in their analyses (Kreft & Leeuw, 1998; Van Yperen, Van den Berg, & Willering, 1999).
The study presented here had as its objective the development and testing of a theoretical model of investigation, with the expression of management competencies at work as its criterion variable. Based on a multilevel theoretical model and making use of a compatible analysis tool (Hox, 2010; Snijders, 2008), the intention was to empirically verify the existence of predictive relationships between: (a) on one hand, bank manager attributes (such as the informal learning strategies they employ and the number of hours they spend on formal learning activities) and the attributes of the bank branches where they work (such as organizational support, for example); and (b) on the other hand, the expression of competencies at work.
Background Literature and Theoretical Model
Although competency(2) constitutes a complex and multifaceted concept (Gonczi, 1999; McLagan, 1997), it is traditionally understood as the individual’s capability to perform a role in a particular professional context (Brandão & Borges-Andrade, 2008). It is derived from personal attributes, such as knowledge, skills and attitudes (Durand, 2000; Gonczi, 1999), which become
evident through the individual’s behavior at work (Whiddett & Hollyforde, 1999). Competencies are
revealed as people behave in the professional situations they come up against (Zarifian, 1999). They
are generally described in terms of behavioral patterns, which represent the organization’s
expectations regarding the performance of its employees (Gonczi, 1999). The behaviors expected from those people while exercising managerial functions are usually called management competencies (Boak & Coolican, 2001; Cockerill, 1994).
Competencies are developed through the learning process (Sonnentag, Niessen, & Ohly, 2004), which involves acquiring knowledge, skills and attitudes (Durand, 2000; Illeris, 2004). Learning may
be defined as a relatively lasting change in a person’s capacity or behavior that is transferable to new
situations (Pozo, 2000). It constitutes the process through which the competency is developed (Gonczi, 1999;Le Boterf,1999), while the expression of competencies represents a manifestation of what the person learned (Freitas & Brandão, 2006).
. reproduction: mental repetition of information, without reflecting on its meaning;
. intrinsic reflection: formulating mental structures which interrelate the component elements of work;
. extrinsic reflection: formulating mental structures that connect work to other aspects of the company;
. interpersonal help seeking: obtaining assistance from other people;
. seeking help from written material: searching documents, manuals, databases, books and other non-social sources; and
. practical application: experimentation, trying things out in practice.
The first three strategies are classified as cognitive, while the last three are considered behavioral. Theorists from this area defend that the use of these strategies is positively associated with the effectiveness of the learning process (Warr & Downing, 2000), or in other words, with the acquisition of knowledge, skills and attitudes. Some studies (Felix, 2005; Sonnentag & Kleine, 2000) show that the amount of time dedicated by the individual to training activities or to practices of informal learning affects the domain and the expression of competencies at work.
Learningandexpressionofcompetenciescanbeinfluencedbyemployee attributes asmuchas it can be by contextual variables (Le Boterf, 1999; Sonnentag et al., 2004). Characteristics of the work team (such as managerial support and organizational climate) and of the organization (such as culture, rules and other aspects) can facilitate or restrict the development of competencies as well as the possibility to apply them at work (Abbad, Freitas, & Pilati, 2006; DeNisi, 2000).
Studies carried out on this subject show that the employee’s perception on the organizational
support can predict the expression of competencies at work (Abbad, Pilati,&Borges-Andrade,1999; Rhoades& Eisenberger,2002). Perceived organizational support refers to the worker’s perception of the quality of the treatment he or she receives as compensation for the efforts made at work (Eisenberger, Huntington, Hutchison, & Sowa,1986). It is related to the employee’s opinions about
how much the company values the employee’s contributions and how much it takes care of the employee’s well-being (Abbad et al., 1999). Such opinions about organizational support can be classified into four dimensions of the work context (Abbad et al., 1999):
. performance management practices: describes the actions taken by the organization related to improving work processes, to professional training, to stimulating employee participation, and to the availability of orientation, among others;
. workload: involves goals and time limits, workday, and work volume;
. material support: meaning the availability, quantity and quality of material, equipment, tools, furniture, and other elements needed to work; and
. promotion and reward practices: includes organizational policies regarding incentives, professional ascent, and compensation and employee appreciation.
According to Abbad, Freitas and Pilati (2006), even though the learning activities undertaken by the individual have promoted the acquisition of knowledge, skills and attitudes, it is possible that this learning process does not generate favorable effects on the expression of competencies at work, if the
individual doesn’t have the adequate organizational support in the context of work. So, organizational
support variables can moderate the relationship between the acquisition and the expression of competencies at work (Brandão & Borges-Andrade, 2008).
integrated and multilevel system, since its results are influenced by processes occurring on various levels, which interact with each other in an interdependent manner (DeNisi, 2000).
According to Kozlowski and Klein (2000), if one level of the organization influences and is influenced by other levels, this should be taken into consideration in theoretical models and their empirical tests; given that no single level can solely explain, in a complete and appropriate manner, the nature of organizational behavior phenomena. Despite the fact that it is assumed that the development
and expression of an individual’s competencies at work can be influenced just as much by the person’s
own attributes as by the characteristics of the team and organization to which the person belongs (Abbad et al., 2006), many times this relationship is not well articulated nor adequately dealt with in empirical research.
Multilevel analysis constitutes a theoretical and methodical approach which has been indicated for filling the gap between theoretical assumptions and their empirical tests (Jex & Bliese, 1999; Kozlowski & Klein, 2000). This approach defends that the lowest level of an organization (the individual, for example) is contained in the higher levels (team, unit and organization) and that people can modify organizational processes just as much as groups and the organization itself can influence the performance of individuals (DeNisi,2000).
The multilevel approach permits the construction of explanatory models containing data that represents different levels, thus making it possible to assess the relative importance of individual and organizational attributes in the relationships between the studied variables (Elovainio,Kivimaki,Steen, & Kalliomaki-Levanto, 2000; Hox, 2010). According to Kozlowski and Klein (2000), by admitting the investigation of a phenomenon, analyzing it at multiple levels, such an approach favors a more integrated and vast understanding of different constructs, making it possible to build an organizational science that is theoretically rich and may have practical relevance.
From a mathematical point of view, multilevel analysis permits the examination of particular contributions of predictor variables from different levels towards explaining the phenomenon of interest, as well as investigating the presence of random coefficients (Hox, 2010; Kreft & Leeuw, 1998), which indicates that the magnitude of the effect produced by these predictors varies according to the different scenarios in which they occur (for example, in different teams or work units). Its utilization is recommended not only for theoretical reasons, but also because this approach uses procedures which improve the reliability of statistical tests. By taking the variance within each group and between the groups into consideration, multilevel models produce more precise predictive estimates, in addition to providing a more adequate description of the relationships between the variables studied (Van der Vegt, Emans, & Van de Vliert, 2001). For this reason, a multilevel approach was chosen to serve as the foundation for constructing and testing this theoretical model.
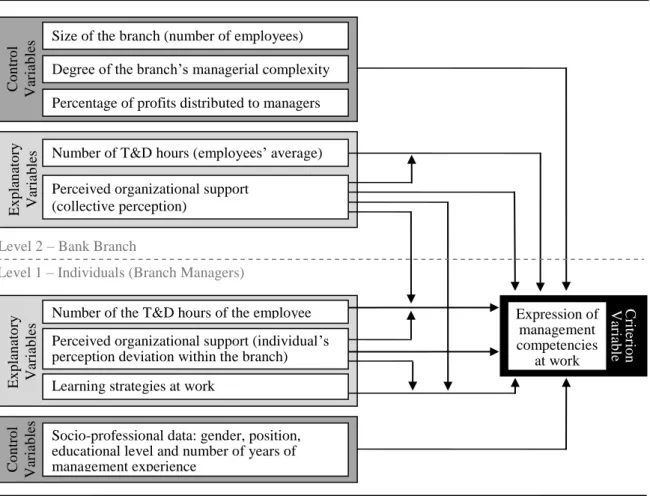
The main purpose of this study was to test a theoretical model of the expression of management competencies at bank branches, which was formulated on the basis of the theoretical and empirical foundations reviewed in this section. The variables included in this study and the hypothesized predictive relationships (direct and moderated) are described in Figure 1. This model is structured into two levels of analysis (Elovainio et al., 2000), in which individual employees holding management positions (level 1) at the Bank of Brazil are grouped in organizational units called bank branches (level 2). It deals with a cross-level model because it specifies relationships between constructs at different
Figure 1. Theoretical Model of the Expression of Management Competencies at Bank Branches.
Method
The study was done at the Bank of Brazil, a company partially owned by the Brazilian
Government, whose mission is “to be the solution in financial services and intermediation, meet the
expectations of customers and shareholders, strengthen the commitment between employees and the company and contribute towards the development of the country” (Banco do Brasil, 2008). When this study was carried out in 2008, the Bank of Brazil had more than US$300 billion in assets, about 50 million customers, 4,052 large, full-service branches in Brazil, 11,031 small, limited-service branches in Brazil, 42 branches abroad, 81,855 employees, and 9,119 interns (Banco do Brasil, 2008).
Its branches are business units that account for the product and service sales, and are segmented according to bank customer markets (retail, private, small business, large companies, government, and other markets). Each branch is managed by an employee who holds the position of General Manager. Depending on the number of employees and customers and on the potential size of the customers market, a branch may have other management positions (accounts managers, for instance), which are subordinated to the general manager.
In recent years, based on assumptions of management models and instruments such as Balanced Scorecard - BSC (Kaplan & Norton, 1997) and competence-based management (Durand, 2000; Heene & Sanchez, 1997), the Bank has managed the performance of its branches through the establishment of objectives, goals and competencies, aligned with its organizational strategy, in different performance perspectives: financial, customers, processes, organizational behavior and society (Brandão et al., 2008).
C riter io n Var iab le Expression of management competencies at work E x p lan ato ry Var iab les
Number of the T&D hours of the employee
Learning strategies at work
Perceived organizational support (individual’s perception deviation within the branch)
Socio-professional data: gender, position, educational level and number of years of management experience
Level 1 – Individuals (Branch Managers) Level 2 – Bank Branch
Size of the branch (number of employees)
Degree of the branch’s managerial complexity
Percentage of profits distributed to managers
Number of T&D hours (employees’ average)
E x p lan ato ry Var iab les C o n tr o l Var iab les
Considering these characteristics of its management practices, the company has encouraged the accomplishment of applied research that may support and guide its strategies and management actions. This is the case of studies carried out by: (a) Brandão et al. (2008), describing the development and implementation of the competence-based management model adopted by the bank; (b) Leite and Porsse (2003), analyzing organizational learning processes in the company; (c) Brandão, Borges-Andrade, Freitas and Vieira (2010), which describes the development and validation process of a scale to measure management competencies at bank branches; and (d) Brandão and Borges-Andrade (2011), which describes the development and validation process of a scale to measure learning strategies used by bank managers for developing their competencies. The measurement scales just listed were used for data collection in the present study, as described ahead.
Primary and secondary data were used to test the hypothesized relationships in Figure 1. Primary data was collected through structured questionnaires – previously subjected to semantic validation(3)–, completed and returned by the internal mail system of the organization being studied, in March and April of 2008. The instruments were sent to all of the 2,205 managers working in 329 branches, which were randomly selected. Secondary data was obtained from Bank databases.
Sample
A total of 926 questionnaires were received, representing a return rate of 42%. Questionnaires were eliminated when they: (a) had more than 10% of missing answers; (b) received the same answer on the scale for all items (unvarying responses); (c) were multivariate outliers (identified by the Mahalanobis distance); (d) had respondents who worked for less than four months in their respective branches (the minimum amount of time needed to share perceptions); or (e) belonged to respondents who constituted the only reply from the branch where they worked (branches with only one respondent). With these exclusions, the adjusted sample totaled 775 participants grouped into 239 bank branches, with groups ranging from 2 to 8 members (an average of 3.25 managers per branch).
On the whole, the respondents were males (69.3%), holding the position of team manager (69.6%), had a college degree or post-graduate degree (84%) and on average had around 8 years of experience in managerial functions.
Measures
The following measures were taken in order to test the model:
a) Expression of management competencies: criterion variable, pertaining to the individual level
(level 1), measured with fourteen items from the scale developed by Brandão et al. (2010), which described observable behaviors at work, representing three dimensions of management
competencies: financial business management (4 items, α = .82); process management (4 items, α = .80); and socio-environmental management (6 items, α = .86). Participants responded on a 10-point scale anchored at the extremes by non-expressed competency (1) to fully expressed
competency (10). An example item is Monitoring the quality of internal processes, in order to avoid having to replicate previous work efforts;
b) Number of T&D hours per branch: explanatory variable at the branch level (level 2), which
represents the average number of hours that branch managers dedicated to training and development activities (T&D) in 2007. It can be interpreted as an effort to develop competencies (Felix, 2005; Sonnentag et al., 2004). Data were collected from secondary sources (database from the organization being studied);
c) Perceived organizational support (collective perception): explanatory variable, measured with a
practices (8 items, α = .85), which were responded to on a 10-point agreement scale, ranging from 1 (I totally disagree) to 10 (I totally agree). An example item is In the organization where I
work, the employees receive all orientation and information needed to efficiently execute their activities. The data were collected at the individual level (level 1), through the managers
self-report, and later pooled together (by the average of responses from each branch) to represent the branch level (level 2);
d) Number of T&D hours per employee: explanatory variable pertaining to the individual level
(level 1), which represents the number of hours each employee spent on T&D activities in 2007 (secondary data);
e) Perceived organizational support (individual’s perception deviation within the branch):
explanatory variable, pertaining to the individual level (level 1), which represents the relative position of the person within the group (the branch). It constitutes the deviation of the individual
support score compared to the branch’s average (Hox, 2010; Kozlowski & Klein, 2000); that is, the difference between individual perception and collective perception of organizational support. Although the perceived support reflects certain beliefs held by members of a group regarding the quality of the treatment they receive from the company - conceived as a group level variable - such beliefs may result as much from the objective qualities of the support offered by the company as
from the employee’s personal characteristics. Two employees from the same bank branch may report differing levels of perceived support, depending on their capacity to process information and on their interests, experiences and other personal attributes (Hox, 2010). As a result, the scores on perceived organizational support were separated into two distinct measurements: (a) one relative to the average of the workers’ perceptions at a branch, pertaining to level 2 of the analysis; (b) the other relative to the deviation variable within the branch (the individual score minus the group average), representing level 1 of the analysis; and
f) Learning strategies at work: explanatory variable belonging to the individual level (level 1).
Measure developed by Brandão and Borges-Andrade (2011), based on Holman et al. (2001), and Pantoja (2004), it contains 26 items grouped into five dimensions: extrinsic and intrinsic reflection
(9 items, α = .92); interpersonal help seeking (5 items, α = .88); seeking help from written material (5 items, α = .79); reproduction (4 items, α = .79); practical application (3 items, α = .82). Participants responded on a 10-point scale, varying from 1 (I never do) to 10 (I always do). An example item is I ask for help from my co-workers when I need to learn something at work.
Besides these measures, the following were used as control variables: (a) on level 1 of analysis, gender, position held, education level, and years of management experience of the participants; and (b) on level 2, the percentage of profits distributed to managers,size and managerial complexity of the branch(secondarydata). In this way,the intention was to isolate the eventual effects of these variables from the effects producedbytheexplanatoryvariables,whichconstitutethe mainobjectof interest of thisstudy.
The procedures adopted to develop and to evaluate the psychometrical quality of the three perceptual measures used (management competencies, learning strategies at work and perceived organizational support) are described in detail by Brandão et al. (2010), Brandão and Borges-Andrade (2011) and Abbad et al. (1999), respectively. All the dimensions of these three scales are valid and internally consistent(4), showing Cronbach's alphas equal to or above .79, as previously stated.
Data analysis
were encountered since all of the correlation coefficients between the explanatory variables were less than .60; and (c) the sample size was large enough on both levels (individuals and branches) to diminish the eventual effects of small deviations from the normality. In single-level regressions, the sample should contain at least 50 individuals plus 8 respondents for each explanatory variable (Tabachnick & Fidell, 2007). In multilevel regressions, the sample should contain more than 50 groups (level 2) and, to ensure greater accuracy of estimated parameters, a large number of groups is more important than a large number of individuals per group (Maas & Hox, 2004, 2005). Since in the present study the adjusted sample totaled 775 individuals grouped into 239 bank branches, it is safe to assume that this sample is large enough for both levels of analysis (individuals and groups) in order to generate reliable estimates. After testing the regression models, it was verified, following the recommendations of Rasbash, Steele, Browne and Prosser (2004), that these models met the assumptions of homoscedasticity and of a normal distribution of regression residuals, aspects which will be explained later when presenting the results.
Another requirement which was examined refers to the intraclass correlation (ICC) of criterion variables, a coefficient that indicates the magnitude of differences between the groups (branches) or the answers consistency (Kreft & Leeuw, 1998). The calculations of this index are based on the comparison of the amount of variance between groups with the amount of variance within groups (Kozlowski & Klein, 2000). The intraclass correlation indicates which proportion of the variance can be attributed to differences among the units of the macrolevel (bank branches). Since the existence of significant differences at the level 2 of analysis, related to the criterion variables, constitutes an assumption for constructing and testing multilevel models (Van der Vegt et al., 2001), the ICC of these variables was calculated in order to confirm that the collected data justified adopting a multilevel approach.
The three dimensions of competencies showed that they had intraclass correlations different from zero: financial business management (ICC=.05), process management (ICC=.04) and socio-environmental management (ICC = .11). This coefficient indicates that 5% of the variance of financial business management competencies, 4% of the variance in the process management competencies, and 11% of the variance in the socio-environmental competencies can be explained by differences between bank branches (level 2).
Although it seems to be little substantial, intraclass correlations of this magnitude have justified the adoption of multilevel analysis (Snijders & Bosker, 1999), since they suggested the existence of certain dependence between individual observations, causing the so-called design effect (Hox, 2010). As the average size of the groups in this research is of 3.25 respondents, the design effect would reduce the effective size of the sample, according Hox (2010), to 696 (reduction of 10.2% in the adjusted sample) in the case of expression of financial management competencies, and 711 (8.3% reduction) and 621 (reduction of almost 20%) in relation to the process management competencies and to socio-environmental management competencies, respectively, if the data were analyzed using conventional regressions. Considering these parameters, using conventional regression models (ordinary least squares [OLS]) for data analysis could lead to an underestimation of regression standard errors, undermining the reliability of tests (Elovainio et al., 2000; Van Yperen et al., 1999) and increasing the likelihood of Type-1 Errors (Kreft & Leeuw, 1998). This is the reason why a multilevel regression model was considered more appropriate in the present research.
Before proceeding with the model testing, the adequacy of the perceived organizational support measures (collective perception) was examined in order to represent group level attributes (bank branches). This was necessary because, even though perceived organizational support is theoretically defined as a group level construct (Abbad et al., 1999), the data regarding this variable were collected
from individual responses from bank managers. In order to verify if the manager’s individual
perceptions (level 1) could be aggregated (arithmetic mean) to represent the characteristics of the branches where they work (level 2), the intraclass correlation coefficient (ICC) and the interrater agreement index (rwg) were calculated for the four dimensions of perceived support, as James,
justifies the adoption of the arithmetic mean as a level 2 measure. The following coefficients were obtained: material support (ICC = .24; rwg = .93); management performance practices (ICC = .12; rwg =
.94); workload (ICC = .13; rwg = .81); and promotion and reward practices (ICC = .16; rwg = .86).
Although some dimensions of perceived organizational support had shown ICC values of only moderate magnitude (approximately .12), all the dimensions of this construct revealed rwg coefficients
greater than .80, which indicate there was sufficient homogeneity of responses within groups (bank branches) to aggregate individual observations (Kozlowski & Klein, 2000; Kreft & Leeuw, 1998, Tucker, Sinclair, & Thomas, 2005). Together, these coefficients (ICC and rwg) attest to the construct
validity of the aggregate measures (branches averages).
After evaluating all of these requirements, the model was tested. Beforehand, all the explanatory and control variables were standardized, in order to allow for comparisons between the regression coefficients.
The analyses were done in six steps, utilizing the deviance (-2*Loglikelihood) to verify the adjustment of the models, as recommended by Hox (2010). In the first step, the called null or empty model was computed, to define a base of comparison in relation to the following steps (Hox, 2010; Van Yperen et al., 1999) and to decompose the variance of the expression of management competencies in the individual level variance (level 1) and in the branch level variance (level 2)(Van der Vegt et al., 2001). In the second step, control variables were inserted at the individual level (gender, position held, educational level and management experience) and at the branch level (size,
degree of branch’s managerial complexity, and percentage of profit distribution). In the third step,
explanatory variables at the individual level were added (number of T&D hours, the individual deviation for the four factors of perceived organizational support, and the five factors of learning strategies at work). In the fourth step, explanatory variables at the branch level were included (average of T&D hours and the four factors of collective perception of organizational support). In the fifth step, the existence of random effects was verified (Hox, 2010; Kozlowski & Klein, 2000) for level 1 variables, while the sixth step included interactions between explanatory variables from levels 1 and 2.
Data analysis was performed with MLwiN, version 2.02, a software for analyzing hierarchically structured data (Rasbash, Steele, Browne, & Prosser, 2004; Snijders, 2008), using the Iterative Generalized Least Squares (IGLS) estimation method.
Results
In relation to the criterion variable expression of financial business management
competencies, the empty model was initially computed, which revealed an estimate of -2*
Loglikelihood (deviance) equal to 2,673.67. This amount served as a parameter of comparison to verify the adjustment of the models in subsequent stages, once the deviance reflects the lack of adjustment between the data and the model. In step 2, level 1 (individual) and level 2 (branch) control variables were inserted as described in the previous Figure 1. In this stage, three variables revealed
significant effects: degree of branch’s managerial complexity, position held, and education level of the participant; the first one pertaining to level 2 and the last two pertaining to level 1. The deviance was reduced to 2,642.91, and this reduction of 30.46 was significant at 5% level since the chi-square test (dividing the difference in deviance by the degrees of freedom) was above the critical value of 1.96 (Hox, 2010; Snijders, 2008).
Level 1 explanatory variables were inserted in step 3. Significant effects were from: the frequency of use of extrinsic and intrinsic reflection and of seeking help from written material
learning strategies and the individual’s perception (deviation within the branch) about the company’s
performance management practices and the workload (factors of perceived organizational support).
comparing the estimated parameters in steps 1, 2 and 3 for the criterion variable expression of
financial business management competencies. Given such parameters, it is worth mentioning that,
in step 3, the regression coefficients of two control variables lost significance, but these were maintained in the model, for two reasons: (a) they showed significance in step 2, whose adjustment served as a parameter for comparison in relation to the other models; and (b) their removal damaged the adjustment of the model (elevating the deviance).
Table 1
Comparison between Models 1, 2 e 3 for the Expression of Financial Business Management Competencies
Predictor Variables Model 1 (Empty)
Model 2 (Reference): Inclusion of Control
Variables
Model 3: Inclusion of Level 1 Explanatory
Variables
Fixed Parameter Effect (β) and
Standard Error t ratio
Effect (β) and
Standard Error t ratio
Effect (β) and
Standard Error t ratio
(γ00) Intercept 8.02 (.05) --- 8.01 (.05) --- 8.01 (.05) --- (γ01) Degree of branch’s managerial
complexity .11 (.05) 2.20* .09 (.05) 1.80
(γ10) Position held .14 (.05) 2.80* .03 (.05) .60
(γ20) Education level .16 (.05) 3.20* .15 (.05) 3.00*
(γ30) Extrinsic and intrinsic reflection
(learning strategy) .46 (.06) 7.67*
(γ40) Seeking help from written
material (learning strategy) .16 (.06) 2.67*
(γ50) Performance management practices
(perceived organizational support) .14 (.05) 2.80*
(γ60) Workload (perceived support -
individual deviation within the branch) .09 (.04) 2.25*
Random Parameter Variance and
Standard Error t ratio
Variance and
Standard Error t ratio
Variance and
Standard Error t ratio
(σ2
u0) Level 2 Variance .09 (.06) 1.50* .08 (.06) 1.33 .08 (.05) 1.60*
(σ2
e) Level 1 Variance 1.83 (.11) 16.64* 1.77 (.11) 16.10* 1.37 (.08) 17.13*
Model Adjustment
Deviance (-2*Loglikelihood) 2,673.67 2,642.91 2,460.59
Number of estimated parameters 3 6 10
Difference between deviances 30.76 182.32
Difference between no. of parameters (d.f.) 3 4
Test χ2 10.25* 45.58*
Note. *p < .05.
marginally significant at the .10 level, yet it was maintained in the model because its removal damaged the adjustment of the model (elevating the deviance). In this step, a new decrease in the deviance was observed, which shows an improvement in the model fit. According to parameters indicated by Hox (2010) and Snijders (2008), the reduction of 20.59 in the deviance was significant at 5% level, as shown in Table 2, since the chi-square test (χ2 = 4.12, calculated by dividing the difference in deviance by the number of degrees of freedom) was above the critical value of 1.96.
Finally, in step 6, interaction terms were inserted between level 1 and 2 variables. Significant interaction effects were observed between the following variables: (a) the extrinsic and intrinsic
reflection learning strategy and the individual deviation of perceived workload; and (b) the seeking help from written material and the individual deviation of perceived workload. This step revealed
the model with the best adjustment, due to the fact that the inclusion of the previously stated interaction terms brought about a new reduction in the deviance (7.70), which was significant at 5% level (χ2 = 3.85). Employing the procedures recommended by Hox (2010) and Laros and Marciano (2008), the explained variance can be estimated at each level of analysis (approximate R2). After isolating the effects of the control variables (degree of bank branch’s managerial complexity, position held and educational level of the participant), at least 22.6% of level 1 variance and 37.5% of level 2 variance were explained by the other variables of this model. Table 2 shows the estimated parameters in steps 4, 5, and 6 for the criterion variable expression of financial business management
competencies.
Table 2
Comparison between Models 4, 5, and 6 for the Expression of Financial Business Management Competences
Continues
Explanatory Variables
Model 4: Inclusion of Level 2 Explanatory
Variables
Model 5: Inclusion of Random Effects Level 1
Variables
Model 6: Inclusion of Interaction
Terms
Fixed Parameters Effect (β) and
Standard Error t ratio
Effect (β) and
Standard Error t ratio
Effect (β) and
Standard Error t ratio
(γ00) Intercept 8.01 (.05) --- 8.01 (.05) --- 8.01 (.05) ---
(γ01) Degree of branch’s managerial complexity .08 (.05) 1.60 .08 (.05) 1.60 .09 (.05) 1.80
(γ10) Position held .03 (.05) .60 .03 (.05) .60 .03 (.05) .60
(γ20) Education level .14 (.05) 2.80* .13 (.05) 2.60* .12 (.05) 2.40* (γ30) Extrinsic and intrinsic reflection
(learning strategy) .47 (.06) 7.83* .49 (.06) 8.17* .47 (.06) 7.83*
(γ40) Seeking help from written material
(learning strategy) .13 (.06) 2.17* .12 (.06) 2.00* .13 (.06) 2.17*
(γ50) Performance management practices
(perceived organizational support) .14 (.05) 2.80* .13 (.05) 2.60* .14 (.05) 2.80* (γ60) Workload (perceived support -
individual deviation within the branch) .09 (.04) 2.25* .09 (.04) 2.25* .09 (.04) 2.25* (γ02) Number of T&D hours (branch) .15 (.05) 3.00* .15 (.05) 3.00* .15 (.05) 3.00* (γ03) Material support (collective perception
on organizational support) .09 (.04) 2.25* .10 (.04) 2.50* .11 (.04) 2.75* (γ70) Interaction: reflection x workload –
individual deviation -.16 (.06) 2.67*
(γ80) Interaction: seeking material help x
Table 2 (continued)
Note. *p < .05.
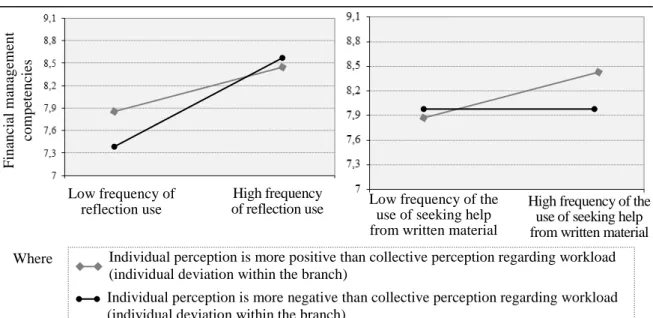
Aiming to examine the nature of the associations between the variables, a plotting of identified interactions was done, using the procedures suggested by Aiken and West (1991). In Figure 2, the first graph shows the relationship between using the reflection learning strategy and the expression of
financial business management competencies, as a function of the difference between individual
and collective perceptions regarding workload (individual deviation within the branch). From the slopes of the regression lines, it is possible to see that when an individual’s perception regarding the
workload is more positive than the branch’s collective perception (a standard deviation above the
difference between individual and group perceptions), the relationship between the use of extrinsic
and intrinsic reflection and the expression of financial business management competencies is
weaker. On the other hand, when an individual perceives the workload as more inadequate compared to the group perception (a standard deviation below the difference between individual and collective perceptions), then the relationship between the reflection and the expression of financial business
management competencies is revealed as stronger. This indicates that the positive individual
deviation of the perceived workload (individual deviation within the branch) lessens the effect of the
extrinsic and intrinsic reflection on the financial business management competencies.
The second graph in Figure 2 shows the relationship between using the strategy of seeking help
from written material and the expression of financial business management competencies, as a
function of the difference between individual and collective perceptions about workload (deviation within the branch). It can be noted that, when the individual’s perception regarding workload is more negative than that of the group (bank branch), the relationship between the use of seeking help from
written material and the expression of financial business management competencies is practically
null. On the other hand, when an individual’s perception regarding workload is more positive than the
group perception, then there exists a reasonable relationship between seeking help from written
material and the expression of these competencies. Better said, the positive individual deviation of the
perceived workload (deviation within the branch) strengthens the effect of seeking help from written
material over the financial business management competencies.
Explanatory Variables
Model 4: Inclusion of Level 2 Explanatory
Variables
Model 5: Inclusion of Random Effects Level 1
Variables
Model 6: Inclusion of Interaction
Terms
Random Parameter – Level 2 Variance and
Standard Error t ratio
Variance and
Standard Error t ratio
Variance and Standard
Error
t ratio
(σ2
u0) Variance - intercept .05 (.05) 1.00 .10 (.05) 2.00* .11 (.05) 2.20*
(σ2
u4) Slope variance - seeking
help from written material .05 (.04) 1.25 .04 (.04) 1.00
(σ2
u5) Slope variance - performance
management practices - deviation .08 (.04) 2.00* .09 (.04) 2.25*
Random Parameter – Level 1 Variance and
Standard Error t ratio
Variance and
Standard Error t ratio
Variance and Standard
Error
t ratio
(σ2
e) Level 1 Variance 1.37 (.08) 17.13* 1.18 (.08) 14.75* 1.17 (.08) 14.63*
Model Adjustment
Deviance (-2*Loglikelihood) 2,444.80 2,424.21 2,416.51
Number of estimated parameters 12 17 19
Difference between deviances 15.79 20.59 7.70
Difference between no. of parameters (d.f.) 2 5 2
Figure 2. Plot of the Moderating Effect Exerted by Workload on Relationships between Learning
Strategies and the Expression of Financial Business Management Competencies
Figure 3 presents the theoretical-empirical model for the expression of financial business management competencies, showing the predictor variables, the nature of the relationships (direct and moderating) and the magnitude of the effect (β) that they exert on the criterion variable.
Finally, following orientations from Rasbash et al. (2004), and Laros and Marciano (2008), graphs on the dispersion of standardized residuals were produced, at levels 1 and 2 of analysis; which indicated that the assumptions of normality of the distribution of residuals, linearity of relationships, and homoscedasticity were not violated by the tested model.
Low frequency of reflection use
High frequency of reflection use
Fin
an
cial
m
an
ag
em
en
t
co
m
p
eten
cie
s
Individual perception is more positive than collective perception regarding workload (individual deviation within the branch)
Individual perception is more negative than collective perception regarding workload (individual deviation within the branch)
High frequency of the use of seeking help from written material Low frequency of the
use of seeking help from written material
Figure 3. Theoretical-empirical Model of the Expression of Financial Business Management
Competencies.
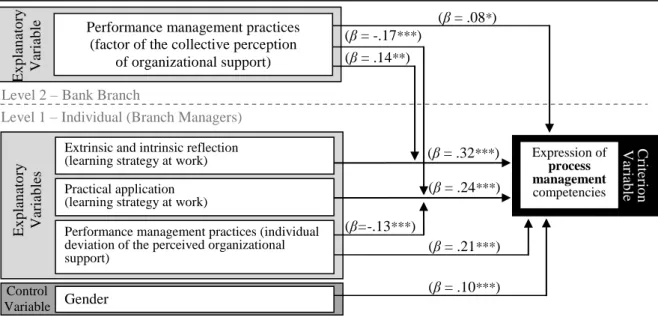
The previously stated steps were also adopted for testing the models relative to the other two criterion variables: the expression of process management and socio-environmental management competencies, whose final results are shown in Figures 4 and 5. After isolating the control variables’ effects, the explanatory variables presented in Figure 4, all together, explain 32.8% (approximate R2) of the variance of process management competencies at the level 1 of analysis (individuals); while those described in Figure 5, all together, explain 25.8% (approximate R2) of the variance of socio-environmental competencies in level 1 (individuals) and 29.2% (approximate R2) of the variance in level 2 (branches).
Level 1 – Individual (Branch Managers) Level 2 – Bank Branch
C
riter
io
n
Var
iab
le
Expression of financial business
management competencies
E
x
p
lan
ato
ry
Var
iab
le
s
Degree of the branch’s managerial complexity
Extrinsic and intrinsic reflection (learning strategy at work)
Number of T&D hours(employees’ average)
Seeking help from written material (learning strategy at work)
E
x
p
lan
ato
ry
Var
iab
les
Material support (factor of the collective perception of organizational support)
Performance management practices (individual deviation of the perceived organizational support)
Position held
Education level
(β = .09)
(β = -.15) (β = .17) Workload (individual deviation of the
perceived organizational support) (β = .09) (β = .15)
(β = .11)
(β = .47)
(β = .13)
(β = .14)
(β = .03) (β = .12) Control
Variable
Figure 4. Theoretical-empirical Model of the Expression of Process Management Competencies.
Note. *p < .05; **p < .01; ***p < .001.
Figure 5. Theoretical-empirical Model of the Expression Socio-environmental Management
Competencies.
Note. *p < .05; **p < .01; ***p < .001. Level 1 – Individual (Branch Managers) Level 2 – Bank Branch
C riter io n Var iab le Expression of socio-environmental management competencies E x p lan ato ry Var iab les
Extrinsic and intrinsic reflection (learning strategy at work) Seeking help from written material (learning strategy at work)
E x p lan ato ry Var iab
les Material support (factor of the collective perception of organizational support)
Performance management practices (individual deviation of perceived organizational support)
C o n tr o l Var iab les Gender Positon held
(β = .16**)
(β = .24***) (β = .13*)
(β = .15*)
(β = .45***)
(β = .19**)
(β = .09*) (β = .19***) Performancemanagementpractices(factorofthe
collective perception of organizational support)
Degree of the branch’s managerial complexity
Number of T&D hours (employees’ average)
(β = .10*) Level 1 – Individual (Branch Managers)
Level 2 – Bank Branch
C riter io n Var iab le Expression of process management competencies E x p lan ato ry Var iab les
Extrinsic and intrinsic reflection (learning strategy at work) Practical application (learning strategy at work)
Performance management practices (individual deviation of the perceived organizational support)
Gender
(β=-.13***)
(β = .21***) (β = .08*) (β = -.17***)
(β = .32***)
(β = .24***)
(β = .10***) (β = .14**)
Performance management practices (factor of the collective perception
of organizational support)
Discussion
This study aimed to examine, through a multilevel analysis, if the attributes of mangers of the Bank of Brazil (level 1 of analysis) and of the bank branches where they worked (level 2) predicted the expression of management competencies at work. Among the variables pertaining to level 2 (branch), the number of T&D hours revealed a significant effect on financial business management competencies (β = .15) and on socio-environmental management competencies (β = .16). The positive regression coefficients show that the greater the number of hours the branch dedicates to T&D activities, the higher the intensity of expression of competencies at work. This result suggests that formal learning occurred: planned and structured learning activities – whether an initiative of the organization or somehow supported by the organization – intended to promote knowledge, skills and attitudes acquisition (Sonnentag et al., 2004).
In what is referred to as perceived organizational support (collective perception), the
performance management practices factor revealed a significant effect on the expression of process
management competencies (β=.08) and of socio-environmental management competencies (β=.15), while the material support factor affected the financial business management competencies (β=.11) and the socio-environmental management competencies (β = .13). The positive regression coefficients
point out that, the better the group’s (branch) perception regarding those dimensions of organizational support, the greater the expression of the competencies of the branch managers. This relationship was expected because, when there are adequate working conditions, organizational support, and orientation, it is more probable that the employee manages to successfully apply knowledge, skills, and attitudes (KSAs) at work (Abbad et al., 2006; Rhoades & Eisenberger, 2002). In order to stimulate
the expression of the managers’ competencies, such results suggest the importance of taking actions regarding individual components for the acquisition of KSAs and regarding organizational aspects, such as creating a context that offers psychosocial and material support to the employee.
Among the variables pertaining to level 1 (individual), the learning strategy named extrinsic and intrinsic reflection showed the greatest contribution to explain the three dimensions of competencies: financial business management (β = .47), socio-environmental management (β = .45), and process management (β = .32). The more frequently this strategy is used, the greater the intensity of expression of competencies at work. In dynamic sectors, such as the financial one, it is common for the manager to have to deal with unprecedented problems and situations, whose solutions are not pre-established. In these cases, it is up to the professional to rely on the act of reflecting upon the individual work and the organization, in order to find solutions to problems. This seems to induce the use of this learning strategy and its effects on the expression of competencies. Given the predictive relevance of this learning strategy, the Bank of Brazil could implement an instructional policy to develop such a strategy in its managerial training courses, making use, for example, of exercises and
case studies that demand the participants’ reflection.
Two other learning strategies revealed less expressive contributions. Seeking help from
written material predicts the expression of financial business management competencies (β = .13) and of socio-environmental management competencies (β = .19), while practical application has a significant effect on the expression of process management competencies (β = .24). This positive effect seems to come from a peculiarity of the banking industry. Banks, in order to reduce being exposed to risks, commonly adopt rigid operational patterns (Banco do Brasil, 2008), usually in the form of written material (rules, regulations and internal proceedings).
strategies lead to competency development and expression, this appears to be the first study dedicated to examining these relationships in a work context.
Still on level 1 of analysis, the difference between individual and collective perception about organizational support (the individual deviation within the branch) exerts some effects. The individual
deviation in relation to the company’s performance management practices, one of the factors of
perceived organizational support, revealed significant effects on the expression of financial business management competencies (β = .14), process management competencies (β = .21), and socio-environmental management competencies (β = .24). The deviation regarding the workload factor, on the other hand, showed an influence (β = .09) on the expression of financial business management competencies. Such effects represent the influence of the individual’s relative standing within the branch – the difference between the individual score and the branch mean in the organizational support factors – on the expression of competencies at work, which some authors refer to as the frog-pond effect (Hox, 2010; Kozlowski & Klein, 2000). These results suggest the importance of providing adequate organizational support to the managers.
Moderating effects exerted by factors of perceived organizational support were also identified.
The manager’s perception regarding workload (individual deviation within the branch): (a) attenuates
the effect of the reflection strategy over the expression of financial business management
competencies; and (b) strengthens the influence exerted by the seeking help from written material
strategy on the expression of those competencies. On the other hand, the collective perception
regarding the company’s performance management practices: (a) attenuates the effect of the practical application strategy over the expression of process management competencies; and (b)
strengthens the effect of the reflection learning strategy over the expression of those competencies. These last interactions indicate that the referred to dimension of organizational support moderates the relationship between the use of learning strategies at work and the expression of process management
competencies.
Furthermore, some level 1 variables (individual), like certain learning strategies employed by managers at work, revealed random effects (Hox, 2010): the magnitude of the influence they exert upon the expression of management competencies varies depending on which branch the individual works in.
Differing from what was expected, some variables, such as the learning strategies of
reproduction and interpersonal help seeking, did not reveal significant effects on any dimension of
management competencies. This result suggests that the use of certain learning strategies does not necessarily result in the development and application of management competencies. Such strategies cannot be useful for all people, occupations and organizations, or for the development of any competency, as suggested by Warr and Downing(2000). Similarly, one of the dimensions of perceived support (promotion and reward practices) turned out to be a non-predictor of management competencies, suggesting that the positive perception regarding dimensions of organizational support do not always results in greater expression of competencies at work.
The method used in this study imposes four main limitations on its results:
. Self-report measures may have resulted in common variance impact. There is also no absolute guarantee that the judgments made by the participants represent reliable indicators of the expression of competencies, since estimates based on self-report could contain imprecision and halo errors (Van Yperen et al., 1999);
. The use of a sample restricted to only one organization provided internal validation, but restricted the results to the company which was studied, preventing generalizations to other organizational contexts;
analyzed sample due to random errors. In this case, perhaps the use of multilevel analysis to test these models would not have been justified.
. The cross-sectional nature of the study precludes causal statements about the relations between the studied variables (Van der Vegt et al., 2001), making it impossible to establish the causal order theoretically hypothesized in Figure 1.
These possible limitations, although they might restrict the results, do not invalidate important contributions offered by this study. The main contribution refers to the explanation of the phenomenon studied by adopting a multilevel model, which had its appropriateness investigated through the use of multilevel analysis. Its utilization provided the identification of diverse types of effects: (a) direct ones exerted by level 1 variables; (b) cross-level direct ones (Kozlowski & Klein, 2000), exerted by level 2 variables; (c) frog-pond ones (Hox, 2010), exerted by the individual’s relative standing within the bank branch; (d) moderating ones exerted by dimensions of perceived organizational support over the relationship between learning strategies and management competencies; and (e) random ones (Kozlowski & Klein, 2000; Kreft & Leeuw, 1998) exerted by level 1 variables.
The results indicate the appropriateness of using multilevel models, given the existing dependency between individual observations within the branches. Its empirical testing allowed more precise predictive estimates and a better examination of the relationships between variables that belong to different analysis levels (individual and branch). The use of this approach helped identify contextual factors that are directly or moderately associated with the expression of competencies at work, making it possible for this study to offer richer and more relevant contributions to the comprehension of the phenomenon under investigation. However, more studies are needed in order to confirm the consistency of these findings, especially in other professional areas, organizations and sectors of the economy.
Received 7 November 2010; received in revised form 14 October 2011.
Notes
1
This article was presented at XXXIV Encontro da Associação dos Programas de Pós-Graduação e Pesquisa em Administração – EnANPAD (the 34th Encounter of the Brazilian Academy of Management), September, 2010, under the title Relações entre aprendizagem, contexto e competência: um estudo multinível (Relationships between learning, context, and competency: a multilevel study).
2
In the literature about the subject, there exists a great variety of concepts for defining competency. This study does not intend to discuss the various theoretical currents and conceptual approaches which exist, since the subject has sufficiently been covered by many authors, such as McLagan (1997) and Gonczi (1999), among others.
3
Procedure that consists of previously submitting the questionnaire to some members of the population of interest and later to interview them, with the purpose of identifying and correcting eventual errors, suggestive items, and ambiguities in the instrument, in order to guarantee that the statements and scales are adequately understood by the research participants (Pasquali, L. (1998). Psicometria: teoria e aplicações. Brasília: Ed. Universidade de Brasília).
4
Besides, after collecting the primary data, all items representing the three perceptual measures (management competencies, learning strategies, and perceived organizational support) were subjected to a discriminating factor analysis, using procedures suggested by Hair, J. F., Jr., Anderson, R. E., Tatham, R. L., & Black, W. C. (1998). Multivariate data analysis. New Jersey: Prentice-Hall and Van Yperen et al. (1999), which provide evidence that the three scales represents empirically distinguishable constructs.
References
desenvolvimento e educação em organizações e trabalho: fundamentos para a gestão de pessoas (pp. 231-254). Porto Alegre: Artmed/Bookman.
Abbad, G., Pilati, R., & Borges-Andrade, J. E. (1999). Percepção de suporte organizacional: desenvolvimento e validação de um questionário. Revista de Administração Contemporânea, 3(2), 29-51. doi: 10.1590/S1415-65551999000200003
Aiken, L. S., & West, S. G. (1991). Multiple regression: testing and interpreting interactions. Thousand Oaks: Sage.
Banco do Brasil. (2008). Quem somos. Retrieved September 11, 2008, from http://www.bb.com.br/portalbb/home2,102,102,1,0,1,6.bb.
Boak, G., & Coolican, D. (2001). Competencies for retail leadership: accurate, acceptable, affordable. Leadership and Organization Development Journal, 22(5), 212-220. doi: 10.1108/EUM0000000005675
Brandão, H. P. (2007). Competências no trabalho: uma revisão crítica da produção científica brasileira. Revista Estudos de Psicologia, 12(2), 149-158. doi: 10.1590/S1413-294X2007000200007
Brandão, H. P., & Borges-Andrade, J. E. (2008). Learning strategies at work, perceived organizational support and professional experience as predictors of the expression of management competencies. Poster session presented at the Institute of Work Psychology International Conference, The University of Sheffield, UK.
Brandão, H. P., & Borges-Andrade, J. E. (2011). Desenvolvimento e validação de uma escala de estratégias de aprendizagem no trabalho. Revista Psicologia: Reflexão e Crítica, 24(3), 448-457. doi: 10.1590/S0102-79722011000300005
Brandão, H. P., Borges-Andrade, J. E., Freitas, I. A., & Vieira, F. T. (2010). Desenvolvimento e estrutura interna de uma escala de competências gerenciais. Revista Psicologia: Teoria e Pesquisa, 26(1), 43-54. doi: 10.1590/S0102-37722010000100019
Brandão, H. P., Zimmer, M. V., Guarçoni, C. P., Marques, F., Viana, H., Carbone, P. P., & Almada, V. F. (2008). Gestão de desempenho por competências: integrando a gestão por competências, o balanced scorecard e a avaliação 360 graus. Revista de Administração Pública, 42(5), 875-898. doi: 10.1590/S0034-76122008000500004
Calhoun, J. G., Vincent, E. T., Calhoun, G. L., & Brandsen, L. E. (2008). Why competencies in graduate health management and policy education? Journal of Health Administration Education, 25(1), 17-35.
Cockerill, T. (1994). The king of competence for rapid change. In C. Mabey & P. Iles (Eds.), Managing learning (pp. 70-76). London: Routledge.
DeNisi, A. S. (2000). Performance appraisal and performance management: a multilevel analysis. In K. J. Klein & S. W. J. Kozlowski (Eds.), Multilevel theory, research and methods in organizations: foundations, extensions and new directions (pp. 121-156). San Francisco: Jossey-Bass.
Durand, T.(2000). L’alchimie de la compétence. Revue Française de Gestion, 127(1), 84-102.
Eisenberger, R., Huntington, R., Hutchison, S., & Sowa, D. (1986). Perceived organizational support. Journal of Applied Psychology, 71(3), 500-507. doi: 10.1037/0021-9010.71.3.500
control and personality. Journal of Occupational Health Psychology, 5(2), 269-277. doi: 10.1037/1076-8998.5.2.269
Felix, C. M. R. (2005). A prática de competências gerenciais no setor público. Revista de Administração Pública, 39(2), 255-278.
Freitas, I. A., & Brandão, H. P. (2006). Trilhas de aprendizagem como estratégia de TD&E. In J. E. Borges-Andrade, G. Abbad, & L. Mourão (Eds.), Treinamento, desenvolvimento e educação em organizações e trabalho: fundamentos para a gestão de pessoas (pp. 97-113). Porto Alegre: Artmed/Bookman.
Gonczi, A. (1999). Competency-based learning: a dubious past – an assured future? In D. Boud & J. Garrick (Eds.), Understanding learning at work (pp. 180-194). London: Routledge.
Heene, A., & Sanchez, R. (1997). Competence based strategic management. Chichester, England: John Wiley & Sons Ltd.
Holman, D., Epitropaki, O., & Fernie, S. (2001). Understanding learning strategies in the workplace: a factor analytic investigation. Journal of Occupational and Organizational Psychology, 74(5), 675-682. doi: 10.1348/096317901167587
Hox, J. J. (2010). Multilevel analysis: techniques and applications (2nd ed.). New York: Routledge.
Illeris, K. (2004). A model for learning in working life. The Journal of Workplace Learning, 16(8), 431-441. doi: 10.1108/13665620410566405
James, L., Demaree, R., & Wolf, G. (1993). rwg: an assessment of within-group interrater agreement. Journal of Applied Psychology, 78(2), 306-309. doi: 10.1037/0021-9010.78.2.306
Jex, S. M., & Bliese, P. D. (1999). Efficacy beliefs as a moderator of the impact of work-related stressors: a multilevel study. Journal of Applied Psychology, 84(3), 349-361. doi: 10.1037/0021-9010.84.3.349
Kaplan, R., & Norton, D. P. (1997). The balanced scorecard. Boston: Harvard Business School Press.
Kozlowski, S. W. J., & Klein, K. J. (2000). A multilevel approach to theory and research in organizations: contextual, temporal and emergent processes. In K. J. Klein & S. W. J. Kozlowski (Eds.), Multilevel theory, research and methods in organizations: foundations, extensions and new directions (pp. 03-90). San Francisco: Jossey-Bass.
Kreft, I., & Leeuw, J.de (1998). Introducing multilevel modeling. London:Sage Publications.
Laros, J. A., & Marciano, J. L. P. (2008). Análise multinível aplicada a dados do NELS:88. Estudos em Avaliação Educacional, 19(40), 263-278.
Leite, J. B. D., & Porsse, M. C. S. (2003). Competição baseada em competências e aprendizagem organizacional: em busca da vantagem competitiva [Special Issue]. Revista de Administração Contemporânea, 7, 121-144. doi: 10.1590/S1415-65552003000500007
Le Boterf,G.(1999).Competénce et navigation professionnelle. Paris:Éditionsd’Organisation.
Maas, C. J. M., & Hox, J. J. (2004). The influence of violations of assumptions on multilevel parameter estimates and their standard errors. Computational Statistics & Data Analysis, 46(3), 427-440. doi: 10.1016/j.csda.2003.08.006
Maas, C. J. M., & Hox, J. J. (2005). Sufficient sample sizes for multilevel modeling. Methodology, 1(3), 86-92. doi: 10.1027/1614-1881.1.3.86
Miles, J., & Shevlin, M. (2001). Applying regression and correlation. London: Sage.
Pantoja, M. J. (2004). Estratégias de aprendizagem no trabalho e percepções de suporte à aprendizagem contínua: uma análise multinível (Doctoral dissertation). Universidade de Brasília, Brasília, DF, Brazil.
Pozo, J.I.(2000). Aprendices y maestros: la nueva cultura del aprendizaje. Madrid:Alianza.
Rasbash, J., Steele, F., Browne, W., & Prosser, B. (2004). A user’s guide to MLwiN Version 2.0. London: Institute of Education, University of London.
Rhoades, L., & Eisenberger, R. (2002). Perceived organizational support: a review of the literature. Journal of Applied Psychology, 87(4), 698-714. doi: 10.1037/0021-9010.87.4.698
Snijders, T. (2008). Example session MLwiN. Retrieved April 10, 2008, from http://stat.gamma.rug.nl/snijders/
Snijders, T., & Bosker, R. (1999). Multilevel analysis: an introduction to basic and advanced multilevel modeling. Thousand Oaks: Sage Publications.
Sonnentag, S., & Kleine, B. (2000). Deliberate practice at work: a study with insurance agents. Journal of Occupational and Organizational Psychology, 73(1), 87-102. doi: 10.1348/096317900166895
Sonnentag, S., Niessen, C., & Ohly, S. (2004). Learning at work: training and development. International Review of Industrial and Organizational Psychology, 19, 249-289. doi: 10.1002/0470013311.ch8
Tabachnick, B. G., & Fidell, L. S. (2007). Using multivariate statistics. Boston: Pearson.
Tucker, J. S., Sinclair, R. R., & Thomas, J. L. (2005). The multilevel effects of occupational stressors
on soldiers’ well-being: organizational attachment, and readiness. Journal of Occupational Health Psychology, 10(3), 276-299. doi: 10.1037/1076-8998.10.3.276
Van der Vegt, G., Emans, B., & Van de Vliert, E. (2001). Patterns of interdependence in work teams: a two-level investigation of the relations with job and team satisfaction. Personnel Psychology, 54(1), 51-69. doi: 10.1111/j.1744-6570.2001.tb00085.x
Van Yperen, N. W., Van den Berg, A. E., & Willering, M. C. (1999). Towards a better understanding of the link between participation in decision-making and organizational citizenship behaviour: a multilevel analysis. Journal of Occupational and Organizational Psychology, 72(3), 377-392. doi: 10.1348/096317999166734
Warr, P., & Downing, J. (2000). Learning strategies, learning anxiety and knowledge acquisition. British Journal of Psychology, 91(3), 311-333. doi: 10.1348/000712600161853
Whiddett, S., & Hollyforde, S. (1999). The competencies handbook. London: Institute of Personnel and Development.