BAR, v. 1, n. 1, p. 16-33, Jul./Dec. 2004
Technological Strategies of Transnational Corporations
Affiliates in Brazil
Eliane Franco*
E-mail address: [email protected] UNICAMP
Campinas, SP, Brazil
Ruy de Quadros Carvalho
E-mail address: [email protected] UNICAMPCampinas, SP, Brazil
A
BSTRACTThis paper presents an analysis of the technological efforts made by Transnational Corporations(1) (TNCs) affiliates in Brazil. Many studies have indicated that most TNCs concentrate their main technological activities in their home, developed countries. However, empirical investigation has shown TNC affiliates in Brazil have presented a higher profile than local firms in terms of both innovative performance and R&D efforts. This study is an attempt to examine the technological efforts of TNC affiliates in Brazil and their main determinants, considering the recent changes in TNC strategies for global organization of production and technological activities. The study is based on data analysis from 450 firms controlled by foreign capital operating in São Paulo State in 1996. The database was taken from the first PAEP – Pesquisa da Atividade Econômica Paulista –, which comprises not only economic indicators, but also includes an innovation survey based on OECD guidelines. Using multivariate techniques, we have identified distinct strategies of TNCs subsidiaries in regard to technological activities, which reflect different technological effort patterns. In addition, the article reveals that such diversity of technological strategies has been influenced by the size of firms, the industrial sector to which the firm belongs and the nationality of foreign capital, in this order.
Key words: technological strategies; transnational corporations; developing countries.
Received 01 December 2003; received in revised form 27 July 2004.
Copyright © 2004 Brazilian Administration Review. All rights reserved, including rights for
translation. Parts of this work may be quoted without prior knowledge on the condition that
the source is identified.
* Corresponding author: Eliane Franco
I
NTRODUCTIONThis paper presents an analysis of the technological efforts made by Transnational Corporations' (TNCs) affiliates in Brazil. Many studies have indicated that most TNCs concentrate their main technological efforts in their home, developed countries. In home countries they have developed links with strong scientific and technological institutions; moreover, the most skilled researchers and production teams are located in developed countries (CANTWELL, 2001; DUNNING, 1993; KUMAR, 2001; MOWERY, 1999). On the other hand, most TNC subsidiaries in developing countries are rather users of existing technologies than inventors of entirely new products and services. Indeed, with few exceptions, their technological efforts are concentrated on acquiring, adapting and improving technologies developed abroad rather than creating new technologies. Hence the TNC affiliates in developing countries are more likely to transfer the results of innovation than transfer innovation capability (LALL, 1996), which is not necessarily an obstacle but certainly a limitation for the deepening of local technological learning (ERBER, 2000).
Nevertheless, it is important to regard recent changes in TNC strategies of global organization of production and technological activities. As part of the increasing production specialization and integration of TNC activities in global networks, they have been more inclined to decentralize R&D activities in order to tap the comparative advantages of host countries (CANTWELL; MUDAMBI, 2001). In this process, host countries with a minimum level of local capabilities, which allow them to provide complementary assets to TNCs (skills, infrastructure, services, supply networks) can benefit from the spillovers of the presence of foreign corporations (LALL, 1996; 2000)
This research is an attempt to examine technological efforts of TNC affiliates in Brazil – one of the largest receptors of Foreign Direct Investment among developing countries (UNCTAD, 2000) – and their main determinants. The empirical study is based on factor analysis, which comprises indicators of different types of technological inputs (activities) exercised by TNC subsidiaries. Such indicators were taken from an innovation survey database, which has been based on the OECD guidelines for innovation surveys (Oslo Manual). We have identified distinct behaviours or strategies of TNC subsidiaries with regard to technological activities, which reflect different technological effort patterns. In addition, we show that such diversity of technological strategies has been influenced by the size of firms, the industrial sector to which the firm belongs and the nationality of foreign capital.
The paper is organized as follows. In next section we present some empirical evidence and the theoretical analytical framework, which will give support to the hypothesis of the existence of different technological orientations in TNC subsidiaries and the influence of the economic attributes of firms – sector, firm-size and nationality of foreign capital – on the diversity of strategies. Section Method and Empirical Results discusses the methodology used to explore the database and the results of research, that is, the patterns of technological effort found and how the selected economic determinants can affect them in different ways. The closing section outlines the paper’s concluding remarks.
T
ECHNOLOGICALE
FFORTS OFTNC
A
FFILIATES IND
EVELOPINGC
OUNTRIES:
E
MPIRICALE
VIDENCE ANDA
NALYTICALF
RAMEWORKEmpirical Evidence
Multinationals in the Malaysian electronics industry, for instance, have been upgraded from simple to advanced, complex process and higher value-added products (ISMAIL, 1999). This has been achieved not merely by means of transferring technologies developed by a parent firm to subsidiaries, but particularly by transferring learning and skills through collaborative innovation projects with their parent or sister firms (ARIFFIN; BELL, 1999). However, this process has been neither linear nor homogeneous and depends on several factors, such as government policy, parent corporate nationality, subsidiary strategy and the type of product manufactured (ARIFFIN; BELL, 1999, p.181).
In Singapore, the increasing R&D efforts made by TNC subsidiaries in the electronic industry have been carried out thanks to pro-active government policies related to supplying experienced and highly educated personnel working in government-owned institutes and labs. Through joint public-private collaboration, research institutions and their experienced staff have been the most important local asset motivating TNC subsidiaries to undertake technological activities, from exploratory, advanced product and process development to applied and sometimes even basic research (AMSDEN, 2001).
The availability of R&D personnel has also been pointed out as the main reason for TNC subsidiaries establishing R&D units in India, in all types of industries, from conventional (chemical, pesticides, fertilizers, pharmaceutical, engineering and branded consumer goods) to new technologies (electronics, biotechnology and solar energy) (REDDY, 1997). Another important result of Reddy’s research was the identification of differences between both kinds of industries (conventional and high-tech) in terms of local strategic asset acquisition for increasing their technological capabilities. Regarding this point, “…new technologies TNCs have established more linkages with the local industry than the conventional technologies TNCs. On the other hand, TNCs dealing with conventional technologies have more linkages with the local academic system" (REDDY, 1997, p. 182). Therefore, the empirical results showed that heterogeneity of technological behaviours in TNC affiliates has been heavily influenced by the type of local assets in the host country, as well as the industrial sector and technological nature of the product.
In Brazil, empirical studies have also drawn attention to the influence of capital ownership on a firm’s technological effort. They have suggested that, in spite of the fact that R&D effort made by firms in São Paulo (Brazil) is relatively weak compared to industrialized countries, the R&D intensity(1) in these firms wholly or partially controlled by foreign capital is substantially greater than that of firms wholly owned by Brazilians (QUADROS et al., 2001, p. 213; COSTA; QUEIROZ, 2002). In fact, the results have shown that not only have foreign firms in Brazil developed higher R&D effort vis-à-vis the wholly Brazilian owned firms, but also that the former are more likely to innovate, i.e., they present a higher propensity to introduce new products/processes into the market when compared to locally controlled firms. With respect to the latter, the differences in innovative performance between both groups of firms (Brazilian and foreign owned) are more expressive among the larger firms, particularly in the group with 500 employees or more (COSTA; QUEIROZ, 2002, p. 210)(2). It suggests that firm-size and capital ownership have significant importance in the innovative performance and technological effort.
Moreover, Quadros and Queiroz (2001) found different strategies within the group of TNC subsidiaries of auto assemblers in Brazil and Argentina. They emphasize: “the type of product policy adopted by assemblers, particularly their approach to the globalisation of platforms and models, has important consequences on the tendency for increasing or decreasing local design activities” (p. 12). To put it in detail, whereas companies such as General Motors and Fiat have adopted a more intensive local effort in designing regional derivatives of their global platforms, Ford and Renault have conducted a more centralized strategy to globalization in search for a truly global car.
efforts, from physical investment and informal engineering activities to expenditure on formal R&D. Furthermore, the way affiliates have carried out technological efforts depends on some firms’ attributes – such as the ownership (or nationality) of foreign capital and size (or scale) of operation – and economic aspects on the aggregate level, especially the technological nature of the industrial sector to which the firm belongs.
Therefore, in order to investigate what kind of strategies can be found in affiliates located in Brazil and their relationships with corporation strategy, firm-size and sector, this study used a particular database and statistical techniques for analyzing the results. The methodology will be presented in the next section.
M
ETHOD ANDE
MPIRICALR
ESULTSThe Sample and Its Economic Representativeness
This study makes use of the PAEP database, which was produced by the SEADE Foundation – Sistema Estadual de Análise de Dados(3). It is an economic survey, which was conducted among 10.600 industrial firms (with data referring to 1996) in the State of São Paulo (Brazil). The survey has also included innovation questions based on the Oslo Manual methodology, the main reference for developing international innovation surveys that are applied in OECD member countries – Organization for Economic Co-operation and Development (OECD 1997). For the purpose of our analysis, a sub-sample of the PAEP database was preliminarily selected. This included the set of firms either wholly or partially controlled by foreign capital named TNC affiliates. The sub-sample comprises nearly 450 medium and large firms (with 100 or more employees) either wholly or partially controlled by foreign capital, which operated in State of São Paulo in 1996(4).
The fact that the article draws on a database, which is now considerably dated, certainly raises doubts about how far ahead the findings of the research could be extended. However, apart from the constraints imposed by the fact that at the time of research this was the only similar source of information available(5), there are good reasons to believe that such findings refer to structural features of firms, which do not change swiftly. Indeed, 1996, the year of reference for data collected by the PAEP survey, was extremely important in terms of structural changes in the Brazilian economy. Investment in the manufacturing industry increased, spurred on by internal stabilization, market liberalization, exchange rate appreciation and intensive FDI inflows(6). The latter contributed to the diffusion of new technologies and organizational methods in the manufacturing industry. Firm restructuring translated into productivity rises, cost rationalization and the expansion of profit margins. Since the restructuring process takes time to show results along supply chains, we assume that the economy continues incorporating such changes until now and to a great extent. Moreover, São Paulo State has also been the most representative region, not only in economic terms but also regarding FDI participation, accounting for 70% of all TNC affiliates in Brazil.
Identifying the PTEs
In order to identify different patterns or strategies of technological efforts in affiliates, five variables of technological inputs have been selected in the database:
1) Royalty payments – e.g. licensing expenses with patents, know-how, trademark and technical assistance – abroad;
2) Royalty payments in Brazil;
3) Investment in imported capital goods (machines and equipments); 4) Investment in Brazilian made capital goods;
5) Graduate employees engaged, full or part time, in internal R&D activities.
Variables 1 and 2 indicate the effort made by the firm in purchasing “codified information or disembodied technology”, while variables 3 and 4 are a proxy of the effort made in purchasing “capital goods or embodied technology” (HAQUE et al., 1995, p. 72). In other words, variables 1/2 and 3/4 express distinct kinds of efforts of firms in acquiring externally existing technologies as they are differentiated on the basis of age, complexity and packaging of technologies (AGGARWAL, 2002, p. 124). In general terms, the non-formal technology transfer by acquisition of capital goods has cost advantages comparing to disembodied technology acquisition, since contracts of patents and know-how licensing involve a more complex technology and tacit knowledge (KIM et al., 1999, p. 95).
Variable 5 represents the endogenous effort of the firm in technological learning by expenses in highly-skilled human capital. It covers systematic R&D efforts, which are usually developed by large companies in R&D laboratories, as well as occasional product and process engineering activities mostly made by smaller firms. Moreover, this variable could be considered a proxy for tacit technological learning, expressed in skills, experience and nor-codified knowledge acquired by human resources in their intra and inter-firm linkages and with other institutions (BELL; PAVITT, 1993; 1995; FIGUEIREDO, 2002; CANTWELL, 2001).
In order to achieve a better understanding of the structure explained and analyse the pattern of interrelationships between them, Factor Analysis was used. This is a technique by which multiple variables, all related to one another, can be simultaneously considered in an attempt to summarize them into a smaller set of components (factors) with a minimum loss of information (HAIR et al, 1998).
In addition, because of the large standard deviation in the distribution of the 5 variables – due to the occurrence of a large number of firms with values close to “zero”, on the one hand, and a small number of firms with high values, on the other – normalization was required. Afterwards, the original variables of expenses in royalties (1 and 2) and investment in capital goods (3 and 4) were weighted by the net revenue(7) of the firm, whereas variable 5 – personnel engaged in local R&D activities – was weighted by the total employment of the firm. The weightings cover two strategies. One is analytical, providing a proxy for the intensity of expenses with embodied and disembodied technology (based on variables 1 to 4) and intensity of local and internal technological effort (based on variable 5). The second is statistical, reducing the dispersion coefficients of the variables and preserving the relation between them.
Table 1: Factor Analysis of Technological Efforts Variables in Sample of Firms Controlled by Foreign Capitala (Varimax Rotation/Principal Component Extraction)
Factor Loadingsb Variables
FACTOR 1 FACTOR 2 FACTOR 3
Royalty payments (abroad) 0,854 0,032 -0,032
Royalty payments (Brazil) 0,851 -0,059 0,009
Investments in imported capital goods -0,015 0,141 0,859 Investments in Brazilian made capital goods -0,028 0,839 0,19 Graduated employees engaged in R&D 0,009 0,586 -0,536
% Variance (total=71,8) 29,3 22,0 20,5
Source: PAEP/SEADE, 1996.
a) Include only the foreign capital firms with 100 or more employees which have developed systematic or occasional R&D activities (454 cases)
b) Indicate the degree of correlation between the variable and the factor
The result of Factor Analysis (Table 1) shows 3 factors, which represent 3 PTEs – Patterns of Technological Effort – found in the sample of affiliates:
. PTE 1: composed by a highly-positive coefficient of correlation in royalties payments, abroad and in Brazil, expresses a pattern of technological effort based on licensing or disembodied technology; . PTE 2: derived from positive correlations between investment in national machines/equipment and
staff employed in R&D, indicates a pattern of technological effort oriented to domestic asset acquisition;
. PTE 3: identified by the reverse correlation between acquisition of imported machines/equipments and staff in R&D, indicates a pattern of technological effort oriented to imported capital goods acquisition.
Based on the three main components (or factors) of correlations among the variables inserted in Factor Analysis, all firms received a “score” for the PTEs identified. Such scores represent the level of correlation of each factor (or PTE) for each firm. Since there is a coefficient of correlation (or score) incident in each firm, the PTEs are not mutually exclusive In other words, the PTE scores are not constructed to compose groups or clusters of firms, but to indicate what is the predominant score (and therefore, the PTE) in each firm. For example, if firm ‘X’ receives a 4.26 score in PTE1, 0.42 in PTE2 and 0.30 in PTE3(8), the coefficients indicate that firm X is more engaged in technological effort based on licensing than others strategies (imported capital goods acquisition or domestic assets oriented) and so on.
After the PTEs were composed for each firm in the sample of affiliates, an aggregate analysis tested the influence of size, sector and nationality of the foreign controller on the PTEs of foreign-controlled firms. This was done using the Answer Tree technique. This is a classification system, which selects the best predictors for a target variable based on summary statistic (F-statistic)(9). Simultaneously, it creates groups or clusters (named “nodes”) which are the best sub-sets of cases within each selected predictor. The exogenous variables (or predictors) selected to explain the PTEs (dependent variables) were the following:
. Number of employees, indicating the firm SIZE;
. Two digital level of CNAE – Classificação Nacional de Atividades Industriais, based on ISIC (rev-3) – representing the industrial activity SECTOR of the firm;
The Answer Tree technique has some advantages for analyzing the sample of affiliates and the influence of selected determinants on the PTEs. Firstly, the segmentation can identify which group of sectors, firm-size or nationality of capital is more associated with the highest scores of PTEs. The results should operate as an accurate policy instrument, since focus lies on an aggregate of enterprises, which is more oriented to undertake a specific technological strategy. Secondly, it can simultaneously combine and analyze a diversity of explanatory variables, including multiple-category non-metric variables, like groups of industries (19 categories) (10).
Empirical Results
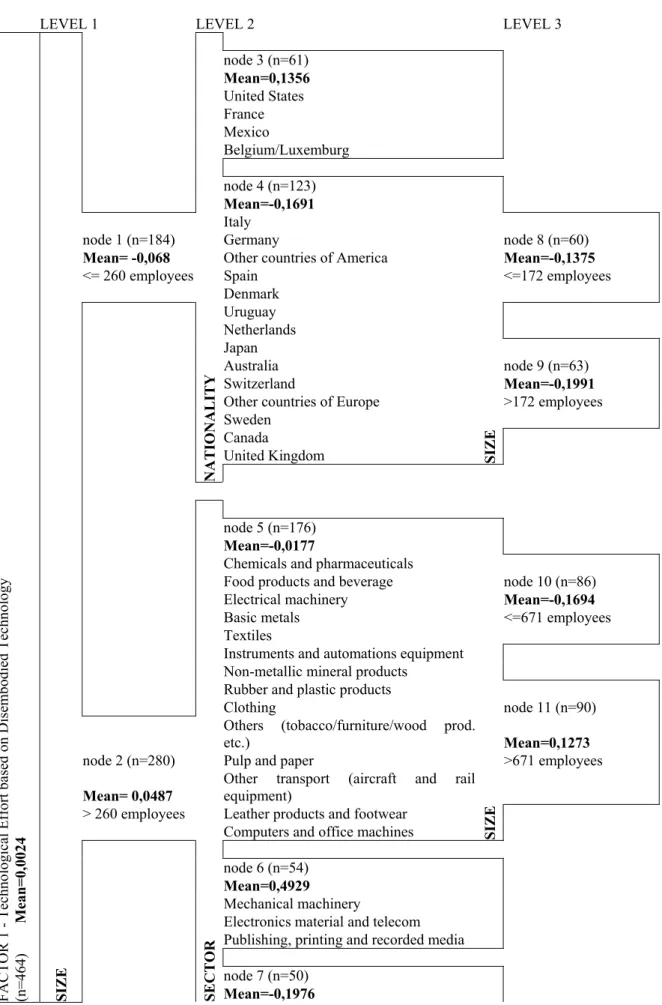
With reference to the segmentation tree for PTE 1 (Figure 1), all the exogenous variables (size, sector and nationality) have been classified as significant in order to explain differences in licensing-oriented strategy in affiliates.
However, Figure 1 shows that the main predictor for PTE 1 was the firm-size. The positive score suggests that foreign firms with over 260 employees are more likely to carry out expenses in disembodied technology (local or foreign). On the other hand, the negative scores indicate that smaller firms are more engaged in acquiring one of them. This trend is more obvious in the group of intermediate firms, with more than 172 employees, from a diversity of countries (node 9), as well as in two sectors – metal products and motor vehicles – of firms with more than 260 employees (node 7). Similar scores can also be found in the group of firms with 671 employees or less from the mostly from the manufacturing sectors (node 10).
Figure 1: Answer Tree Segmentation for PTE 1 (Pattern of Technological Effort based on Disembodied Technology)
LEVEL 1 LEVEL 2 LEVEL 3
node 3 (n=61)
Mean=0,1356 United States France Mexico Belgium/Luxemburg
node 4 (n=123) Mean=-0,1691
Italy
node 1 (n=184) Germany node 8 (n=60)
Mean= -0,068 Other countries of America Mean=-0,1375
<= 260 employees Spain <=172 employees
Denmark
Uruguay Netherlands Japan
Australia node 9 (n=63)
Switzerland Mean=-0,1991
Other countries of Europe >172 employees Sweden
Canada
United Kingdom SIZE
N A TI O N A LI TY
node 5 (n=176) Mean=-0,0177
Chemicals and pharmaceuticals
Food products and beverage node 10 (n=86)
Electrical machinery Mean=-0,1694
Basic metals <=671 employees
Textiles
Instruments and automations equipment Non-metallic mineral products Rubber and plastic products
Clothing node 11 (n=90)
Others (tobacco/furniture/wood prod.
etc.) Mean=0,1273
node 2 (n=280) Pulp and paper >671 employees
Mean= 0,0487
Other transport (aircraft and rail
equipment) > 260 employees Leather products and footwear
Computers and office machines SIZE
node 6 (n=54)
Mean=0,4929
Mechanical machinery Electronics material and telecom Publishing, printing and recorded media
node 7 (n=50)
Metals products
Motor vehicles
Source: PAEP/SEADE, 1996.
Figure 2: Answer Tree Segmentation for the PTE 2 (Pattern of Technological Effort based on Local Assets)
LEVEL 1 LEVEL 2
node 1 (n=231) Mean= 0,0173 <= 365 employees
node 2 (n=94) Mean= -0,1616 366 to 671 employees
node 4 (n=78) Mean=0,2691
United States
Other countries of Western America France
Belgium/Luxemburg Switzerland
Other countries of Europe
Sweden
node 3 (n=139) Argentina
Mean= 0,1061 Canada
> 671 employees United Kingdom
node 5 (n=61) Mean=-0,1024
Italy Germany Netherlands Japan
Other countries of Eastern America
F
A
CT
O
R 2 - T
ec hnol ogi ca l E ffort ba se d i n L oc al A ss et s (n = 46 4) M ea n = 0,007 7 S IZE N A TI O N A LI TY
Source: PAEP/SEADE, 1996.
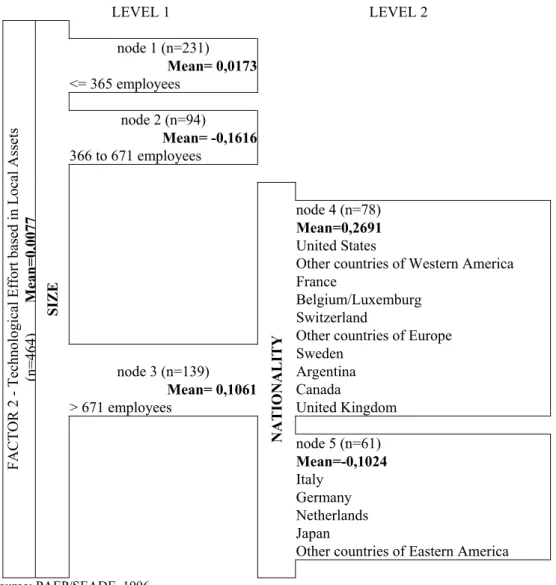
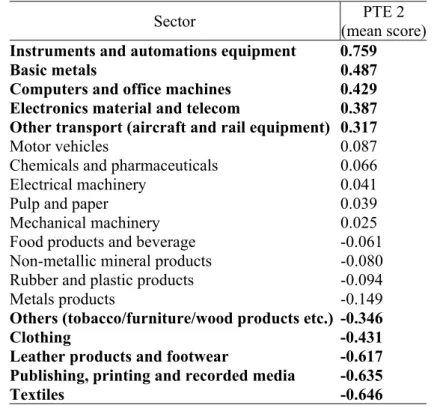
However, since the identification of the sector is a crucial indicator for policy making, specially regarding the technological behavior of multinationals based on local assets, a simple crossing between the mean score of PTE 2 and industrial sectors was carried out. The ranking correlation discloses substantial differences of PTE 2 across industries (Table 2). However, because of the greater statistical significance of size firm in the Answer Tree Aggregate Analysis (Figure 2), the sector effect was annulated. As can be seen in Table 2, five industries have presented the highest positive scores: instruments and automation equipment, basic metals, computers and office machines, electronics material, telecom, aircraft and rail equipment. Except for basic metal, the other four sectors are considered “science-based”, according to Pavitt’s classification (PAVIT, 1984 apud BELL; PAVITT, 1993), and heavily dependent on knowledge and skills to develop technological learning and innovation capacity.
Table 2: Mean Scores of PTE 2 (Technological Effort based in Local Assets) in Foreign Firms (1), by Industrial Sectors
Sector PTE 2
(mean score) Instruments and automations equipment 0.759
Basic metals 0.487
Computers and office machines 0.429 Electronics material and telecom 0.387 Other transport (aircraft and rail equipment) 0.317
Motor vehicles 0.087
Chemicals and pharmaceuticals 0.066
Electrical machinery 0.041
Pulp and paper 0.039
Mechanical machinery 0.025
Food products and beverage -0.061 Non-metallic mineral products -0.080
Rubber and plastic products -0.094
Metals products -0.149
Others (tobacco/furniture/wood products etc.) -0.346
Clothing -0.431 Leather products and footwear -0.617
Publishing, printing and recorded media -0.635
Textiles -0.646 Source: PAEP/SEADE, 1996
(1) Only firms controlled by foreign capital, with 100 or more employees, which carried out systematic or non-systematic internal R&D activity
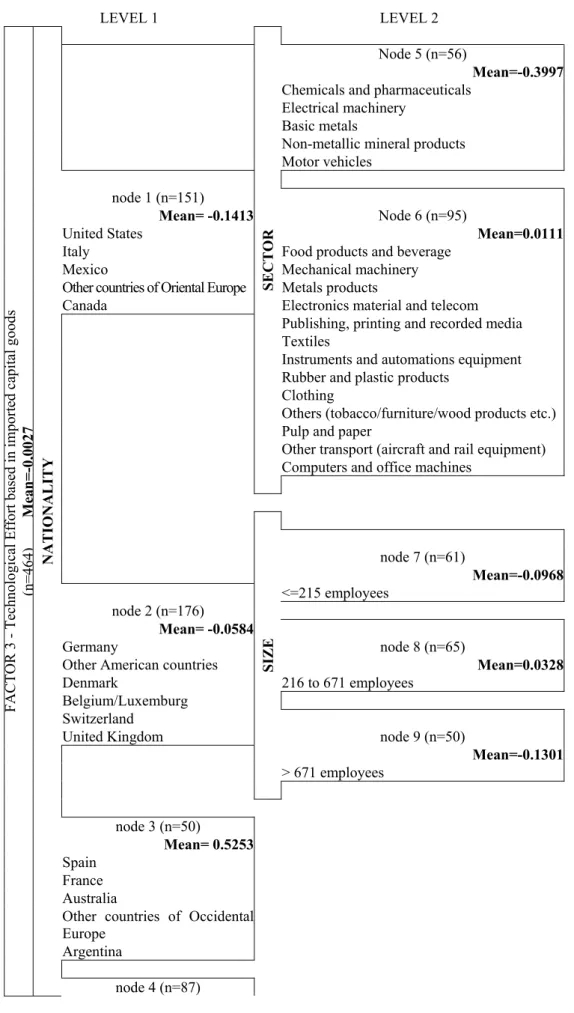
In contrast to the former Answer Tree configurations, where the firm size was considered the main determinant to explain different behaviors in PTE 1 and PTE 2, the first predictor for PTE 3 was the nationality variable (Figure 3). It suggests that foreign firms with diverse sizes and sectors develop technical changes based in imported capital goods. Such a result is totally in line with the general strategy of TNCs, i.e., they have taken advantage of trade liberalization to carry out technological transfer based on the importation of equipment.
In spite of this general trend, the highest positive score showed in “node 3” indicates that the affiliates in Spain, France, Australia and Argentina are more likely to import capital goods than the affiliates in other countries. However, the high positive coefficient may indicate the contrary: that this group has increased the local technological capability based on internal R&D activities. However, a more detailed examination of the determinants of PTE 3 showed the high positive correlation in node 3 is more related to equipment import rather than R&D effort.
Figure 3: Answer Tree Segmentation for the PTE 3 (Pattern of Technological Effort based on Imported Capital Goods)
LEVEL 1 LEVEL 2
Node 5 (n=56)
Mean=-0.3997 Chemicals and pharmaceuticals
Electrical machinery
Basic metals
Non-metallic mineral products
Motor vehicles
node 1 (n=151)
Mean= -0.1413 Node 6 (n=95)
United States Mean=0.0111
Italy Food products and beverage
Mexico Mechanical machinery
Other countries of Oriental Europe Metals products
Canada Electronics material and telecom Publishing, printing and recorded media
Textiles
Instruments and automations equipment
Rubber and plastic products
Clothing Others (tobacco/furniture/wood products etc.)
Pulp and paper
Other transport (aircraft and rail equipment)
S
EC
TO
R
Computers and office machines
node 7 (n=61)
Mean=-0.0968
<=215 employees
node 2 (n=176)
Mean= -0.0584
Germany node 8 (n=65)
Other American countries Mean=0.0328
Denmark 216 to 671 employees Belgium/Luxemburg
Switzerland
United Kingdom node 9 (n=50)
Mean=-0.1301
> 671 employees
S
IZE
node 3 (n=50)
Mean= 0.5253
Spain
France
Australia
Other countries of Occidental
Europe Argentina F A CT O
R 3 - T
ec hnol ogi ca l E ffort ba se d i n i m port ed c api ta l goods (n= 4 6 4 ) M ea n = -0, 0 0 2 7 N A TI O N A LI TY
Mean= 0.0472 Uruguay
Netherlands Japan
Sweden Source: PAEP/SEADE, 1996.
Therefore, in order to check what the predominant technological pattern in this group of affiliates, is the distribution of graduated employees in R&D activities was verified, as well as the investment in national and foreign capital goods by industrial sectors in this group of firms (of the above mentioned countries).
Table 3: Distribution of Staff in R&D, Investments in National and Foreign Capital Goods in Firms Controlled by Foreign Capital (1), by Industrial Sectors
Industrial Sectors % Staff in R&D
% Investment in National Capital
Good
% Investment in Imported Capital
Goods
Food products and beverage 2.9 19.5 56.5
Textiles 0.0 0.0 0.0
Clothing 0.0 0.0 0.0
Pulp and paper 0.6 9.7 9.8
Publishing, printing and recorded media 0.1 0.0 0.0
Chemicals and pharmaceuticals 19.1 10.9 6.0
Rubber and plastic products 5.1 6.3 4.1
Non-metallic mineral products 1.6 0.9 0.3
Basic metals 10.1 9.0 2.0
Metals products 0.8 0.4 0.6
Mechanical machinery 5.1 5.1 4.6
Computers and office machines 0.6 0.0 0.0
Electrical machinery 1.7 0.5 0.1
Electronics material and telecom 0.6 3.1 7.2
Instruments and automations equipment 2.9 1.1 0.3
Motor vehicles 48.8 33.4 7.9
Other transport (aircraft and rail equipment) 0.1 0.0 0.6 Others (tobacco/furniture/wood products etc.) 0.0 0.1 0.0
Total 100.0 100.0 100.0
Source: PAEP/SEADE.
(1) Only firms with 100 or more employees, whose controller foreign capital are from US, Italy, Mexico, Canada or other countries of Eastern Europe.
QUADROS et al., 2001) –, continue adopting technology transfer based on imports of equipment as the predominant technological strategy in Brazil.
C
ONCLUDINGR
EMARKSThe statistical results have shown a diversity of patterns of technological efforts (PTEs) among TNC subsidiaries in Brazil. Namely, we were able to identify three different strategies of technological input seeking for developing innovation capacity in these firms: licensing seeking (PTE 1), domestic assets – R&D in-house and local capital good suppliers seeking– (PTE 2) and imported capital goods seeking (PTE 3). Furthermore, the empirical findings have shown that each technological orientation has been affected by firm-size, sector and firm-nationality in different ways, with a clear predominance of firm size as the attribute with greater explanatory influence. For affiliates which are more engaged in PTE 1 and PTE 2 firm-size and, in turn, production scale matters, especially in the largest firms belonging to sectors like mechanical machinery, electronic material and telecom equipment (PTE 1), as well as aircraft and basic-metal (PTE 2). Conversely, for firms more oriented to adopt PTE 3, nationality of their foreign capital (that is, the corporation and firm strategy) was the most important determinant to explain significant variations in this technological behavior, rather than production scale. The main results of this study are summarized in Figure 4, below:
Figure 4: Synthesis Board of the Main Representative Groups of TNC Affiliates for Each PTE
PTEs Construction Main Determinant
Main Representative Industries/firm-size/nationality
PTE 1 (Technological Effort based on Disembodied Technology)
Positive correlation between national and imported royalty expenses
SIZE
Mechanical machinery/Electronics material and telecom/Publishing, printing and recorded media (260 employees or more)
PTE 2 (Technological Effort based on
Domestic/Internal Assets)
Positive correlation between national capital goods and R&D
SIZE
- Aircraft/Basic Metal (over 679 employees);
- Instruments and automation equipment/Computers and office
machines/Electronics material and telecom (100 employees or more);
- Motor Vehicles/Chemical and pharmaceutical/Basic Metals (100
employees or more; from US, Italy, Mexico or Canada)
PTE 3 (Technological Effort based on Imported Capital Goods)
Negative correlation between R&D and imported capital goods
NATIONALITY
Chemical and pharmaceutical (from Spain, France, Australia or Argentina)/ Food and beverage (from US, Italy, Mexico or Canada)
Source: PAEP/SEADE, 1996.
employees), it could be inferred that this strategy is more affected by sector and size rather than the nationality of foreign capital.
Moreover, the empirical results showed that the affiliate’s technological behaviour based on local assets (PTE 2) is extremely concentrated in the largest companies (with over 670 employees). Aircraft equipment and basic metals were the most representative industries in this group, suggesting that these sectors (specially the former) are largely dependent on scale to undertake and strengthen their technological capabilities.
Further more, disregarding the size influence, industries like instruments and automation equipment, computers and office machines, electronic material and telecom could also be included in the PTE2 group. Such industries are technology-intensive. Hence, their technological behaviour is more affected by other competitors and their velocity to introduce new products onto the market rather than by the scale advantages. To couch it in other terms, they demand fast renovation of products, productive efficiency and greater efforts in order to increase their innovation capacity and competitiveness in the global market.
Since particularly motor vehicles, chemicals, pharmaceuticals and basic metals showed the highest inverse correlation between imported technology and R&D activities, they were also included as representatives of PTE2, i.e., the group of firms which have undertaken technological strategies based on domestic assets. However, such behaviour can only be attributed to multinationals with foreign capital from the U.S., Italy, Mexico and Canada.
To sum up, the first important general conclusion was the high concentration of any kind of technological efforts in a few groups of industrial firms in the State of São Paulo and consequently, in the entrire Brazilian economy. Yet that condensed technological effort is a product of two major structural features of the Brazilian manufacturing industry, which are, the continuing growth and market concentration of large TNCs, which have increased their dominance and scale advantages in the most dynamic industrial sectors (LALL, 1996) and the weakness of national firms in undertaken technological activities (QUADROS et al., 2001).
Secondly, it is not a coincidence that the absolute size of the affiliates was selected as the main determinant explanatory attribute for R&D strategy. This relation was also suggested in more recent aggregate studies. For instance, analysing the technological behaviour in 85 foreign industrial firms operating in Brazil in 1998(11), MATESCO (2000) found that firm size (measured by sales turnover) had had strong influence on the quantity and quality of expenses with innovation and technological capacity. To put in detail, since larger firms have higher capacity for investment and accumulation, they are able to use internal assets (high skill personnel, R&D labs, marketing, etc.) and external networks for diversifying their product lines. As a consequence, the scale advantages strengthen entrance barriers for new competitors and market structure becomes more concentrated. Since internal R&D activities involve high costs and risks, larger firms are better able to finance this activity systematically.
A
CKNOWLEDGEMENTSThe authors are grateful to anonymous referees, who provided helpful suggestions to the analytical content of this paper. We also acknowledge Connie Galle for her valuable grammatical revision, as well as the entire PAEP/SEADE team for providing the main empirical material analysed in this study.
N
OTES1
As measured by the ratio of the number of graduate staff employed in R&D to the total employment of firms engaged in R&D activities.
2
Costa and Queiroz (2002), drawing on results from the same database, arrived to similar conclusions. 3
Fundação SEADE is the government agency for the production of statistics in the state of São Paulo. 4
The set of smaller firms controlled by foreign capital (5 to 99 employees) will not be analyzed in this study because the variable which represents internal Research and Development (R&D) activity – one of the information used to compose the indicator of technological effort in affiliates – is available only for enterprises with 100 or more employees. Since the small affiliates have accounted for only 7% of value-added within this group of firm-size, the reduction of the number of affiliates in the sub-sample could be done with a minimum loss in terms of economic weight.
5 Only in the middle of 2003 IBGE has started to release the results of PINTEC 2000, a database also constituted by information from na innovation survey.
6
In fact, comparing with earlier period of ‘Plano Real’, FDI inflows drop from US$ 1 billion per year between 1981-1994, to US$ 2 billion in 1994, US$ 9 billion in 1996 and US$ 26 billion in 1998 (considering US$ 6 billion from privatizations) (BACEN database, in: PINHEIRO; GIAMBIAGI; GOSTKORZEWICZ, 1999, p. 35).
7
The best weight in this case should be the total cost of the firm with technology acquisition, but such information was not provided by the PAEP.
8 The respective scores were extracted from the original database of affiliates. 9 It consists of the mean square between groups by the mean square within group. 10
Despite of multiple regression technique can reflect precise causality relations comparing to answer tree descriptive technique, the former is more complex the more categories “dummy” variables have in the model.
11
The sample of TNC affiliates comes from a research-panel conducted by SOBEET – Sociedade Brasileira de Estudos de Empresas Transnacionais e da Globalização Econômica.
R
EFERENCESAGGARWAL, A. Liberalization, multinational enterprises and export performance: evidence from Indian manufacturing, The Jornal of Development Studies, v. 38, n. 3, Feb. 2002, p.119-137.
AMSDEN, A.; TSCHANG, T.; GOTO, A. Do foreign companies conduct R&D in developing courtiers?: a new approach to analyzing the level of R&D, with an analysis of Singapore, ADB Institute Working Paper, cod. 14 March, 2001.
ARIFFIN, N.; BELL, M. Firms, politics and political Economy, In: YOMO, K. S., FELKER, G.; RASIAH, R. (eds.), Industrial Technology Development in Malaysia, London and New York. 1999.
BELL, M.; PAVITT . Technological accumulation and industrial growth: contrasts between developed and developing countries, Industrial and Corporate Change, v. 2, n. 2, p. 157-210, 1993.
CANTWELL, J. Innovation and information technology in MNE, In: The Oxford handbook of International Business, RUGMAN, T.; BREWER, Oxford University Press, 2001.
CANTWELL, J.; MUDAMBI, R. MNE competence-creating subsidiary mandates: an empirical investigation, University of Reading, UK, draft, 2001.
DUNNING, J.H. MNEs, Technology and Innovatory Capacity: A Host Country Perspective, In: Multinational Enterprises and the Global Economy, Wokingham, United Kingdom and Reading, Mass.: Addison Wesley, 1993.
ERBER, F.S. O padrão de desenvolvimento industrial e tecnológico e o futuro da indústria brasileira, IE/Universidade Federal do Rio de Janeiro, draft, 2000.
FIGUEIREDO, P. Does technological learning pay off? Inter-firms differences in technological capability-accumulation paths and operational performance improvement. Research Policy, n. 31, p. 73-94, 2002.
FRANCO, E. Novas práticas organizacionais, inovação e competitividade no mercado global: um estudo sobre uma empresa transnacional do setor de bens de consumo, 1998. Dissertação de Mestrado - UNICAMP, Campinas.
HAIR et al. Multivariate data analysis, fifth edition, Prentice Hall, New Jersey. 1998.
HAQUE I. et al. Trade, technology and international competitiveness, Economic Development Institute of the World Bank, Washington. 1995.
ISMAIL, M. N. Foreign firms and national technological upgrading: the eletronics industry in Malaysia”, In: JOMO K.S., GREG FELDER and RAJAH RASIAH (eds.), Industrial Technology Development in Malaysia, London and New York. 1999.
KIM Y., KIM L.; LEE J. Innovation strategy of local pharmaceutical firms in Korea: a multivariate analysis, Technology Analysis and Strategic Management, v.1, n.1, 1989, In: KIM L. (org.), Learning and Innovation in Economic Development, Great Britan, Bodmim, p. 93-108. 1999.
KUMAR, N. Technology generation and technology transfer in the world economy: recent trends and implications for developing countries, INTECH, Discussion Paper Series, September, n. 9702. 1997.
KUMAR, N. Determinants of location of overseas R&D activity of multinational enterprises: the case of US and Japanese corporations, Research Policy, 30, 159-174, 2001.
LALL, S. Transnational corporations and economic development, In: Transnational Corporations and World Development, UNCTAD, Division on Transnational Corporations and Investment, London, p. 44-72, 1996.
MOWERY, D. Technological Innovation in a Multipolar System: Analysis and Implications for US Policy, paper presented in Third International Conference in Innovation and Science Policy, Austin, Aug.-Sep. 1999.
OECD Oslo Manual – the measurement of scientific and technological activities, Eurostat, European Commission. 1997.
PINHEIRO, A. C.; GIAMBIAGI, F.; GOSTKORZEWICZ, J. O desempenho macroeconômico do Brasil nos anos, cap. 1, In: GIAMBIAGI, F.; MOREIRA, M. (orgs.), A economia brasileira nos anos 90, BNDES/DEPEC, Rio de Janeiro, 1999.
QUADROS, R. et al. Technological innovation in Brazilian industry: an assessment based on the São Paulo innovation survey, International Journal of Technological Forecasting and Social Change, n. 67, p. 203-219, New York, 2001.
REDDY, P. New Trends in globalization of corporate R&D and implications for innovation capability in host countries: a survey from India, World Development, v. 25, n. 11, p. 1821-1837, 1997.