DOI: http://dx.doi.org/10.1590/S1806-11173742036
Application of a computer sound card for measurement
of mechanical vibrations
(Aplica¸c˜ao de uma placa de som de computador para medi¸c˜ao de vibra¸c˜oes mecˆanicas)
Everaldo de Barros
1, Carlos d’Andrade Souto
1,
Leandro Ribeiro de Camargo
2, Mauro Hugo Mathias
31Departamento de Ciˆencia e Tecnologia Aeroespacial, Instituto de Aeron´autica e Espa¸co, S˜ao Jos´e dos Campos, SP, Brasil 2Petr´oleo Brasileiro S.A., Explora¸c˜ao e Produ¸c˜ao / Constru¸c˜ao e Manuten¸c˜ao de Po¸cos Mar´ıtimos, Santos, SP, Brazil
3Universidade Estadual Paulista “J´ulio de Mesquita Filho”, Guaratinguet´a, SP, Brasil Recebido em 4/7/2015; Aceito em 23/8/2015; Publicado em 12/12/2015
This paper presents a data acquisition and analysis system based on a computer sound card for measuring and processing random vibration signals. This system turns the computer into a two-channel measurement instrument which provides sample rate, simultaneous sampling, frequency range, filters and others essential capabilities required to perform random vibrations measurements. An easy-to-use software was developed for vibration monitoring and analysis, including facilities for data recording, digital signal processing and real time spectrum analyzer. Since the tasks of vibration data acquisition frequently require expensive hardware and soft-ware, this versatile system provides students a very accurate and inexpensive solution for experimental studying mechanical vibrations.
Keywords: data acquisition system, vibrations, computer sound card.
Este trabalho apresenta um sistema de aquisi¸c˜ao e an´alise de dados baseado em uma placa de som de com-putador para a medi¸c˜ao e processamento de sinais de vibra¸c˜ao. Este sistema transforma o computador em um instrumento de medi¸c˜ao de dois canais, disponibilizando taxa de amostragem, amostragem simultˆanea, faixa de freq¨uˆencia, filtros e outros recursos essenciais necess´arios para realizar medi¸c˜oes de vibra¸c˜oes aleat´orias. Um software com facilidades de utiliza¸c˜ao foi desenvolvido para o monitoramento e an´alise de vibra¸c˜oes, incluindo recursos para grava¸c˜ao de dados, processamento dos sinais e analisador de espectro em tempo real. Uma vez que as tarefas de aquisi¸c˜ao de dados de vibra¸c˜ao geralmente requerem hardware e software de custo elevado, este sistema vers´atil oferece aos estudantes uma solu¸c˜ao precisa e barata para o estudo experimental de vibra¸c˜oes mecˆanicas.
Palavras-chave: sistema de aquisi¸c˜ao de dados, vibra¸c˜oes, placa de som de computador.
1. Introduction
Mechanical vibrations can occur in many engineering designs and their characterization usually involves sev-eral concepts and equipment. The instrumentation sys-tems and techniques for vibration measurement are key factors to ensure the quality of the measured data and therefore there are many practical implications that must be taken into account as pointed out by Ref. [1]: the systems that perform measurement and analysis comprise a broad variety of prices, configurations and characteristics, making more difficult the choice of a specific measurement system. Both measurement and analysis are determined by many factors like avail-able budget; already present computer and
measure-ment systems; type, amount, frequency range, ampli-tude range and location of the measurements; person-nel skill and experience of the analysts; and current relation with hardware and software vendors.
In the context of undergraduate laboratory instruc-tions, experimental practices related to mechanical vi-brations have been performed in order to provide oppor-tunities to enhance the knowledge and technical skills of students. In the work presented in Ref. [2], the forced vibrations of rigid and flexible cantilever beams clamped in one end, are studied. An experiment use-ful to the study and analysis of the damages caused by an unbalanced machine in a given system when the machine presents a vibration frequency near the
char-1E-mail: [email protected].
4313-2 Barros et al.
acteristic resonance frequency of the system is reported in Ref. [3].
However, for undergraduate laboratory instructions, the cost for data acquisition systems can be prohibitive and for this purpose, the use of computer sound card as data acquisition device can be a very accurate and in-expensive solution for experiments. Usually, computer sound cards provide 2 input channels, 16 bit resolu-tion, and maximum sample rate of 44.1 kHz per channel with simultaneous sampling on both channels for gen-eral data acquisition. These data acquisition capabili-ties combined with other technical aspects summarized in Ref. [4] are adequate and very useful for vibration measurements and give an alternate way for undergrad-uate student laboratory purposes.
Data acquisition using computer sound card have been reported for a variety of experimental practices. For example, in Ref. [5] the authors studied the rapid changing electromagnetic phenomena in the undergrad-uate physics laboratory. They used computer sound card to measure electromagnetic phenomena like EMF and damped oscillations. In Ref. [6], computer sound card was used as data acquisition system in the un-dergraduate laboratory to record Doppler shifted sound from a moving source. In Ref. [7], computer sound card was used for data acquisition and analysis of Geiger– M¨uller tube pulses, an instructive piece of equipment in undergraduate physics laboratories. In Ref. [8], the ex-periment using computer sound card to acquire sound data, demonstrated both the Doppler effect and spec-tral broadening in the undergraduate physics labora-tory. In Ref. [9], the authors presented an experiment with the help of a personal computer that works at the same time as a function generator, an oscilloscope, a spectrum analyser and an analogical/digital converter. This paper presents a data acquisition and analysis tool based on the computer sound card for sampling random vibration signals at constant frequency. The software, developed in Laboratory Virtual Instrument Engineering Workbench (LabView) programming lan-guage, can provides a low cost solution for motivating students to validate theories related to mechanical vi-brations.
2.
Software description
Vibe Tools shown in Fig. 1 (with labels and buttons in Portuguese) is an easy-to-use tool developed for vi-bration monitoring and analysis which uses computer sound card for random vibration data acquisition. The hardware and software requirements involve a Personal Computer running Microsoft Windows®operating sys-tem with 15.6 MB of free space in the hard disk and 256 MB of Random Access Memory (RAM). The soft-ware is not commercially available since it was designed
and implemented according to local needs. Similarly, the code is not open-source since specific routines have been exclusively developed.
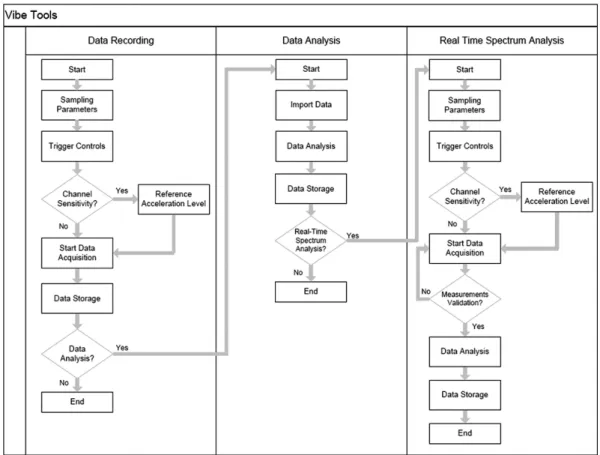
Figure 1 - The Vibe Tools groups.
Vibe Tools provides facilities for data recording, dig-ital signal processing and real time spectrum analyzer as illustrated in the workflow in Fig. 2.
2.1. Data Recording group
The measurement process is initiated by selecting the Data Recording group. This group shown in Fig. 3 allows the user to select the appropriate measurement parameters including number of channels; sampling fre-quency; time span of each capture frame; trigger char-acteristics (trigger level, slope direction and time delay) and transducer sensitivity.
The sensitivity value for each input channel is estab-lished using a vibration reference source (for example PCB Piezotronics model 394C06 handheld calibrator) and the accelerometer connected to the channel. When the reference acceleration level (expressed in grms) is typed and the reference signal generated by the cali-brator is well positioned within the full scale voltage range of the input channel, the program supervises the measurement and the current value for input channel sensitivity (expressed in mV/EU) is automatically re-turned, as illustrated in Fig. 4.
Figure 2 - Processes flow diagram.
Figure 3 - The Data Recording group.
Figure 4 - Channel sensitivity panel.
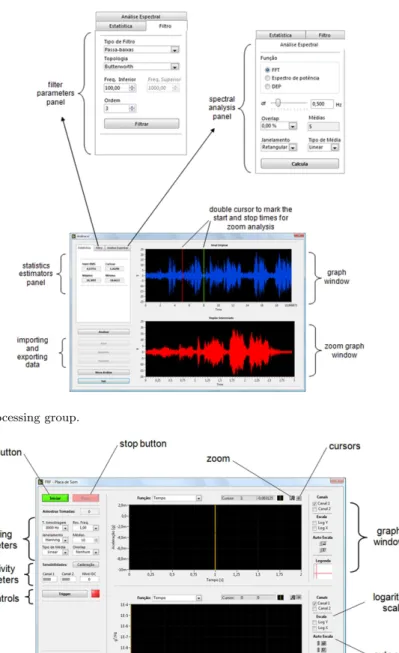
2.2. Data Analysis group
The post-processing repertoire shown in Fig. 5 provides the facilities for the recovery and analysis of ASCII or UFF data files. This group provides statistical estima-tors (rms value, kurtosis, minimum and maximum val-ues), filter options (Butterworth, Chebyshev and ellip-tic filter) and spectral analysis (fast Fourier transform
- FFT, power spectrum and power spectrum density) that may be applied to a signal for detailed analysis. Additionally, the zoom analysis facility applied to the time axis of a signal displayed in the graph window is also provided to isolate specific regions of interest in zoom graph window. The recorded signal analyzed may be restored in both ASCII or UFF format.
2.3. Real Time Spectrum Analyzer group
4313-4 Barros et al.
Figure 5 - The Digital Signal Processing group.
Figure 6 - The Real Time Spectrum Analyzer group.
3.
Application to response of cantilever
beam
To validate the developed tool for random vibration measurement and analysis, we present an example of a typical experiment shown in Fig. 7, used for charac-terization of the dynamic behavior of the beam. The purpose of this case study is to characterize the accel-eration transmissibility function of the system. An alu-minum 2024-T3 flexible cantilever beam of dimensions 340 mm x 1 mm x 20 mm was horizontally clamped to a LDS V201 shaker that provides the transverse ran-dom base excitation of the beam. The Br¨uel and Kjaer 1049 signal generator with the LDS TPO25 power am-plifier provide power in the form of voltage and cur-rent to the shaker. Input acceleration was monitored
Figure 7 - General view of the experimental setup.
Following the validation process, the response of the
beam was also evaluated numerically. The excitation (a prescribed acceleration) was applied in a beam tip and the acceleration response calculated for the other tip. The numerical model used consists of 6 linear Euler-Bernoulli beam elements. The mass of the accelerom-eter placed on the beam’s tip (0.7 g) was taken into account. No damping was considered in the calculation of the frequency response. The two response curves (numerical and experimental) are displayed in Fig. 8 below. The reasonable agreement among the three re-sults can be noticed and the experimental rere-sults shown to be as expected. The largest discrepancy in the natu-ral frequencies obtained is lower than 5.8% and occurs for the fourth natural frequency of the beam. A more refined model using elements with higher order shape functions would certainly provide even better results but these tasks are beyond the scope of this work.
⌋
Figure 8 - Comparison between experimental results and finite element analysis.
⌈
4.
Conclusions
Excitation systems, transducers, measurements and analysis systems are needed for investigating the dy-namics of structures. In the context of measurements systems, data acquisition systems are available in a wide variety of prices and capabilities. However, for un-dergraduate laboratory instructions, the cost for such systems is an unfortunate aspect. This paper presented a versatile and low cost data acquisition and analysis system based on the computer sound card for measur-ing and processmeasur-ing random vibration signals, which can
4313-6 Barros et al.
References
[1] W. Heylen, S. Lammens and P. Sas, Modal Analysis Theory and Testing (Katholieke Universiteit Leuven, Leuven, 1998).
[2] C.E. Repetto, A. Roatta e R.J. Welti, Revista Brasileira de Ensino de F´ısica36, 1314 (2014).
[3] M.G. Souza, T.R. Cicogna e A.J. Chiquito, Revista Brasileira de Ensino de F´ısica29, 1314 (2007).
[4] I. Howard, Acoustics Australia23, 45 (1995).
[5] S.Z. Simic and M.S. Kovacevic, Computer Applications in Engineering Education21, 158 (2010).
[6] T.J. Bensky and S.E. Frey, American Journal of Physics69, 1231 (2001).
[7] A.A. Azooz, European Journal of Physics 30, 57 (2009).
[8] A.A. Azooz, American Journal of Physics 75, 184 (2007).
[9] W.C. Magno, A.E.P. de Araujo, M.A. Lucena e E. Montarroyos, Revista Brasileira de Ensino de F´ısica