A STUDY ON THE SAR DATA OBSERVATION TIME FOR THE CLASSIFICATION OF
PLANTING CONDITION OF PADDY FIELDS
A. Kimura*, A. Kondo, K. Mochizuki
PASCO Research Institute, PASCO CORPORATION, 2-8-10 Higashiyama, Meguro-ku, Tokyo, 153-0043, Japan, [email protected]
Commission VIII, WG VIII/8
KEY WORDS: Paddy, TerraSAR-X, Classification, Observation time, Backscattering, Polarization
ABSTRACT:
In recent years, cultivation methods of rice have been diversified due to the low cost of rice-growing techniques. For example, there is direct sowing of seed rice in paddy field in addition to the practice of usual paddy field to flooding at the time of planting. The yield of the usual paddy field and the direct sowing is different even though the same varieties are grown in the same area. It is necessary to grasp by performing classification for the usual paddy field or direct sowing for the management of agricultural crops. The main objective of this study was to select the observation time for the classification of paddy fields’ planting conditions by utilizing Synthetic Aperture Radar TerraSAR-X satellite. The planting conditions included the usual planting of rice, the direct sowing of rice and the soybean. We selected the observation time by the statistical distance of the microwave backscattering in each paddy field for maximizing the planting condition classification. In addition, the satellite data observation timing considered the processing time of the analysis and the acquisition costs. The acquisition was performed 4 periods from 2 periods in the rice growing season and the planting phase. In the current study, we were able to classify the usual planting of rice, the direct sowing of rice and the soybean by TerraSAR-X data for the later planting of rice during mid-May and initial growth of rice in early June.
1. INTRODUCTION
The government in the agricultural sector needs to collect the information for food production planning or supply and demand. The Ministry of Agriculture, Forestry and Fisheries in Japan is conducting the research projects for the condition of rice cultivation in paddy fields corresponding to mid-August. The research on the paddy cultivation is manpower demanding, labor-intensive work and therefore it is necessary to develop the methodology for reducing the labor costs. In the recent years, the direct sowing technique for paddy rice has encouraged the production of low-cost rice cultivation. The direct sowing is widely growing cultivation practice in the paddy field without the flooding or the transplanting of the seedlings. Our purpose was for checking the paddy condition including the direct sowing of the production plan. Several studies have been conducted for checking the paddy field condition over wide areas utilizing spaceborne optical and Synthetic Aperture Radar (SAR) sensors (Okamoto and Fukuhara, 1996), (Kurosu et al., 1997), (Ribbes and Toan, 1999), (Ishitsuka, 2006), (Kimura and Shimamura, 2010) and (Kimura and Shimamura, 2015). Rice is mainly grown during the rainy season but the optical sensors cannot acquire clear imagery because of the cloud presence. On the other hand, the spaceborne SAR can perform observations regardless of weather conditions and highly suitable for deciding the observation period of the paddy fields. A number of researchers have been conducting the investigations for rice paddy extraction utilizing SAR information.
The observation time of paddy fields using SAR imagery is determined by the technical personnel of experience about the
scattering characteristics of the microwave scattering from the paddy field. For the practical usage, it is important to determine quantitatively about the observation time of paddy fields using SAR.
This study aimed to determine quantitatively the observation time of the paddy fields’ planting conditions using spaceborne SAR. The cultivation fields were the usual paddy fields, the direct sowing of paddy fields and soybeans fields. In addition, the satellite data observation time considered the processing time of the analysis and the acquisition costs and the data acquisition was performed 4 periods from 2 periods in the rice growing season and the planting phase.
2. BACKSCATTER OF MICROWAVE FROM THE PADDY AND SOYBEAN FIELDS
The time series variation of the growth of rice and soybean are shown in Figure 1. The growth of rice stem begins from mid-May after the transplantation of rice. On the other hand, the growth of soybean stem begins from late June. The irrigation timing of paddy field is different in the usual planting and the direct sowing (Figure 2). These differences in growth and irrigation time can be confirmed as a characteristic of the backscatter of microwave. The microwave backscatters decrease significantly for water-filled paddy fields. Furthermore, the backscatters increase during crop growth progresses.
In the current study, we also classified the usual planting, the direct sowing and the soybean utilizing the microwave backscatter characteristics of crops.
*Corresponding author
The International Archives of the Photogrammetry, Remote Sensing and Spatial Information Sciences, Volume XLI-B8, 2016 XXIII ISPRS Congress, 12–19 July 2016, Prague, Czech Republic
This contribution has been peer-reviewed.
3. STUDY SITE AND DATA UTILIZATION
3.1 Study site
The study site was located in the Osaki city of the Miyagi prefecture, Japan. The field observations were conducted for ninety-eight (98) paddy fields. The breakdown of the field observations were the usual planting for seventy-four (74), the direct sowing for seven (7) and the soybean seventeen (17).
3.2 Data utilization
The specification of the acquired TerraSAR-X (TSX) data is shown in Table 1. The acquisition dates were from early May to late July in 2009 in consideration of the research related to mid-August.
4. METHODOLOGY
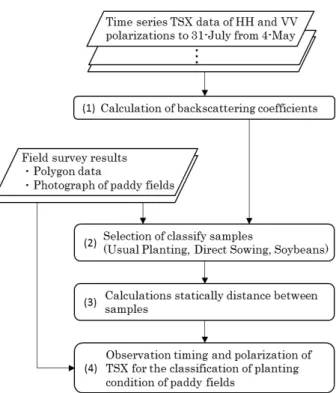
The study procedure is depicted in Figure 3.
(1) Calculation of backscattering coefficients
The backscattering coefficients of TSX data were calculated by using (1) formula (Airbus, 2014) as below:
The radar brightness β0 is derived from the image pixel values or digital numbers (DN) applying the calibration factor ks, where θloc is the local incidence angle.
A Geocoded Incidence Angle Mask (GIM) is available as an optional Enhanced Ellipsoid Corrected (EEC) TSX product. The value of σ0 dB is the backscattering coefficient.
(2) Selection of classification samples
A GIS polygon data was created to select and classify the samples. The polygon data was created based on the condition of paddy fields by conducting ground-truth work in 2009. The polygon data consisted of usual planting, the direct sowing and the soybean. We selected 2 fields or more for classifying samples according to the crop variety from the polygon data.
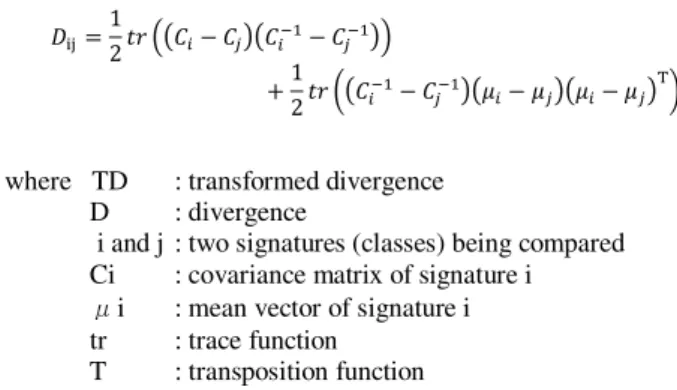
(3) Calculations of the statistical distance between samples Calculations for the statistical distance of the usual planting, the direct sowing and soybeans were conducted by the backscattering coefficients in the polygon data. And, the statistical distance of the sample fields (degree of classification) were calculated by the below described formula (2) using divergence of likelihood ratio (Swain and Davis, 1978).
�dB=� dB + × log sinθ���
� dB = × log �
� = ks �
� = − exp −8
Figure 1. Time series variation of the growth of rice paddy (a) and soybean (b)
Figure 2. Timing of irrigation of paddy field
Table 1. Imaging mode of TerraSAR-X and acquisition dates
Figure 3. Study procedure
(1)
(2) The International Archives of the Photogrammetry, Remote Sensing and Spatial Information Sciences, Volume XLI-B8, 2016
XXIII ISPRS Congress, 12–19 July 2016, Prague, Czech Republic
This contribution has been peer-reviewed.
where TD : transformed divergence D : divergence
i and j : two signatures (classes) being compared Ci : covariance matrix of signature i
μi : mean vector of signature i tr : trace function
T : transposition function
(4) Observation time and polarization of TSX for the classification of the paddy fields’ planting condition
The observation time and polarization of TSX were organized by the result of (3). The observation time considered the processing time of the analysis and the acquisition costs and it was performed 4 times from 2 periods in the rice growing season and the planting phase. In addition, comparisons were performed with the ground-truth observations for results’ validation.
5. RESULTS AND DISCUSSIONS
5.1 Relationship between the degree of classifications and field conditions
The degree of classifications and observation days and polarizations are shown in Figure 4. The bar chart is the degree of classifications between the 2 different fields. Y-axis is the degree of classifications and X-axis is polarizations and observation times.
The degree of classifications of the usual planting and the direct sowing were increased between mid-May to late May.
The degree of classifications of the usual planting and the soybean were increased during early June. The degree of classifications of the direct sowing and the soybean were increased between early June and mid-June.
Photos taken during mid-May of the study area are shown in Figure 5 for the field condition of the usual planting, direct sowing and soybean. The degree of classifications between the usual planting and the direct sowing considered the effects of the flooded condition of the usual planting and the soil condition of the direct sowing. These differences increased the degree of classification between the usual planting and the direct sowing. The degree of classification is decreased between the direct sowing and the soybean during mid-May (Figure 5) since the field conditions of the direct sowing and the soybeans were similar.
5.2 Selection of observation time
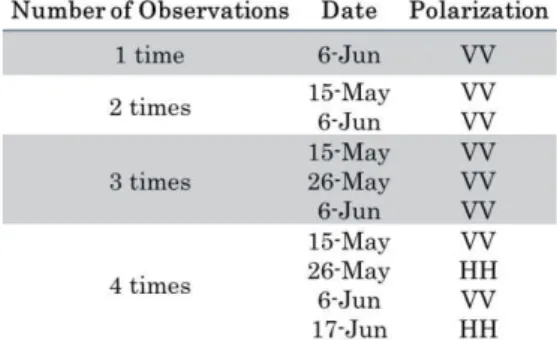
The comparison results of the classification accuracy by the observation time are shown in Figure 6. The bar chart is the degree of classification between the 2 fields and the line chart is the classification accuracy of the 3 fields. The Table 2 shows the observation time and polarizations corresponding to the number of observations. The VV polarization of TSX by the 3 times observation (mid-May, late May and early June) was found to be of higher than 90% of the accuracy.
The 4 times observations could not be confirmed for the difference of the classification accuracy of the 3 times observation. Additionally, the 2 times observation of the classification accuracy was less than the 1 time observation. Moreover, the 1 time observation had less value for the degree of classification between the usual planting and the direct sowing. We realized that the 1 time observation could not classify the usual planting and the direct sowing. But, the 2 times observation was able to classify the usual planting and the direct sowing comparing to the 1 time observation.
= �� − − − −
+ �� − − − � − � � − � T
Figure 4. Time series variation of the statistical distance between samples of the study fields
The International Archives of the Photogrammetry, Remote Sensing and Spatial Information Sciences, Volume XLI-B8, 2016 XXIII ISPRS Congress, 12–19 July 2016, Prague, Czech Republic
This contribution has been peer-reviewed.
Table 2. Selected dates and polarizations
6. CONCLUSIONS
This study aimed to determine quantitatively the observation time of the paddy fields planting conditions using spaceborne SAR. The usual paddy fields, the direct sowing of paddy fields and soybeans fields were the cultivation fields. In addition, the satellite data observation time considered the processing time of the analysis and the acquisition costs.
We were able to classify the usual planting of rice, the direct sowing of rice and the soybean utilizing the TSX. The VV polarization of TSX data by observing three times (mid-May, late May and early June) was found to be of higher than 90% of the accuracy. In the future, we will continue our study to identify the parameters other than the observation time and polarization.
ACKNOWLEDGEMENTS
The authors extend sincere thanks to the Furukawa Agricultural Experiment Station, Miyagi Prefecture, for supporting the field survey. The authors would like to thank Dr. Yoshizumi Yasuda and Dr. Krishna K. Mishra for their useful comments for this manuscript.
REFERENCES
A. Kimura and H. Shimamura, 2010. Estimation of Planting Condition of Paddy Fields utilizing TerraSAR-X Data,
International Archives of the Photogrammetry, Remote Sensing and Spatial Information Science,VOL XXXVIII,part8,pp. 568-571.
A. Kimura and H. Shimamura, 2015. Classification of Planting Condition of Paddy Fields Utilizing two Time-Series Acquisition of High-Resolution SAR Images, Journal of the Japan society of photogrammetry and remote sensing,VOL.54,
No.3,pp. 118-132.
Airbus Defence and Space, 2014. Radiometric Calibration of TerraSAR-X Data Beta Naught and Sigma Naught Coefficient Calculation, TSXX-ITD-TN-0049-radiometric_calculations 13.00, pp. 2-15.
F.Ribbes and T. Le Toan, 1999. Rice field mapping and monitoring with RADARSAT data, Intl. J. Remote Sens., 20(4), pp. 745-765.
K. Okamoto and M. Fukuhara, 1996. Estimation of paddy field area using the area ratio of categories in each mixel of Landsat TM, Intl. J. Remote Sens., 17(9), pp. 1735-1749.
N. Ishitsuka, 2006. Using synthetic Aperture Radar (SAR) to Measure the Area of Rice Cultivation, Bulletin of National Institute for Agro-Environmental Sciences,No.24,pp.95-151.
Swain, P. H., and S. M. Davis, 1978. Remote Sensing: The Quantitative Approach. New York: McGraw Hill Book Company.
Figure 5. Photos of mid-May ofUsual paddy (a), Direct sowing (b) and Soybean field (c)
Figure 6. Degree of classification and classification accuracy by selecting 1 to 4 observation times
The International Archives of the Photogrammetry, Remote Sensing and Spatial Information Sciences, Volume XLI-B8, 2016 XXIII ISPRS Congress, 12–19 July 2016, Prague, Czech Republic
This contribution has been peer-reviewed.