* Doutor em Marketing pela Lancaster University (UK), Reino Unido.
Instituição de vínculo: Pontifícia Universidade Católica de Minas Gerais (PUC Minas) - Programa de Pós-graduação em Administração (PPGA), Brasil.
E-mail: [email protected]
** Mestre em Administração pela Pontifícia Universidade Católica Minas (PUC Minas), Brasil.
Instituição de vínculo: Pontifícia Universidade Católica de Minas Gerais (PUC Minas) - Programa de Pós-graduação em Administração (PPGA), Brasil.
E-mail: [email protected]
*** Doutor em Administração pela Universidade de São Paulo (FEA/USP), Brasil.
Instituição de vínculo: Pontifícia Universidade Católica de Minas Gerais (PUC Minas) - Programa de Pós-graduação em Administração (PPGA), Brasil.
E-mail: [email protected]
C
onfrontingt
heories off
irmg
rowth inL
ight ofD
egrees-
of-f
reeDomA
nALysisC
onfrontAnDot
eoriAs DeC
resCimento DAf
irmA àL
uz DAA
náLise Deg
rAus DeL
iberDADeSérgio Fernando Loureiro Rezende* Ricardo Salera**
José Márcio de Castro***
Abstract
T
his article aims to confront four theories of irm growth – Optimum FirmSize, Stage Theory of Growth, The Theory of the Growth of the Firm and Dynamic Capabilities – with empirical data derived from a backward-looking longitudinal qualitative case of the growth trajectory of a Brazilian capital goods irm. To do so, we employed Degree of Freedom-Analysis for data analysis. This technique aims to test the empirical strengths of competing theories using statistical tests, in particular Chi-square test. Our results suggest that none of the four theories fully explained the growth of the irm we chose as empirical case. Nevertheless, Dynamic Capabilities was regarded as providing a more satisfactory explanatory power.
Keywords: Firm Growth. Degree of Freedom Analysis. Dynamics Capabilities.
Firm Trajectory.
Resumo
E
ste artigo objetiva confrontar quatro teorias de crescimento da irma – TamanhoÓtimo da Firma, Teoria de Estágio de Crescimento, Teoria de Crescimento da Firma e Capacidades Dinâmicas – com dados empíricos oriundos de um estudo longitudinal da trajetória de crescimento de uma empresa brasileira de bens de capital. Para tanto, nós utilizamos a Análise de Graus de Liberdade para análise de dados. Esta técnica tem como propósito testar a força empírica de teorias rivais utilizando dados estatísticos, especiicamente o Teste de Qui-quadrado. Os nossos resultados sugerem que nenhuma das quatro teorias explica totalmente o crescimento da irma escolhida como caso empírico. No entanto, a teoria de Capacidades Dinâmicas foi vista como sendo a que possui o poder de explanação mais satisfatório.
Palavras-chave: Crescimento da irma. Análise de Graus de Liberdade.
Introduction
Quite often empirical studies of irm growth come up with some puzzling results. For example, Coad (2007) found that growth of proits had no inluence on the subsequent growth of employment or sales. Geroski, Lazarova, Urga and Walters (2003, p.55) revealed that irm size followed a random walk (LEVINTHAL, 1997). This means that “[…] irms move[d] more or less randomly, changing their relative size and rank on a regular if unpredictable basis […]”. In other words, differences in growth rates between irms were suggested to be transitory. Dosi, Lechevalier and Secchi (2010, p.1867) reminded us about the persistent heterogeneity “[…] in all dimensions of business irms’ characteristics and dynamics […]” whereas Serrasqueiro, Nunes, Leitão and Armada (2010) brought nonlinearities between determinants and irm growth to the fore. Yet, Henderson, Raynor and Ahmed (2012) found a degree of support for the notion of imprint on irm growth.
In our view, these results are puzzling because they are at odds with some well- known theories, models and hypotheses on irm growth (COAD, 2009), in particular those selected by Geroski (1998; 2000) for closer examination: Optimum Firm Size (OFS), Stage Theory of Growth (STG), The Theory of the Growth of the Firm (TGF) and Dynamic Capabilities (DC).
How can we reconcile the hypothesis on random walks (LEVINTHAL, 1997) with Penrose’s (1959) TGF? On the one hand, random walks assume that adjustment costs are ixed whereas TGF suggests they are variable (GEROSKI, 1998; 2000). By the same token, how can we accommodate the existence of nonlinearities between causal factors and irm growth to OFS which claims that a single determinant (price mechanism) sets the limits to irm growth (DEMSETZ, 1991)? This idea is also dificult to reconcile with STG theories such as Greiner’s (1972) model that suggest that irms grow in stages or phases. In addition, the concept of imprint has no place in OFS (CONNER, 1991) even though it is in accordance with DC (TEECE; PISANO; SHUEN, 1997).
More broadly, the mismatch between theory and data about irm growth has been spearheaded by Geroski and co-authors for a decade (GEROSKI, 1998; 2000; GEROSKI; MAZZUCATO, 2002; GEROSKI et al., 2003; GEROSKI; MATA; PORTUGAL, 2010). Speciically, Geroski (1998; 2000) carried out a quantitative panel study in order to confront the tenets of the aforementioned theories with empirical data. He found that none of these theories fully explained the growth of the sampled irms. In a similar vein, Geroski, Mata and Portugal (2010) were unable to claim absolute superiority of a particular theory over the others. Interestingly enough, whereas Geroski (1998; 2000) suggests that DC is a more promising theory for unpacking irm growth, Geroski, Mata and Portugal (2010) imply that a combination of theories is required so as to provide a iner-grained understanding of the growth of the irm.
Geroski’s (1998; 2000) contention is the starting point of this piece of research. It aims to confront the four theories of irm growth chosen by the American-born author with empirical data derived from a backward-looking qualitative case of the growth trajectory of a Brazilian capital goods irm. To do so, we built a matrix prediction that confronted the four theories of irm growth mentioned earlier. Subsequently we employed Degrees of Freedom Analysis (DFA) for data analysis. Based on Campbell (1975), this technique aims to test the empirical strengths of competing theories using statistical tests, in particular the Z-test and/or Chi-square test (WILSON; WOODSIDE, 1999).
Although our data comes from a quite different context and our indings are drawn from a distinct research method, they are strikingly similar to Geroski’s (1998, 2000). Accordingly, none of the four theories fully explained the growth of the irm we chose as empirical case. Nevertheless, DC was regarded as providing a more satisfactory explanatory power.
how our investigation was carried out, and place particular emphasis on DFA. Our results comprise an overview of the growth trajectory of the selected irm as well as DFA outcomes. The inal two sections contain the theoretical implications as well as contributions and limitations of our research.
Theoretical Background
Four theories of firm growth
OFS has its roots in mainstream economics (KUPFER; HASENCLEVER, 2002; SAUDERBRONN; SAUDERBROON; HASENCLEVER, 2011), which assumes that the irm operates within a perfectly competitive market (CYERT; MARCH, 1963), i.e., an economic institution (WILLIAMSON, 1985) represented by agents having complete information (CONNER, 1991) about inputs and prices (CYERT; MARCH, 1963) at zero costs (DEMSETZ, 1991). Under perfect competition, abnormal proits are washed away rapidly (DOSI; LECHEVALIER; SECCHI, 2010), which prevents the irm from sustaining a competitive advantage (ROSSETTI, 2003). Against this backdrop, irm growth is a “movement towards the optimum size”, as put nicely by Geroski (1998, p.2). Graphically represented by the lowest point of the irm’s cost curve (SLATER, 1980), the optimum size means that (all) irms maximize proits (RICHARDSON, 1972), stemming from the ideal mix of products and factors (CYERT; MARCH, 1963). As equilibrium is reached with optimum size, in the long run irms are likely to display the same size (GEROSKI et al., 2003).
Although STG is illustrated by a number of models (NECYK; FREZATTI, 2010; KLANN; KLANN; POSTAI; RIBEIRO, 2012), following Geroski (1998; 2000), we look closer at Greiner’s (1972, 1988) and Mueller’s (1972) models. Broadly speaking, both models suggest that the irm grows in stages or phases, this process being contingent on irm size and age (COSTA; BOENTE, 2012). Greiner’s (1972; 1998) model is grounded on the idea that the irm goes through periods of evolution and revolution which can be theoretically divided into ive interconnected phases: creativity, direction, delegation, coordination and collaboration. Mueller’s (1972) model suggests that each phase of growth is associated with innovation either in terms of products or processes. The earlier phases embrace the foundation of the irm and product or process renewals whereas the later phases involve agency conlicts and diversiication.
TGF is built upon two assumptions (GEROSKI, 1998): i) services rendered from resources fuel irm growth (PENROSE, 1959); ii) there are managerial limits to the irm growth rate (KOR; MAHONEY, 2000) - the so-called Penrose effect (SLATER, 1980). TGF suggests that the growth of the irm is largely determined by irm’s internal resources (PENROSE, 1956). Resources such as machines, managers and the like (KOR; MAHONEY, 2000) are indivisible or discrete (GEROSKI, 2000) therefore the irm is likely to have underutilized resources (FLECK, 2009) which can render services at near zero marginal cost (PITELIS, 2002; 2007). This provides an incentive for irm growth (PENROSE, 1959). Penrose (1956; 1959; 1971) places particular emphasis on the managerial limits to irm growth. As the administrative cadre is considered an inelastic resource (TAN; MAHONEY, 2007), the irm takes deliberate and costly actions to develop and maintain it internally (JACOBIDES; WINTER; KASSBERGER, 2012). This takes time notwithstanding, hindering irms from growing as smoothly (FOSS, 2002) or quickly as planned (SLATER, 1980).
2000) such as opportunity discovery (AUGIER; TEECE, 2009) and environmental adaptation and reshaping (TEECE, 2007; DRNEVICH; KRIAUCIUNAS, 2011; HELFAT; WINTER, 2011). Dosi, Lechevalier and Secchi (2010) put forward that dynamic capabilities are grounded on organizational knowledge whereas Arikan and McGahan (2010) state that they are embedded in activities and routines. Regardless, authors such as Amit and Schoemaker (1993) and Teece, Pisano and Shuen (1997) forcefully suggest that dynamic capabilities are developed over time, usually through experiential learning (FLEURY; FLEURY, 2004). This makes them hard to observe and dificult to imitate (DUTTA; NARASHIMAHAN; RAJIV, 2005; TEECE, 2007). It goes without saying that DC views the growth of the irm as the result of the development and maintenance of dynamic capabilities (GEROSKI, 2000).
The prediction matrix
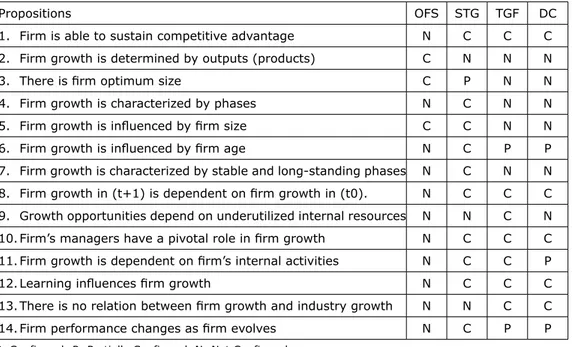
The four theories reviewed earlier are the bedrock of a prediction matrix comprised of similar, complementary and competitive propositions about irm growth (WILSON; WOODSIDE, 1999). We drew each proposition from a particular theory and then contrasted it with the other three theories in order to show whether it can be conirmed (C), partially conirmed (P), or not conirmed (N) in each of them (see Table 1).
The irst proposition states that the irm is able to sustain competitive advantage. This goes against OFS as this theory posits that sustained competitive advantages are dificult, even impossible (GEROSKI, 1998; 2000). Although STG does not deal with this explicitly, Klann et al. (2012) suggest a positive relation between irm life cycle and competitive advantage. If this holds, competitive advantage may be sustained in more successful stages or phases. This reasoning rests on the assumption that competitors are not able (BARNEY, 1991) and do not want (MADHOK; LI; PRIEM, 2010) to imitate the irm life cycle, in particular the successful stages or phases. However, if they want and succeed in mimicking it, the competitive advantage of the irm will, at best, be
Table 1 – Prediction matrix
Propositions OFS STG TGF DC
1. Firm is able to sustain competitive advantage N C C C
2. Firm growth is determined by outputs (products) C N N N
3. There is irm optimum size C P N N
4. Firm growth is characterized by phases N C N N
5. Firm growth is inluenced by irm size C C N N
6. Firm growth is inluenced by irm age N C P P
7. Firm growth is characterized by stable and long-standing phases N C N N
8. Firm growth in (t+1) is dependent on irm growth in (t0). N C C C
9. Growth opportunities depend on underutilized internal resources N N C N
10. Firm’s managers have a pivotal role in irm growth N C C C
11. Firm growth is dependent on irm’s internal activities N C C P
12. Learning inluences irm growth N C C C
13. There is no relation between irm growth and industry growth N N C C
14. Firm performance changes as irm evolves N C P P
temporary. This proposition is in line with TGF and CD, although TGF does not discuss inimitability (AUGIER; TEECE, 2009), which is germane to the competitive advantage debate (POSEN; LEE; YI, 2013).
The second proposition points out that irm growth is determined by outputs (products). Whereas this proposition is one of OFS’s tenets (CYER; MARCH, 1963), it is not line with STG, TGF and DC. STG associates growth with irm age and size (GREINER, 1972) and innovation (MUELLER, 1972). TGF explains irm growth by singling internal resources out (PENROSE, 1959) and DC replaces internal resources with dynamic capabilities (TEECE; PISANO; SHUEN, 1997).
The optimum size of the irm is the base of our third proposition. Needless to say, it is line with OFS. In relation to STG, we assume that this proposition can be partially conirmed to the extent that Mueller (1972) points to a limit to the growth of the irm. However, it has a place in neither TGF nor DC. For instance, Penrose (1959) starts her acclaimed book by saying that there is no limit to irm growth.
Our next four propositions are inspired by STG. The fourth proposition maintains that irm growth is characterized by phases. This goes against the tenets of OFS, TGF and DC. In OFS, “[…] growth is simply a matter of adjusting to the equilibrium size of the irm” (FOSS, 2002, p.154). As TGF views irm growth as an evolutionary process driven by the interplay of resources and services (KOR; MAHONEY, 2000), there is no room for pre-determined stages or phases. DC subscribes to the notion of path dependence (TEECE; PISANO; SHUEN, 1997; TEECE, 2007), which dismisses pre-determined stages or phases as well (ARAUJO; REZENDE, 2003).
The ifth proposition suggests that irm size inluences irm growth. This is in accordance with OFS inasmuch as it pioneers the idea of optimum irm size. This is also in line with STG. For instance, Greiner (1972, p.8) suggests that size is one of the dimensions for building what he calls “a model of organization development”. In contrast, proposition ive is supported in neither TGF nor DC.
Our next proposition states that irm growth is inluenced by irm age. OFS disregards age as it assumes that all irms are identical (CONNER, 1991). Together with size, age is one of the key dimensions of STG for explaining irm growth (GREINER, 1972). Although age is not explicitly discussed in TGF and DC, we suggest that this proposition can be partially conirmed in both theories. Whereas TGF assumes that irm growth is the result of a cumulative process of resource learning (FOSS, 2002), DC advances the idea that the development of dynamic capabilities is to a certain degree related to irm experience (MAKADOK, 2001).
Proposition seven asserts that irm growth is characterized by stable and long-standing growth phases. The same logic of reasoning developed in proposition four applies here. Apart from STG, this proposition is supported in none of the theories formerly outlined. For STG irm growth comprises stable and long-standing growth phases, each one ranging from four to eight years (GREINER, 1972).
The eighth proposition highlights irm history as it suggests that irm growth in t=1 is dependent on irm growth in t=0. Whereas history does not matter in OFS, it plays a pivotal role in STG, TGF and DC. In OFS the irm is considered a-historical (CONNER, 1991). In STG history comes to the forefront for explaining irm growth (GREINER, 1972). This also holds for TGF (BLOCH; FINCH, 2010) and DC (ZOLLO; WINTER, 2002).
Proposition nine indicates that growth opportunities depend on underutilized internal resources. This proposition can only be conirmed in TGF: it is one of its spokes (GEROSKI, 1998). In OFS it has no room as this theory views irm growth as regulated by the price mechanism (COASE, 1937), which means that market forces set the limits to irm growth (VASCONCELOS; CYRINO, 2000). It cannot be conirmed in STG or DC either. The focus of STG is on stages or phases, not on underutilized resources (MUELLER, 1972), whereas in DC dynamic capabilities “drive the low of resources” (LE MENS; HANNAN; POLOS, 2011, p. 96).
growth (MUELLER, 1972). The Penrose effect has to do with the limits to irm growth set by managerial resources (SLATER, 1980). DC also places emphasis on agency for explaining the development of dynamic capabilities and consequently irm growth (DI STEFANO; PETERAF; VERONA, 2010), especially in the earlier years of the irm (WINTER, 2012).
Proposition eleven states that the growth of the irm is endogenous, i.e., it is based on the irm’s internal activities. This proposition is at opposite ends of OFS (DEMSETZ, 1991). However, it can be conirmed both in STG and TGF. In relation to DC, we suggest that this proposition can be partially conirmed. On the one hand, dynamic capabilities are the result of internal processes (TEECE; PISANO; SHUEN, 1997) and, therefore, reside within the irm (MAHMOOD; ZHU; ZAJAC, 2011). On the other hand, they are shaped by the context in which the irm is embedded (EISENHARDT; MARTIN, 2000; TEECE, 2007).
The twelfth proposition states that learning affects irm growth. Whereas this proposition is not in line with OFS (GEROSKI, 2000) it can be conirmed in STG, TGF and DC. For example, in STG learning is the result of each stage or phase, and it can be used in subsequent phases or cycles (GREINER, 1972). Yet, in TGF learning has to do with resource using (PENROSE, 1959) and in DC with previous activities (TEECE; PISANO; SHUEN, 1997).
Proposition thirteen suggests that there is no relation between irm growth and industry growth. This proposition cannot be conirmed in both OFS and STG. For example, in STG industry is considered one of the cornerstones of organizational development (GREINER, 1972). However, it is in accordance with TGF and DC since both models accommodate the idea of idiosyncratic patterns of irm growth trajectories (DRNEVICH; KRIAUCIUNAS, 2011).
Finally, our last proposition states that irm performance changes as irm evolves. Although this is not directly discussed in OFS, it cannot be conirmed in it. In OFS market forces eliminate abnormal rents very rapidly (DOSI; LECHEVALIER; SECCHI, 2010), forcing irms to reach a similar level of performance (GEROSKI et al., 2003). STG has a different view to the extent that it suggests that irm performance is contingent upon the stage or phase which the irm goes through (MILLER; FRIESEN, 1984). In relation to both TGF and DC, we suggest that this proposition is partially conirmed. Both models argue that differences in performance across irms persist for a while (RUGMAN; VERBEKE, 2002) due to either heterogeneous resources (TGF) or dynamic capabilities (DC). This implies that irm performance has a stable component in order to maintain these differences (DOSI; LECHEVALIER; SECCHI, 2010). However, as Penrose states (1956), there is no reason to assume that this will continue indeinitely. If this holds, irm performance is likely to change, yet not as long as the irm evolves.
Methodology
We constructed a single case study to address our research aim (EASTON, 2000). Initially, we collected backward-looking qualitative data (BLUHM; HARMAN; LEE; MITCHELL, 2011) as we intended to trace the trajectory of the irm (GEORGE; BENNETT, 2005) - deined as a chain of causally connected events (BURGELMAN, 2011) - by highlighting events related to irm growth (FLECK, 2009). Subsequently, this data was analyzed in light of Degrees of Freedom Analysis (DFA).
Having gotten the consent of the irm, we started collecting data by gathering secondary data. In addition to oficial data about the capital goods industry obtained from the Brazilian Institute of Geography and Statistics (IBGE, 2011) and the National Bank for Economic and Social Development (BNDES, 2011), between November 2010 and February 2011 we collected data from EIP’s accounting registers, in particular inancial statements between 1977 and 2009. The 1989 inancial statement was missing because the accounting register had been eaten by moths. We were not able to ind the inancial statements between 1964 (foundation of the irm) and 1976 either. In this period, accountancy was outsourced, and the inancial management of the irm was based on cash low.
We also collected archival data such as a number of managerial reports, especially those aimed at detailing the plant production capacity to potential buyers as well as EIP investments over the years, all documents prepared for bids in which EIP participated over nearly ifty years, and an extensive amount of documents containing the description and technical details of all equipment manufactured by the irm. All this data was later coded and compiled resulting in nearly 600 pages of singled-space text.
In terms of primary data, we interviewed the founder and seven individuals such as the CEO, directors, upper-echelon managers and former managers. These interviews were carried out and tape-recorded between May and August 2011, each one lasting 163 minutes on average.
The interviews were supported by a protocol divided into three parts. In the irst part we aimed to get an overview of EIP growth trajectory since EIP inception. To do so, we asked the following questions: i) What are the roots of EIP?; ii) Tell me the history and the trajectory of EIP by pointing out the events you consider relevant; iii) What were the major transformations of the irm over the course of its history?
In the second part we furthered our understanding of the EIP growth trajectory by asking more speciic questions which were formulated based on ive indicators built from secondary data. The irst indicator, the evolution of the irm, is illustrated by the ratio of the turnover of the irm to the Brazilian Gross National Product (GNP) (T/G). According to Fleck (2004; 2009), this indicator embeds automatic adjustments in terms of inlation and delation that are considered relevant in studies of irm growth. The second indicator is turnover annual growth, calculated from the ratio of EIP turnover in t=1 to t=0. The third indicator is gross proit annual growth, based on the ratio of EIP gross proit in t=1 to t=0. The fourth indicator is GNP annual growth, based on the ratio of GNP in t=1 to t=0. The ifth and last indicator is similar to the fourth one to the extent that it refers to the GNP measured for the capital goods industry (GNP BK). We took into account the GNP implicit delator retrieved from the IBGE site in order to calculate all indicators except the irst. We also cared about currency changes over the years.
These indicators were plotted in graphs and used as the bedrock for the second part of the interview. We encouraged the interviewees to explain the curves according to their point of view by placing emphasis on their highest and lowest points. Finally, the last part of the interview was dedicated to asking questions directly related to the theoretical propositions of our research.
The inductive data analysis began by merging secondary and primary data texts, which, in turn, enabled us to triangulate data at three levels (JICK, 1979): secondary data itself, primary data itself and secondary data vis-à-vis primary data. As a number of divergences were found, we went back to the original documents as well as carried out another interview with the founder of the irm, which lasted 90 minutes.
strategies. In this sense, we wrote a irst draft of the case guided by the presence of any of these types of event. This version was sent to the founder of the irm for comments and criticisms. In general, he considered that the case mirrored the EIP growth trajectory.
We proceeded with data analysis by guaranteeing that the case contained enough empirical evidence to enable the judges to assess the theoretical propositions of the prediction matrix. Grounded on the literature review, we wrote a document in which we detailed such evidences, reaching an average of 2.6 instances of evidences per theoretical proposition.
At this point, we were ready to use DFA. According to Wilson and Woodside (1999), the heart of DFA is the development of a prediction matrix. As shown in the theoretical background, our matrix had 56 cells (14 propositions versus 4 theories) indicating whether each theoretical proposition could be conirmed (C), partially conirmed (P) or not be conirmed (N) in each theory.
We selected three judges familiar with the four theories (a CFO who holds a MBA and two senior lecturers in Management, both holding a PhD in Management) to whom in November 2011 we sent the case of the EIP growth trajectory, a brief description of each theoretical proposition and a blank table. They were asked to indicate whether each theoretical proposition could be conirmed, partially conirmed or not be conirmed in the case. We received the illed tables in December 2011.
Initially, we assessed the level of agreement across the judges. Following Wilson and Woodside (1999), four agreement levels could be reached by the judges: perfect – the three judges would agree (CCC), partially agree (PPP) or not agree (NNN); near perfect – two judges would agree (CCP), partially agree (CPP or NPP) or not agree (NNP); some – two judges would agree and one would not agree (CCN) or two judges would not agree and one would agree (CNN); and inally, none – the three judges would not agree (CPN). By chance it is expected that the distribution would be 11% perfect, 44% near perfect, 22% some and 22% none.
The agreement levels across the judges were 22% perfect, 64% near perfect, 7% some and 7% none. Based on the chi-square test (x2), these distributions are not
signiicantly different (x2=0.138, ns). This means that they display agreement levels
that are not different from those expected by chance (FONSECA; MARTINS, 1996). Having tested the agreement levels across the judges, the last step of data analysis using DFA was to contrast the prediction matrix with the matrix built from the assessments of the judges (WILSON; WOODSIDE, 1999). This means counting the number of hits, i.e., conirmed theoretical propositions. For a second time, we used the chi-square test. Our aim was to evaluate the 42 results (14 theoretical propositions versus 3 judges) so as to detect whether there was a “[…] signiicant difference between the observed distribution of hits (i.e., conirmed predictions) and the distribution one would expect by chance” (WILSON; WOODSIDE, 1999, p. 222). The results are detailed in next section.
Results
EIP growth trajectory: an overview
Going into detail, EIP dates back to 1964. It was founded in São Paulo by three individuals, one of them an engineer. In the very beginning, there were only three machines (a lathe, a drill press and a grinder motor) for manufacturing nuts, special screws and machined parts. One year later, one of the founders bought the shares from the other two and soon afterwards sold them to the current President of the board of EIP. At that time he was only twenty years old. His irst decision was to transfer EIP to Belo Horizonte, in the state of Minas Gerais, into an area of less than 90 square meters. In the following years, he invited his three brothers to become shareholders of the irm.
The irst worthy business opportunity was identiied three years later when EIP made an agreement with a multinational irm in the aluminum business for manufacturing hardware for aluminum spools. To a certain degree, this contract enabled EIP to buy, via loan, an 80-ton hot stamping screw press. In doing so, EIP increased the quality of special screws considerably which, in turn, attracted new buyers interested in higher quality products.
During the irst National Development Plan (PND), EIP began to supply series parts for earthmoving machines to another multinational irm. In 1974, EIP’s owners identiied a business opportunity to rebuild the aluminum multinational’s electrical furnace used for manufacturing ferroalloys. Later, EIP won a bid for producing 168 aluminum melting furnaces (electrolytic cells) for this same irm.
The second PND, implemented in 1975, provided incentives for constructing national roads and building electrical and nuclear power stations. In this context, EIP’s owners mapped out new business opportunities and, as a result, decided to acquire a 51,000 m2 area where they built a new plant for increasing the production capacity
of the irm.
A couple of years later, one of the largest Brazilian state-owned steel producers invited bids for enlarging a number of its plants. With the aim of increasing its chance to win some of the bids, EIP signed an agreement for producing plate processing equipment with the Brazilian subsidiary of a French multinational. This paid off to the extent that EIP won two bids for manufacturing continuous steel coil galvanizing lines. As a result, EIP’s turnover increased 21% in 1977 and 56% in 1978. As mentioned earlier, the best T/G in EIP’s growth trajectory is reached in 1979 (see Figure 1).
Source: Authors.
Figure 1 – Turnover/Brazilian GNP 0
0,0000002 0,0000004 0,0000006
1977 1979 1981 1983 1985 1987 1989 1991 1993 1995 1997 1999 2001 2003 2005 2007 2009 EIP’s Turnover / Brazilian GNP
The inancial resources resulted from these contracts were partly used for building a new plant which came into operation in 1977. From this time on, EIP would not only manufacture equipment, but also develop custom engineering projects.
In this same year, due to the particular interest of a shareholder, EIP diversiied its activities into a cattle farm and a eucalyptus plantation. In 1978, EIP furthered its diversiication by acquiring a project for building silicon and manganese alloys plant, which came into operation in 1980 (herein RSZ). Interestingly enough, T/G started declining in this year (see Figure 1).
In 1983, the RSZ’s second furnace came into operation enabling RSZ to increase production capacity as well as sales considerably. As RSZ overtook EIP in terms of turnover and proitability, it received more inancial and managerial resources. Unable to obtain new contracts, EIP went adrift and later became dependent on RSZ. This situation went on up to 1991 when EIP won three important contracts, thus interrupting the decline of T/G.
Meanwhile, the irm shareholders unexpectedly split due to a number of divergences. As a consequence, they decided that the irst shareholder would be in charge of EIP whereas the other three would run RSZ. Following the shareholder split, a new CEO for EIP was hired. In addition, the sons of the remaining shareholder began their professional careers at EIP.
At this point, it is interesting to highlight that the initial diversiications snowballed covering unrelated areas such as IT, iron exporting, hydraulic pump manufacturing, but they failed after a while.
In 1999, PETROBRAS, the Brazilian state-owned petroleum irm, invited EIP to make a bid for manufacturing equipment called Cyclone. The irm won the bid, and this hallmarked its entry into the petroleum industry. Three years later, EIP started operating in the petroleum reinement value chain by developing more value-added equipment. At this time, EIP decided to reorganize itself by creating three business units: Energy, Industry and Petroleum.
The initial equipment supplies to PETROBRAS, however, resulted in inancial loss. For example, EIP’s turnover jumped from R$ 8.2 million in 2000 to R$ 43.4 million in 2005 whereas its gross proit went down from 23% to 13% in the same period. In fact, manufacturing and delivery of this type of equipment required engineering, manufacturing and welding capabilities not totally mastered yet.
Despite this, EIP succeeded in developing them. Later, they became a springboard for manufacturing new products for the petroleum industry such as cooling towers. On top of that, it made and won a number of bids invited by either PETROBRAS or its suppliers. As a consequence, the petroleum unit became EIP’s most important business unit.
In the following two years, there were two critical events in the EIP growth trajectory. First, PETROBRAS paved the way for EIP to become a partner of an American irm for manufacturing submarine petroleum equipment. Second, together with a German Firm EIP founded a new irm called EIP Services by taking over the Brazilian subsidiary of the German irm’s plant.
This acquisition was controversial notwithstanding these circumstances. Some managers and directors considered managerial resources to be already scarce and insuficient to render enough services to run the acquired irm. To a certain degree they were right inasmuch as underpriced orders were taken and a number of deliveries were delayed. Yet, operational activities nearly collapsed.
Facing these issues, they came to the conclusion that management practices in EIP should be revised entirely. In addition, the sons of the shareholder gained control of the irm, each one being in charge of a particular functional area such as marketing, procurement and human resources. The CEO quit the irm.
395
o
&
s
- Salv
ador
, v
. 22 - n. 74, p
. 385-404 - Jul./Set. - 2015
www
.revistaoes.ufba.br
Confronting Theories of Firm Growth in Light of Degrees-of-Freedom Analysis
o 1964 • EIP foundation
o 1968 • Made an agreement with a multinational firm in the aluminum business. • Acquisition of an 80-ton hot stamping screw press.
o 1972-1974 • Started supplying series parts for earthmoving machines to another multinational firm. o 1974 • Rebuilt the aluminum multinational’s electrical furnace used for manufacturing ferroalloys.
• Produced 168 aluminum melting furnaces (electrolytic cells) for the aluminum multinational. o 1975 • Built a new plant for increasing the production capacity.
o 1977 • Made an agreement for producing plate processing equipment. • Won bids for manufacturing continuous steel coil galvanizing lines. • Built a new plant.
• Started developing custom engineering projects. • Diversified into a cattle farm and a eucalyptus plantation.
o 1978 • Further diversification by acquiring a project for building silicon and manganese alloys plant. o 1980 • Silicon and manganese alloys plant came into operation (RSZ).
o 1983 • The RSZ’s second furnace came into operation. • RSZ overtook EIP in terms of turnover and profitability. o 1983-1991 • Became dependent on RSZ.
o 1991 • Won three important contracts. • The firm shareholders split.
• Diversification into IT, iron exporting and hydraulic pump manufacturing failed. o 1999 • Won a bid for manufacturing equipment called Cyclone.
• Entered the petroleum industry.
o 2002 • Started operating in the petroleum refinement value chain by developing more value-added equipment. • Created three business units: Energy, Industry and Petroleum.
• Developed engineering, manufacturing and welding capabilities.
o 2004 • Entered into a partnership with an American firm for manufacturing submarine petroleum equipment. Founded a new firm called EIP Services together with a German firm.
o 2008 • Took over EIP Services by acquiring the shares of the German firm.
1978
1964 1968 1972 1974 1975 1977 1980 1983
1999 1991
2002 2004
2008
mechanisms that were expected to help the irm face upcoming challenges. Figure 2 portrays EIP growth trajectory by highlighting its major events.
Degrees of freedom analysis
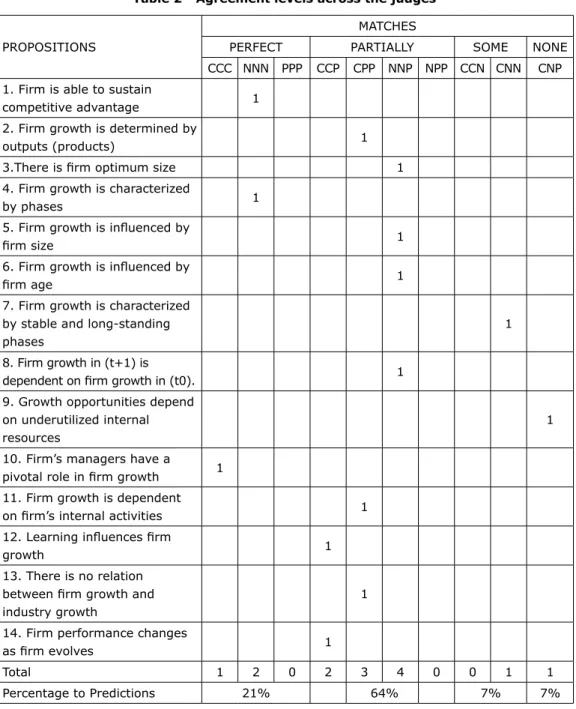
We started DFA by assessing the agreement levels across the judges. As detailed in Table 2, they were in perfect agreement for 21% of the evaluations, corresponding to three propositions. Near perfect agreement occurred for 64% of the evaluations, i.e., nine propositions. Some agreement and none agreement occurred for 7% of the evaluations each.
Table 2 - Agreement levels across the judges
PROPOSITIONS
MATCHES
PERFECT PARTIALLY SOME NONE
CCC NNN PPP CCP CPP NNP NPP CCN CNN CNP
1. Firm is able to sustain
competitive advantage 1
2. Firm growth is determined by
outputs (products) 1
3.There is irm optimum size 1
4. Firm growth is characterized
by phases 1
5. Firm growth is inluenced by
irm size 1
6. Firm growth is inluenced by
irm age 1
7. Firm growth is characterized by stable and long-standing phases
1
8. Firm growth in (t+1) is
dependent on irm growth in (t0). 1
9. Growth opportunities depend on underutilized internal
resources
1
10. Firm’s managers have a
pivotal role in irm growth 1
11. Firm growth is dependent
on irm’s internal activities 1
12. Learning inluences irm
growth 1
13. There is no relation between irm growth and industry growth
1
14. Firm performance changes
as irm evolves 1
Total 1 2 0 2 3 4 0 0 1 1
Percentage to Predictions 21% 64% 7% 7%
Speciically, the judges perfectly agreed that one proposition was conirmed in the case of EIP growth trajectory. Accordingly, EIP’s managers had a relevant role in the growth of the irm, thus supporting proposition ten. They also perfectly agreed that propositions one and four were not conirmed in this case. Whereas proposition one highlights the ability of the irm to sustain competitive advantage, proposition four states that irm growth is characterized by phases. Empirically, this means that EIP was neither able to maintain competitive advantages nor grew in stages or phases.
A near perfect agreement level occurred for nine propositions, representing three different situations. First, two judges disagreed and one partially agreed on four propositions. In their point of view, EIP did not reach an optimum size (proposition three), its growth was not inluenced by size (proposition ive), age (proposition six) and was not dependent on previous historical events (proposition eight). Second, one judge agreed and two partially disagreed on three propositions: propositions two, eleven and thirteen. In this sense, the evaluations of the judges slightly suggest that EIP growth was neither determined by outputs nor by internal resources. Yet, they related EIP growth with the capital goods industry growth. Third, two judges agreed and one disagreed on propositions twelve and thirteen. The twelfth proposition states that learning inluences irm growth whereas the thirteenth proposition suggests that irm performance changes as the irm evolves.
The two remaining propositions had some and zero agreement levels. Some agreement occurred for the proposition that states that irm growth is characterized by stable and long-standing phases. One judge agreed and two disagreed that this proposition was conirmed in the case of EIP growth trajectory. No agreement level occurred for proposition nine: growth opportunities depend on underutilized internal resources.
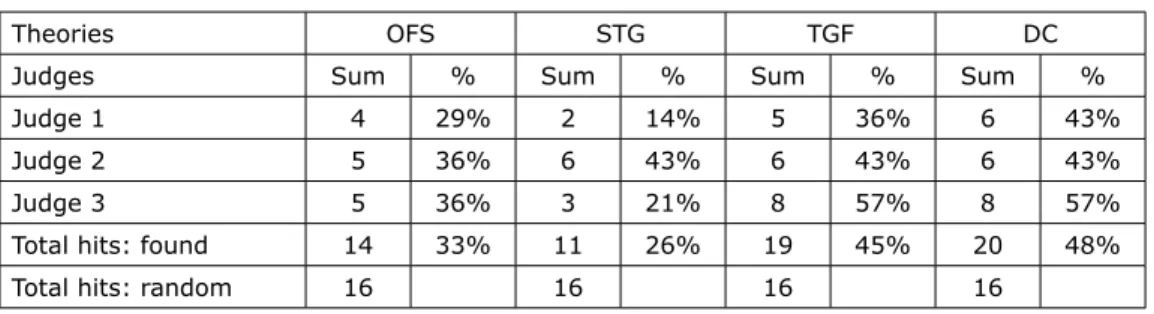
Altogether, these results demonstrate that OFS had 14 out of 42 hits, corresponding to 33%. STG had 11 out 42 hits, which is equivalent to 26%. TGF had a 45% hit rate, meaning 19 out of 42 hits. DC had the highest hit rate: 48% (20 out of 42 hits). That is, according to the judges none of the theories considered here (OFS, STG, TGF and DC) can fully explain EIP’s growth trajectory. Against this backdrop, it is suggested that DC is the theory with the highest explanatory power (48%) followed by TGF (45%). The explanatory power of OFS and STG is lower: 33% and 26% respectively. As shown in Table 3, this distribution is not signiicantly different from the one expected by chance (x2=0.337, ns).
Discussion and Implications
The results show that hit rates ranged from 26% to 48%. This means that none of the four theories considered here provided a crystal-clear explanation of the EIP growth trajectory. According to the judges, DC stood out nevertheless: it had the highest hit rate (48%). Provided we consider DC hit rate at face value we can make a
Table 3 – Results: four theories of irm growth
Theories OFS STG TGF DC
Judges Sum % Sum % Sum % Sum %
Judge 1 4 29% 2 14% 5 36% 6 43%
Judge 2 5 36% 6 43% 6 43% 6 43%
Judge 3 5 36% 3 21% 8 57% 8 57%
Total hits: found 14 33% 11 26% 19 45% 20 48%
Total hits: random 16 16 16 16
bold comparison with irm growth quantitative studies r2 (e.g. GEROSKI; MAZZUCATO,
2002), and conclude (again boldly) that the DC hit rate is not bad at all!
Interestingly, these indings are amazingly akin to those presented by Geroski (1988; 2000) even though they are embedded in a rather distinct context as well as being drawn from a diverse research method.
Together with our qualitative data, we offer two different, yet overlapping interpretations of these results. The irst interpretation is backed up by Coad’s (2010) claim that irm growth is a multidimensional phenomenon, which militates against an overarching theory of irm growth, as well as Geroski, Mata and Portugal’s (2010) assertion of the lack of superiority of a particular theory for accounting for the growth of Portuguese irms. This interpretation explains why none of the theories considered here fully explained the case of EIP’s growth trajectory. The second interpretation is supported by Geroski’s (1998; 2000) indings that indicate DC as the most promising theory of irm growth. This interpretation lends a degree of support to the fact that DC had the highest hit rate, although not much higher than TGF. In our view, the irst interpretation implies combining theories to further our understanding of irm growth whereas the second one requires strengthening the explanatory power of DC by relaxing some of its assumption.
According to the irst interpretation, a more satisfactory explanation of the EIP growth trajectory requires a bridge between theories of irm growth. Framed by our empirical results, we suggest a conversation between OFS and DC gravitating towards the trade-off between competitive markets (OFS) and idiosyncrasy of irm growth trajectory (DC). This conversation is encapsulated by the following proposition: irm growth is a rather idiosyncratic process that unfolds within competitive markets.
More speciically, the judges considered the relation between EIP growth and the capital goods industry growth. From a theoretical standpoint, this assessment goes against the idea of matchless growth trajectory espoused by DC, but it is in accordance with OFS. We wonder whether a particular irm’s dynamic capabilities can be conceptualized as exhibiting common features across other irms’ dynamic capabilities (EISENHARDT; MARTIN, 2000). If it can, we are able to advance the idea that the development and maintenance of dynamic capabilities is to an extent shaped by market forces. This reduces the degree of idiosyncrasy in terms of irm growth trajectories, but does not erase it. At the same time, it opens up the possibility of commonalities across growth trajectories brought about by market forces.
Two issues lie behind this proposition. First, a careful deinition and delimitation of competitive markets is needed so as to avoid conlating them with the concept of an industry as advocated by OFS. As Dosi, Lechevalier and Secchi (2010) remark, theories of irm growth need to rethink the locus of competition by considering the notion of submarkets populated by heterogeneous irms. In submarkets, market forces are not too effective as they are in perfect competition because they do not equalize irm size and irm growth trajectories. Notwithstanding, they do have the causal power to reduce idiosyncrasies. Under competition pressure in submarkets, irms with different sizes attempt to imitate one another. This leads us to the second issue, that is, some imitation is likely to occur across irms. However, it is neither near totally perfect as espoused by OFS nor near totally imperfect as conceived by DC. In submarkets, it lies in between like the notion of imperfect imitation recently discussed by Posen, Lee and Yi (2013). If irms imitate one another although imperfectly, it is expected that at least some of their dynamic capabilities (or their effects) will be alike (EISENHARDT; MARTIN, 2000; DRNEVIC; KRIAUCIUNAS, 2011).
More speciically, the judges considered performance luctuations along the EIP growth trajectory, which is, in our view, partially conirmed in DC. As discussed earlier, DC subscribes the idea that irm performance has a stable component so as to sustain the irm competitive advantage. We wonder whether uneven and erratic performance can be accommodated by DC (GEROSKI, 1998). If it can, we open up the possibility of conceptualizing irm growth trajectory as stochastic. In this regard, irm growth trajectory and performance will be driven by boundedly rational individuals facing “[…] strategic choices that involve high levels of uncertainty, causal ambiguity, and chaotic complexity” (HENDERSON; RAYNOR; AHMED, 2012, p. 389). This means that irm growth trajectory will be driven by choices made in a world populated by boundedly rational decision-makers (WILLIAMSON, 1985)1. In this world, the happenstance of
history (MEYER; BROOKS; GOES, 1990) plays a role which, in turn, brings randomness to the forefront (LEVINTHAL, 1997). Because random events usually fall off the decision-makers’ radar screen, they can only be fully grasped with the beneit of hindsight (ARTHUR, 1989).
Differently put, irm growth will be a combination of expected and unexpected determinants, or, as Geroski (1998) names them, shocks. This is similar to say that irm growth will follow a random walk (LEVINTHAL, 1991). In this conception, the heterogeneity across irms, one of the tenets of DC (DI STEFANO; PETERAF; VERONA, 2010), remains untouchable.
Conclusion
By using DFA to analyze backward-looking qualitative data about the growth trajectory of a Brazilian capital goods irm, we found that none of the four theories of irm growth selected here – Optimum Firm Size, Stage Theory of Growth, The Theory of the Growth of the Firm and Dynamic Capabilities – provided a satisfactory explanation for the growth of the selected irm. In spite of this, DC was judged to offer the best account. Two theoretical implications are drawn from these results. The irst proposes a bridge between OFS and DC (JACOBIDES; WINTER; KASSEBERGER, 2012). In this regard, irm growth trajectory is still considered idiosyncratic, but embedded within competitive markets. The second implies relaxing some assumptions of DC, in particular the one related to nonlinearities in irm performance (GEROSKI, 1998; 2000).
On the face of it, our contributions to research on irm growth are as follows: i) we provided a detailed account of the growth trajectory of a particular irm from its inception using not only qualitative, but also quantitative data collected from multiple sources. Subsequently, we employed qualitative and quantitative data analysis techniques simultaneously (BYRNE; RAGIN, 2009), which is far from trivial. To our knowledge, DFA as a case data analysis technique had not been used in irm growth studies until now; ii) we built a prediction matrix composed of similar, complementary and competitive propositions about irm growth. In our view, it can be used as a starting point in future studies of irm growth; and iii) we suggested news avenues of exploration for theories of irm growth. It either combines theories such as OFS and DC or relaxes some assumptions of DC without compromising its building blocks.
Nevertheless, these claims should be treated with cautions. Firstly, our indings are based on a single case study which prevents us from making statistical generalization (YIN, 2005). Closely related, they are bounded by a number of contextual factors such as industry and geography (POULIS; POULIS; PLAKOYIANNAKI, 2013). Secondly, the account of EIP’s growth trajectory was guided by three categories of critical events. In doing so, other types of event considered relevant in the studies of irm growth were disregarded (FLECK, 2009). Thirdly, we took into account four theories of irm growth, thus leaving theories such as Population Ecology (HANNAN; FREEMAN, 1984), Evolutionary Theory of the Firm (NELSON; WINTER, 1982), Resource-based View (BARNEY, 1991) and Institutional Theory (SCOTT, 2001) out. Fourthly, our
propositions covered sets of the four theories selected here therefore they cannot be taken as fully representing them. By the same token, the propositions did not provide a sharp limit between TGF and DC, which might have contributed to the tiny difference between their hit rates.
Acknolwedgements
We are grateful to the anonymous reviewers for their comments. The remaining errors are ours. Sérgio Rezende is grateful to The National Council for Scientiic and Technological Development (CNPq) and Fapemig Minas Gerais State Research Foundation (FAPEMIG) for inancial support.
References
AMIT, R.; SCHOEMAKER, P. Strategic assets and organizational rent. Strategic Management Journal, v. 14, n. 1, p. 33-46, 1993.
AUGIER, M; TEECE, D. Dynamic capabilities and the role of managers in business strategy and economic performance. Organization Science, v. 20, n. 2, p. 410-421, 2009.
ARAUJO, L.; REZENDE, S. Path dependence, MNCs and the internationalisation process: a relational approach. International Business Review, v. 12, n. 6, p. 719-737, 2003.
ARIKAN, A.; MCGAHAN, A. The development of capabilities in new irms. Strategic Management Journal, v. 31, p. 1-18, 2010.
ARTHUR, B. Competing technologies, increasing returns and lock-in by historical events. The Economic Journal, v. 99, p. 116-131, 1989.
BARNEY, J. Firm resources and sustained competitive advantage. Journal of Management, v.17, n.1, p. 99-120, 1991.
BANCO NACIONAL DE DESENVOLVIMENTO ECONÔMICO E SOCIAL. Portal
Institucional. Available from: <http://www.bndes.gov.br/SiteBNDES/bndes/bndes_ pt/index.html>. Acess 2011 Feb.
BLOCH, H.; FINCH, J. Firms and industries in evolutionary economics: lessons from Marshall, Young, Steindl and Penrose. Journal of Evolutionary Economics, v. 20, n. 1, p. 139-162, 2010.
BLUHM, Dustin J. et al. Qualitative research in management: a decade of progress. Journal of Management Studies, v. 48, n. 8, p. 1866-1891, 2011.
BURGELMAN, R. Bridging history and reductionism: a key role for longitudinal qualitative research. Journal of International Business Studies, v. 42, n. 5, p. 591-601, 2011.
BYRNE, D.; RAGIN, C. The Sage handbook of case-based methods. London: Sage, 2009.
CAMPBELL, T. Degrees of freedom and the case study. Comparative Political Studies, v. 8, n. 1, p. 178–193, 1975.
COAD, A. Testing the principle of ‘growth of the itter”: the relationship between proits and irm growth. Structural Change and Economic Dynamics, v. 18, n.3, p. 370-386, 2007.
COAD, A. Exploring the processes of irm growth: evidence form a vector
auto-regression. Industrial and Corporate Change, v. 19, n. 6, p. 1667-1703, 2010. COASE, R. H. The nature of the irm. Economica, v. 4, n. 16, p. 386-405, 1937. CONNER, K. A historical comparison of Resource-based Theory and ive schools of through within Industrial Organization Economics: do we have a new theory of theory? Journal of Management, v. 17, n. 1, p. 121-154, 1991.
COSTA, G.; BOENTE, D. Análise do peril da produção cientíica sobre ciclo de vida no período de 2000 a 2011. Ambiente Contábil, v. 4, n. 1, p. 106-119, 2012. CYERT, R.; MARCH, J. A behavioral theory of the irm. Englewood Cliffs: Prentice Hall, 1963.
DEMSETZ, H. The theory of the irm revisited. In: WILLIAMSON, O.; WINTER, S. (Ed.). The nature of the irm: origin, evolution and development. Oxford: Oxford University Press, 1991. p.159-178.
DI STEFANO, G.; PETERAF, M.; VERONA, G. Dynamic capabilities deconstructed: a bibliographic investigation into the origins, development, and future direction of the research domain. Industrial and Corporate Change, v. 19, n. 4, p. 1187-1204, 2010.
DOSI, G.; LECHEVALIER, S.; SECCHI, A. Introduction: Interirm heterogeneity – nature, sources and consequences of industrial dynamics. Industrial and Corporate Change, v. 19, n. 6, p. 1867-1890, 2010.
DRNEVICH, P.; KRIAUCIUNAS, A. Clarifying the conditions and limits of the contributions of ordinary and dynamics capabilities to relative irm performance. Strategic Management Journal, v. 32, p. 254-279, 2011.
DUTTA, S.; NARASHIMHAN, O.; RAJIV, S. Conceptualizing and measuring
capabilities: methodology and empirical application. Strategic Management Journal, v. 26, p. 177-287, 2005.
EASTON, G. Case research as a method for industrial networks: a realist apologia. In: ACKROYD, S.; FLEETWOOD, S. (Orgs.). Realist perspectives on management and organizations. London: Routledge, 2000. p. 178-194.
EISENHARDT, K.; MARTIN, J. Dynamic Capabilities: what are they? Strategic Management Journal, v. 21, n. 10-11, p. 1105-1121, 2000.
FLECK, D. Crescimento, dominância continuada e declínio da empresa: insights das histórias da General Electric e da Westinghouse. Revista de Administração Contemporânea, Edição Especial, p. 79-106, 2004.
FLECK. D. Archetypes of organizational success and failure. Brazilian Administrative Review, v. 6, n. 2, p. 78-100, 2009.
FLEURY, M.; FLEURY, A. Alinhando Estratégia e Competências. Revista de Administração de Empresas, v. 44, n. 1, p. 44-57, 2004.
FONSECA, J.; MARTINS, G. Curso de estatística. São Paulo: Atlas, 1996. FOSS, N. Edith Penrose: economics and strategic management. In: PITELIS, C. (Ed.). The growth of the irm: the legacy of Edith Penrose. Oxford: Oxford University Press, 2002. p. 147-164.
GEORGE, A.; BENNETT, A. Case studies and theory development in the social sciences. Cambridge (Mass.): MIT Press, 2005.
GEROSKI, P. The growth of irms in theory and in practice. In: FOSS, N.; MAHNKE, V. (Ed.). Competences, governance and entrepreneurship: advances in Strategy Research. Oxford: Oxford University Press, 2000. p. 168-185.
GEROSKI, P.; MAZZUCATO, M. Learning and the sources of corporate growth. Industrial and Corporate Change, v. 11, n.4, p. 623-644, 2002.
GEROSKI, Paul A. et al. Are differences in irm size transitory or permanent? Journal of Applied Econometrics, v. 18, n. 1, p. 47-59, 2003.
GEROSKI, P. A.; MATA, J.; PORTUGAL, P. Founding conditions and the survival of new irms. Strategic Management Journal, v. 31, p. 510-529, 2010.
GRAHAM, J.; HARVEY, C.; RAJGOPAL, S. The Economic Implications of Corporate Financial Reporting. Journal of Accounting and Economics, v. 40, n. 1–3, p. 3–73, 2005. GREINER, L. Evolution and revolution as organizations grow. Harvard Business Review, v. 50, n. 4, p. 37-46, 1972.
GREINER, L. Revolution is still inevitable. Harvard Business Review, v. 76, n. 3, p. 64-65, 1998.
Halinen, A.; Törnroos, J.; Elo, M. Network process analysis: an event-based approach to study business network dynamics. Industrial Marketing Management, v. 42, n. 8, p. 1213-1222, 2013.
HALINEN, A.; TORNROOS, J-A.; ELO, M. Network process analysis: an event-based approach to study business network dynamics. Industrial Marketing Management, 2013.
HANNAN, M.; FREEMAN, J. Structural inertia and organizational change. American Sociological Review, v. 49, p. 149-164, 1984.
HELFAT, C.; WINTER, S. Untangling dynamic and operational capabilities: strategy for the (n)ever-changing world. Strategic Management Journal, v. 32, p. 1243-1250, 2011.
HENDERSON, A.; RAYNOR, M.; AHMED, M. How long must a irm be great to rule out chance? Benchmarking sustained superior performance without being fooled by randomness. Strategic Management Journal, v. 33, n. 4, p. 387-406, 2012.
INSTITUTO BRASILEIRO DE GEOGRAFIA E ESTATÍSTICA. Portal Institucional. Available from: <http://www.ibge.gov.br/home/estatistica/pesquisas/pesquisa_ resultados.php?indicador=1&id_pesquisa=4>. Acess 2011 Feb.
JACOBIDES, M.; WINTER, S.; KASSBERGER, S. The dynamics of wealth, proit, and sustainable advantage. Strategic Management Journal, v. 33, p. 1384-1410, 2012. JICK, T. Mixing Qualitative and quantitative methods: triangulation in action. Administrative Science Quarterly, v. 24, n. 4, p. 602-611, 1979.
KLANN, R. C. et al. Relação entre o ciclo de vida organizacional e o planejamento em empresas metalúrgicas do município de Brusque-SC. Revista de Contabilidade e Organizações, v. 6, n. 16, p. 119-142, 2012.
KOR, Y; MAHONEY, J. Penrose’s resource-based approach: the process and product of research creativity. Journal of Management Studies, v. 37, n. 1, p. 109-137, 2000.
KUPFER, D.; HASENCLEVER, L. Economia Industrial: fundamentos teóricos e práticos no Brasil. Rio de Janeiro: Campus, 2002.
LE MENS, G.; HANNAN, M.; PÓLOS, L. Founding conditions, learning, and organizational life chances: age dependence revisited. Administrative Science Quarterly, v. 56, p. 95-126, 2011.
LEVINTHAL, D. Random walks and organizational mortality. Administrative Science Quarterly, v. 36, p.397-420, 1991.
______________. Adaptation on rugged landscapes. Management Science, v. 43, n. 7, p. 934-950, 1997.
MAHMOOD, I.; ZHU, H.; ZAJAC, E. Where can capabilities come from? Network ties and capabilities acquisition in business groups. Strategic Management Journal, v. 32, n. 8, p. 820-848, 2011.
MADHOK, A.; LI, S.; PRIEM, R. The resource-based view revisited: Comparative irm advantage, willingness-based isolating mechanisms and competitive heterogeneity. European Management Review, v. 7, n. 2, p. 91-100, 2010. MAKADOK, R. Toward a synthesis of the resource-based and dynamic-capability views of rent creation. Strategic Management Journal, v. 22, n. 5, p. 387-401, 2001.
MEYER, A.; BROOKS, G.; GOES, J. Environmental jolts and industry revolutions: organizational responses to discontinuous change. Strategic Management Journal, v. 11, p. 93-110, 1990.
MILLER, D.; FRIESEN, P. A longitudinal study of the corporate life cycle. Management Science, v. 30, n. 10, p. 1161-1183, 1984.
MUELLER, D. A life cycle theory of the irm. Journal of Industrial Economics, v. 20, n. 3, p. 199-219, 1972.
NECYK, G.; FREZATTI, F. A contabilidade gerencial: uma perspectiva de ciclo de vida de seu desenvolvimento nas organizações. Organização & Sociedade, v. 17, n. 55, p. 725-744, 2010.
NELSON, R.; WINTER, S. An evolutionary theory of economic change. Belknap Press: Cambridge, 1982.
PENROSE, E. Foreign investment and the growth of the irm. The Economic Journal, v. 66, n. 262, p. 220-235, 1956.
____________. The theory of the growth of the irm. 2. ed. Oxford: Oxford Basil Blackwell, 1980.
PENROSE, E. Problems associated with the growth of international irms. In: ____________. The growth of irms, Middle East Oil and other essays. London: Frank Cass and Company, 1971. p. 82-90.
PITELIS, C. On the garden of Edith: some themes. In: PITELIS, C (Ed.). The growth of the irm: the legacy of Edith Penrose. Oxford: Oxford University Press, 2002. p. 1-16.
________. PITELIS, C. A behavioral resource-based view of the irm: the synergy of Cyert and March (1963) and Penrose (1959). Organization Science, v. 18, n. 3, p. 478-490, 2007.
POSEN, H.; LEE, J.; YI, S. The power of imperfect imitation. Strategic Management Journal, v. 34, p. 149-164, 2013.
POULIS, K.; POULIS, E.; PLAKOYIANNAKI, E. The role of context in case study selection: an international business perspective. International Business Review, v. 22, 304-337, 2013.
ROSSETTI, J. Introdução à economia. São Paulo: Atlas, 2003.
RUGMAN, A.; VERBEKE, A. Edith Penrose’s contribution to the resource-based view of strategic management. Strategic Management Journal, v. 23, n. 8, p. 769-780, 2002.
SCOTT, R. Institutions and organizations. London: Sage Publications, 2001.
SERRASQUEIRO, Z.; NUNES, P.; LEITÃO, J.; ARMANDA, M. Are there non-linearities between SME growth and its determinants? A quantile approach. Industrial and Corporate Change, v 19, n. 4, p. 1071-1108, 2010.
SLATER, M. Foreword. In: PENROSE, E. The theory of the growth of the irm. Oxford: Oxford Basil Blackwell, 1980. p. vii-xxx.
TAN, D.; MAHONEY, J. The dynamics of Japanese irm growth in U.S. industries: the Penrose effect. Management International Review, v. 47, n. 2, p. 259-279, 2007. TEECE, D. Explicating dynamic capabilities: the nature and microfoundations of (sustainable) enterprise performance. Strategic Management Journal, v. 28, p. 1319-1350, 2007.
TEECE, D.; PISANO, G.; SHUEN, A. Dynamic capabilities and strategic management. Strategic Management Journal, v. 18, n. 7, p. 509-533, 1997.
VASCONCELOS, F.; CYRINO. Vantagem Competitiva. Revista de Administração de Empresas, v. 40, n. 4, p. 30-37, 2000.
WILLIAMSON, O. The economic institutions of capitalism. New York: The Free Press, 1985.
WILSON, E.; WOODSIDE, A. Degrees-of-freedom analysis of case data in business marketing research. Industrial Marketing Management, v. 28, n. 3, p. 215–229, 1999. WINTER, S. Capabilities: their origins and ancestry. Journal of Management Studies, v. 49, p. 1402-1406, 2012.
YIN, R. Estudo de caso: planejamento e métodos. Porto Alegre: Bookman, 2005. ZOLLO, M.; WINTER, S. Deliberate learning and the evolution of dynamic capabilities. Organization Science, v. 13, n. 3, p. 339-351, 2002.