Structural and dielectric spectroscopy studies of the M-type
barium strontium hexaferrite alloys (Ba
xSr
1–xFe
12O
19)
F. M. M. PereiraÆC. A. R. JuniorÆM. R. P. SantosÆ
R. S. T. M. SohnÆF. N. A. FreireÆ J. M. SasakiÆ
J. A. C. de PaivaÆA. S. B. Sombra
Received: 15 March 2007 / Accepted: 11 September 2007 / Published online: 2 October 2007 ÓSpringer Science+Business Media, LLC 2007
Abstract The M-type barium hexaferrite BaxSr1–xFe12O19
(where 0\x\1) alloys were prepared by a new ceramic procedure. The samples were studied using X-ray diffraction and Rietveld analysis, scanning electron microscopy (SEM), energy dispersive X-ray spectroscopy, infrared and Mo¨ss-bauer spectroscopy. The X-ray analysis indicates that the all the samples present a hexagonal structure. The IR spectra showed three main absorption bands in range of 400– 600 cm–1 corresponding to SFO100 and BFO100. The Mo¨ssbauer spectra showed a superposition of five subspec-tra associated with the five sites of the iron ion, which in the ferric state. The SEM studies showed that the hexaferrites presented grains that varied in the range of 260–305 nm. The dielectric properties: dielectric constant (e0) and dielectric
loss (tgd) were measured at room temperature in the
fre-quency range from 100 Hz to 40 MHz. The samples present a nonlinear behavior for the dielectric constant at 100 Hz, 1 kHz and 1 MHz. The dielectric constant is not following the linear mixing rule for the samples. The structural, dielectric and magnetic properties of the composite barium
hexaferrite phases were discussed in view of applications as a material for permanent magnets, high density magnetic recording and microwave devices.
1 Introduction
Hexaferrites are classified into four types depending on chemical and crystalline structure. These include hexa-ferrites types M, W, Y and Z, which correspond to (BaO + MeO):Fe2O3 ratios of 1:6, 3:8, 4:6 and 5:12
respectively [1].
The crystalline and magnetic structures of the different types of hexaferrites are remarkably complex, as shown for the most important M-hexaferrite BaFe12O19 in Fig.1. The elementary unit cell contains ten oxygen layers, sequentially constructed for four blocks: S (spinel), R (hexagonal), S* and R*. The S* and R* blocks have equivalent atomic arrangements, but rotated at 180° with respect to S and R blocks around the c-axis. An S or S* block consists of two O2– layers; while R or R* block contains three O2– layers, with one oxygen site in the middle layer substituted by an Ba2+ion [1].
Hexagonal ferrites of the M-type are still of enormous technical importance in the permanent magnet market because of their low price combined with reasonable mag-netic performances. For this reason, a little improvement of their magnetic or dielectric properties is of great relevance. The M-type ferrite (SrFe12O19) crystallizes in a hexagonal
structure with 64 ions per unit cell on 11 sites of different symmetry. 24 Fe3+atoms are distributed over five distinct sites: three octahedral sites (12k, 2a and 4f2), one tetrahe-dral site (4f1) and one bipyramidal site (2b). The magnetic structure given by the Gorter model is ferrimagnetic with F. M. M. PereiraC. A. R. JuniorF. N. A. Freire
Departamento de Quı´mica Orgaˆnica e Inorgaˆnica, Universidade Federal do Ceara´, CEP 60455-760 Fortaleza, Ceara´, Brasil
F. M. M. PereiraC. A. R. JuniorM. R. P. Santos
R. S. T. M. SohnF. N. A. FreireA. S. B. Sombra (&) Laborato´rio de Telecomunicac¸o˜es e Cieˆncia e Engenharia de Materiais (LOCEM), Caixa Postal 6030, CEP 60455-760 Fortaleza, Ceara´, Brasil
e-mail: [email protected] URL: http://www.locem.ufc.br
J. M. SasakiJ. A. C. de PaivaA. S. B. Sombra Departamento de Fı´sica, Universidade Federal do Ceara´, Fortaleza, Brasil
five different sublattices, three parallel (4f1 and 4f2) which are coupled by super exchange interactions through the O2– ions. A significant improvement of the intrinsic magnetic properties of M-type ferrites can be obtained by the partial substitution of Sr2+or Fe3+ions, or both [2,3].
The hexagonal ferrites, MFe12O19 (M = Ba, Sr, Pb),
with the magnetoplumbite structure continue to be impor-tant permanent magnet materials in microwave, small motor, and, more recently magnetic recording applications [4–7].
Mechanical alloying via ball-milling is a technique that is being recently adapted to the preparation of barium and strontium ferrites. This simple and economical procedure is useful for the production of powders composed of very small particles, usually smaller than*1 lm [8–10].
There are several studies concerning the synthesis and characterization of Ba(Sr)Fe12O19 ferrites prepared using
high-energy ball milling [8,9]. The present work studies a new ceramic procedure with emphasis in the structural, microstructure and electrical characterization of BaxSr1–x Fe12O19ferrites prepared by ceramic method. The
dielec-tric properties, dielecdielec-tric constant (e0) and dielectric loss
(tgd) were measured at room temperature in the frequency
region of 100 Hz–40 MHz.
The role played by the grain size of SFO100 (SrFe12O19) and BFO100 (BaFe12O19) in the dielectric constant and structural properties of the substrates are discussed. The dielectric properties of the composites are studied in view of the potential use of such materials for small high magneto-dielectric planar devices. These com-posites are also attractive for capacitor applications and certainly for microelectronics, microwave devices (cell mobile phones for example), where the miniaturization of the devices is crucial.
2 Experimental procedure
2.1 Synthesis of BaxSr1–xFe12O19 hexaferrites
The BaxSr1–xFe12O19 (0\x\1) hexaferrites were
pre-pared by the ceramic method. The starting materials used were BaCO3 (Aldrich, 99.9% purity), SrCO3 (Aldrich,
99.9% purity) and Fe2O3 (Aldrich, 99.9% purity). The
reagents were weighed according to their stoichiometric amount and mixed, worn out in planetary mill of high-energy, using 10 mm hardened steel balls a velocity of 370 rpm by 1 h. The samples were calcined at 1,000°C/ 24 h and sintered at 1.100°C/5 h.
Samples were named according with proportion of barium content in BaxSr1–xFe12O19: BaFe12O19 (BFO100),
Ba0.90Sr0.10Fe12O19(BFO90), Ba0.75Sr0.25Fe12O19(BFO75),
Ba0.60Sr0.40Fe12O19(BFO60), Ba0.45Sr0.55Fe12O19(BFO45),
Ba0.30Sr0.70Fe12O19(BFO30), Ba0.15Sr0.85Fe12O19(BFO15)
and SrFe12O19(SFO100) (see Table1).
2.2 Structural studies
2.2.1 Infrared spectra
The infrared spectra (FT-IR) were measured using circular pellets, made from a mixture of KBr (potassium bromate)
Fig. 1 Structure of barium hexaferrite
Table 1 Starting materials to obtain 20 g of each composite
Starting materials (g) Products
BaCO3 SrCO3 Fe2O3
3.550 – 17.241 BaFe12O19(BFO100)
3.210 0.266 17.318 Ba0.90Sr0.10Fe12O19(BFO90)
2.693 0.671 17.435 Ba0.75Sr0.25Fe12O19(BFO75)
2.169 1.081 17.555 Ba0.60Sr0.4Fe12O19(BFO60)
1.638 1.497 17.675 Ba0.45Sr0.55Fe12O19(BFO45)
1.099 1.919 17.798 Ba0.30Sr0.70Fe12O19(BFO30)
0.553 2.347 17.922 Ba0.15Sr0.85Fe12O19(BFO15)
and powder of each sample. This mixture was pressed with 8 ton for 5 min and all the pellets obtained present a thickness of 1.5 mm, approximately. The infrared spectra (FT-IR) were recorded in the 400–4,000/cm range with a Mattson 7000 (FTIR) spectrometer.
2.2.2 X-ray diffraction
The X-ray diffractograms were obtained with a Rigaku Dmax-B X-ray diffractometer, using a CuKa radiation
detector (k= 0.1542 nm) with a scintillation counter
operating at 40 kV and 25 mA. The ferrite powder was scanned through the 2hangle range of 20–80°and scanning rate of 1°/min.
The structural parameters were refined by the Rietveld method’s [11–13] in the software DBWS-9807a, using an X-ray powder diffraction data. The least-squares [14] procedures were adopted for minimization the difference between the observed and simulated powder diffraction pattern. The minimization was carried out by using the reliability index parametersRWP(weighted residual error)
and Durbin-Watson d-statistic DDW. The refinement
con-tinues till convergence is reached with the value of the quality factor Goodness of fit (SGoF) very close to 1 (varies
between 1.16 and 1.37), which confirms the good quality of the refinement.
2.2.3 Scanning Electron Microscopy
The microstructure observation and compositional analysis of the sintered surface pellets of the cylindrical specimens, covered with a thin layer carbon, was performed in scan-ning electron microscope Philips XL-30, equipped with an EDAX-CDU Leap Detector.
2.2.4 Mo¨ssbauer spectra
Mo¨ssbauer measurements were performed at room tem-perature by using standard transmission geometry and a constant-acceleration spectrometer with a radioactive source of 57Co within an Rh host. The analysis of the spectra was performed by the Normos fitting package. All the isomer shifts quoted in this paper are relative to metallic irona-Fe. The Mo¨ssbauer spectra were obtained
with Fast Comtec model MR-351.
2.2.5 Dielectric characterization
The dielectric measurements were obtained from a HP 4194A impedance analyzer in conjunction with a HP 4194
impedance analyzer, which jointly cover the region from 100 Hz to 40 MHz at room temperature.
The dielectric measurements were carried out on pol-ished samples with diameter of 12 and 1 mm of thickness. Screen printed silver electrodes were applied on both sides of the sample to ensure a good electrical contact.
3 Results and discussion
3.1 Infrared spectra
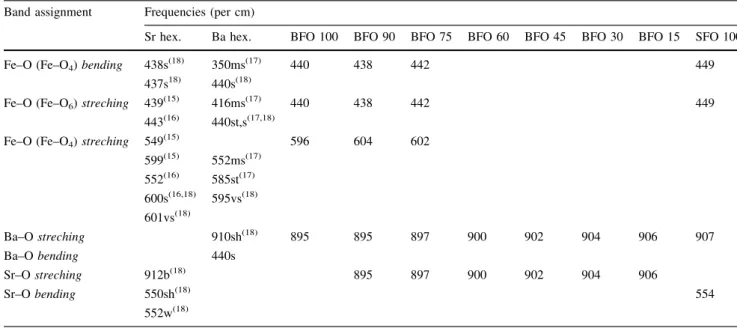
The IR spectra of BaxSr1–xFe12O19 hexaferrite composites
are presented in Fig.2. The values of wave number cor-responding to the IR absorption bands of BaxSr1–xFe12O19
and the data of the literature are given in detail in Table2. The spectra of the SFO100 and BFO100 samples are similar and showed absorption bands at 439.8, 549.6 and 599.8/cm [15–18]. Ram [17] attributed the absorption bands at 448, 560, 595/cm corresponding to BFO100 sample (see Table2).Huang et al. [19], produced barium
hexaferrite by combustion technique, at 850°C, and only bands associated to BFO100 could be observed.
Fig. 2 IR spectra of the BaxSr1–xFe12O19 hexaferrites, sintered at
In the IR spectrum of the SFO100, the absorption bands at 449/cm corresponding to the assignments Fe–O bending by Fe–O4 (tetrahedral) and Fe–O stretching by Fe–O6
(octahedral). The band at 554/cm the assignment Sr–O bending and 907/cm the Sr–O stretching, indicating the formation of the strontium ferrite (Table2).
In the IR spectrum of the BFO100, the absorption bands at 440/cm corresponding to the assignments Fe–O bending by Fe–O4and Fe–O stretching by Fe–O6. The band at 596/
cm to the Fe–O stretching by Fe–O4, and 895/cm to the
assignment Ba–O stretching, indicating the formation of barium ferrite (Table2).
The BFO samples (15, 30, 45 and 60) presented a very broad band of absorption that starts at 800/cm for the series Ba–Sr, which increases as the barium content decreases in each sample and disappeared completely in the SFO100 sample (see Fig.2).
In all samples the presence of SrCO3(670 and 430/cm)
and BaCO3(1,459/cm), was not detected, as observed by
Martinez Garcia et al. [15] and Huang et al. [19], indicat-ing that the adopted ceramic method (millindicat-ing, calcination and sintering) was efficient to consume completely the starting reagents.
3.2 X-ray diffraction
The X-ray diffraction patterns of the BaxSr1–xFe12O19
ferrite are shown in Fig.3. The diffraction peaks presented by BFO100 sample were identified by JCPDS file peaks number 84-0757 [20]. The X-ray diffraction corresponding to BFO100 sample showed that only one phase is present,
Table 2 Infrared characteristic frequencies of BaxSr1–xFe12O19hexagonal ferrites
Band assignment Frequencies (per cm)
Sr hex. Ba hex. BFO 100 BFO 90 BFO 75 BFO 60 BFO 45 BFO 30 BFO 15 SFO 100
Fe–O (Fe–O4)bending 438s(18) 350ms(17) 440 438 442 449
437s18) 440s(18)
Fe–O (Fe–O6)streching 439(15) 416ms(17) 440 438 442 449
443(16) 440st,s(17,18)
Fe–O (Fe–O4)streching 549(15) 596 604 602
599(15) 552ms(17)
552(16) 585st(17)
600s(16,18) 595vs(18)
601vs(18)
Ba–Ostreching 910sh(18) 895 895 897 900 902 904 906 907
Ba–Obending 440s
Sr–Ostreching 912b(18) 895 897 900 902 904 906
Sr–Obending 550sh(18) 554
552w(18)
vbvery broad,wweak,bbroad,vsvery sharp,ssharp,shshoulder,ststrong,msmedium strong
Fig. 3 X-ray diffraction patterns of BaxSr1–xFe12O19 hexaferrites,
however for the SFO100 sample, peaks were identified by the JCPDS file number 33-1340 [21] and also can be seen diffraction lines characteristic of thea-Fe2O3by the peak at
33.11°(2h), identified by JCPDS file number 72-0469 [22]
(see Table3).
Figure 3, shows that in all BFO intermediate samples (BFO15, BFO30, BFO45, BFO60, BFO75 and BFO90) the diffractions peaks associated to the main phase in these samples, and a small amount of a secondary phase (a
-Fe2O3) can be seen at 33.11°(2h). However others authors
[15, 16] utilizing other techniques observed a peak at 38.74°(2h).
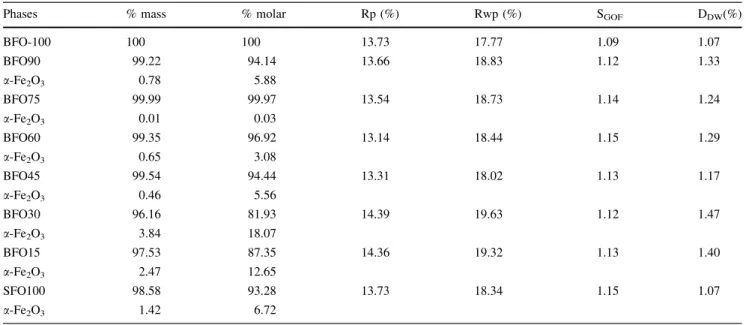
3.2.1 Rietveld analysis
The Rietveld refinement data’s of BaxSr1–xFe12O19samples
are shown in Fig.4 and the parameters obtained Rwp
(weighted residual error),DDW(Durbin-Watsond-statistic
dDW) andSGOF (quality factor Goodness), are presented in
Table3.
The SFO100 and BFO100 samples presented a hexag-onal structure belonging to a space group P63/mmc, with
two molecules in the unity cell (Z= 2). The peak at 33.11° (2h) observed in the SFO100 and BFO intermediate
sam-ples (15, 30, 45, 60, 75 and 90) were associated to the Fe2O3used in the synthesis of the ferrites composites.
From a purely mathematical point of view, RWP is the
most meaningful of theR’s because the numerator is the residual being minimized [13]. For the same reason, it is also the one that best reflects the progress of the refine-ment. Another useful numerical criterion isS-value or the ‘‘goodness fit’’. A value of S = 1.3 or less is usually
considered to be satisfactory. The value of theDDWshows
the serial correlation of the refinement, where an ideal value should be around of 2 [23–26]. As shown in the Table 3the results obtained forDDWwere not satisfactory.
However, RWP(17.77–19.63%) and S (1.09–1.15) values,
showed that the refinement associated the all the samples was effective.
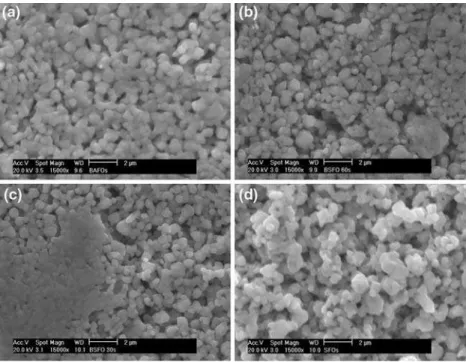
3.3 Scanning Electron Microscopy
In Fig.5, we have the Scanning Electron Microscopy (SEM) measurements. The samples present a heteroge-neously distribution of grain sizes. The grains appear to stick each other and agglomerate in different masses throughout the micrograph. Figure 5 also reveals that the grains tend to acquire sharp edges and some of them present hexagonal shapes.
Figure5 shows the SEM micrography of SFO100 and BFO (100, 60 and 30) samples, respectively. Results of grain size and chemical composition quantification for series BaxSr1–xFe12O19, are presented in Table4,5 From
the SEM micrography, was noticed that the BFO100 sample (Fig. 5a) presents grains in a more compact struc-ture and larger grain sizes than the grains of SFO100 (Fig.5d) in average, with 304.83 and 261.8 nm sizes respectively. This behavior shows that the sintering pro-cedure appears to lead to a higher compactation of this sample, as can be seen also, in the BFO60 and BFO30 samples (Fig.5b, c).
The EDX analysis performed on the samples showed that the amount of elements was approximately the same as the predicted by the theoretical amount (see Table 4). All
Table 3 Determination phase composition of BaxSr1–xFe12O19hexaferrites obtained from X-ray Rietveld analysis
Phases % mass % molar Rp (%) Rwp (%) SGOF DDW(%)
BFO-100 100 100 13.73 17.77 1.09 1.07
BFO90 99.22 94.14 13.66 18.83 1.12 1.33
a-Fe2O3 0.78 5.88
BFO75 99.99 99.97 13.54 18.73 1.14 1.24
a-Fe2O3 0.01 0.03
BFO60 99.35 96.92 13.14 18.44 1.15 1.29
a-Fe
2O3 0.65 3.08
BFO45 99.54 94.44 13.31 18.02 1.13 1.17
a-Fe2O3 0.46 5.56
BFO30 96.16 81.93 14.39 19.63 1.12 1.47
a-Fe2O3 3.84 18.07
BFO15 97.53 87.35 14.36 19.32 1.13 1.40
a-Fe2O3 2.47 12.65
SFO100 98.58 93.28 13.73 18.34 1.15 1.07
a-Fe
Fig. 4 X-ray Rietveld’s refinement of BaxSr1–xFe12O19hexaferrites. The differences between the observed and calculated intensities are shown
bypointsappearing at thebottom
Fig. 5 SEM micrographs for BaxSr1–xFe12O19hexaferrites
the peaks associated to elements of the ferrites like iron, barium, strontium and oxygen were observed.
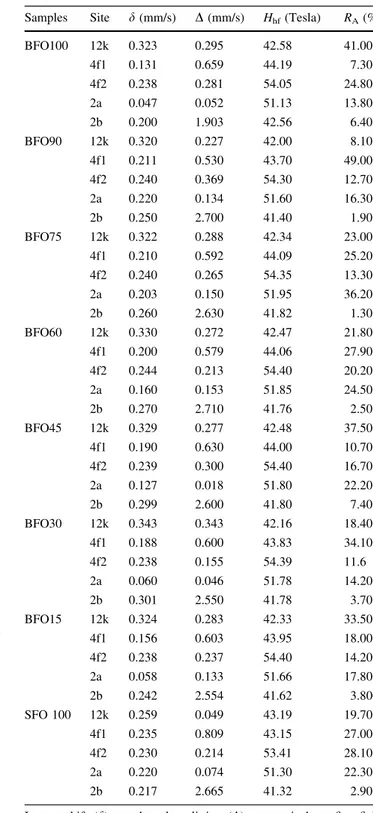
3.4 Mo¨ssbauer spectra
The hexagonal BaxSr1–xFe12O19 ferrite series has a
com-plex ferromagnetic structure consisting of five magnetic sublattices, as given in Tables5 and6. The Fe3+ions on every site contribute differently to magnetic properties. Mo¨ssbauer hyperfine parameters such as quadrupole split-ting (D), isomer shift (d) and magnetic hyperfine field (Hhf)
provide extremely useful microscopic information on the nature of various oxygen polyhedra in the structure.
Therefore, in order to probe into the changes that occur at the microscope level corresponding to the changes observed in the XRD pattern in the samples of the series, the Mo¨ssbauer spectra were recorded at room temperature.
Table 4 Grain size average and values for chemical composition for BaxSr1–xFe12O19hexaferrites obtained of SEM and EDXS
Samples Theoretical (% weight) Experimental (% weight) Grain size (nm) BFO100
Ba 12.35 14.04 304.83 ± 96.45
BFO90
Ba 11.17 13.35 314.63 ± 75.50
Sr 0.80 2.28
BFO75
Ba 9.37 11.02 333.50 ± 89.91
Sr 2.00 3.04
BFO60
Ba 7.55 7.95 329.00 ± 59.57
Sr 3.21 4.38
BFO45
Ba 5.70 7.05 403.00 ± 78.90
Sr 4.44 6.11
BFO30
Ba 3.82 4.39 252.75 ± 75.74
Sr 5.69 7.11
BFO15
Ba 1.92 3.79 301.00 ± 98.70
Sr 6.96 7.60
SFO100
Sr 8.25 10.20 261.80 ± 97.62
Table 5 Fe3+sites in BaFe
12O19
Site Coordination Occupancy Spin
12k Octahedral 12 Down
4f1 Tetrahedra 4 Up
2a Octahedral 2 Up
4f2 Octahedral 4 Down
2b Fivefold 2 Up
Table 6 Mo¨ssbauer parameters of the spectra measured at room temperature
Samples Site d(mm/s) D(mm/s) Hhf(Tesla) RA(%)
BFO100 12k 0.323 0.295 42.58 41.00
4f1 0.131 0.659 44.19 7.30
4f2 0.238 0.281 54.05 24.80
2a 0.047 0.052 51.13 13.80
2b 0.200 1.903 42.56 6.40
BFO90 12k 0.320 0.227 42.00 8.10
4f1 0.211 0.530 43.70 49.00
4f2 0.240 0.369 54.30 12.70
2a 0.220 0.134 51.60 16.30
2b 0.250 2.700 41.40 1.90
BFO75 12k 0.322 0.288 42.34 23.00
4f1 0.210 0.592 44.09 25.20
4f2 0.240 0.265 54.35 13.30
2a 0.203 0.150 51.95 36.20
2b 0.260 2.630 41.82 1.30
BFO60 12k 0.330 0.272 42.47 21.80
4f1 0.200 0.579 44.06 27.90
4f2 0.244 0.213 54.40 20.20
2a 0.160 0.153 51.85 24.50
2b 0.270 2.710 41.76 2.50
BFO45 12k 0.329 0.277 42.48 37.50
4f1 0.190 0.630 44.00 10.70
4f2 0.239 0.300 54.40 16.70
2a 0.127 0.018 51.80 22.20
2b 0.299 2.600 41.80 7.40
BFO30 12k 0.343 0.343 42.16 18.40
4f1 0.188 0.600 43.83 34.10
4f2 0.238 0.155 54.39 11.6
2a 0.060 0.046 51.78 14.20
2b 0.301 2.550 41.78 3.70
BFO15 12k 0.324 0.283 42.33 33.50
4f1 0.156 0.603 43.95 18.00
4f2 0.238 0.237 54.40 14.20
2a 0.058 0.133 51.66 17.80
2b 0.242 2.554 41.62 3.800
SFO 100 12k 0.259 0.049 43.19 19.70
4f1 0.235 0.809 43.15 27.00
4f2 0.230 0.214 53.41 28.10
2a 0.220 0.074 51.30 22.30
2b 0.217 2.665 41.32 2.90
The Mo¨ssbauer spectra of BaxSr1–xFe12O19 are shown in
Fig.6. In all the spectra, the Mo¨ssbauer contribution of the M-type phase is fitted with five components that corre-spond to the five different sites of the M-type crystal structure; these were fitted according to [27, 28]. The hyperfine parameters of BaxSr1–xFe12O19 are shown in
Table6. In the hexagonal structure of barium ferrite, Fe3+ ions occupy five sites: 4f1, 2a, 4f2, 12k and 2b. The
pro-cedure used to fix the starting parameters required for a univocal fitting of the spectra were the same used by [29]. The hyperfine field corresponding to the sextet with the largest field (54.0T), is comparable with that of the tetra-hedral site 4f2 in barium ferrite, which is located in the
spinel block of the unit cell. The sextet with the lowest hyperfine field (43.0T) is attributed to the octahedral 12k site even though the Hhf value is lower than that usually
observed for this site and is closer to that of the 2b site in barium ferrite. This is justified because the 2b site, which has a trigonal bipyramidal symmetry, is highly distorted and is expected to show extremely large quadrupole split-ting values (2.30 mm/s) and lower relative intensity (6%) than those observed for this sextet (0.30 mm/s and 17%, respectively). The large quadrupole splitting of the 2b sublattice makes the corresponding sextet clearly distin-guishable from the remaining sublattices contribute. The 12k site has the lower hyperfine field value and the 4f2the
largest. The hyperfine fields follow the sequence 4f2[2a[4f1[12k[2b, the quadrupole splitting,
fol-low the sequence 2b[ 4f1[12k[4f2[2a and the isomer shift 12k[4f2[2b[4f1[2a. After Sr2+ ions enter the lattice and substitute for some Ba2+ ions, the hyperfine parameters are almost invariable (Fig.6a–c).
As it can be seen in Table6, that the values of isomer shift are next to the found in literature for the samples SFO100 [3, 28, 30, 31], and BFO100 [28, 32, 33]. The isomer shift (d) for BFO100 follow the sequence
12k[4f2[4f1[2b[2a and for the sample SFO100 the sequence for d is 12k[4f1[4f2[2a[2b. While it is observed that the sequence for samples BFO (15, 30, 45 e 60) for d is 12k[2b[4f2[4f1[2a, and for samples BFO75 fordis 4f1[12k[4f2[2a[2b and BFO90 is
d12k[d 2b[d4f2[d 2a[d4f1.
According to Evans et al. [28] the spinel oxides present resulted for the hyperfine parameters isomer shifts (d) and
of the hyperfine fields (Hhf) for the octahedral and
tetra-hedral sites at 300 K in the following orderd(oct)[d(tet) andHhf (oct)[Hhf (tet). As for the M-type hexaferrites,
the 4f1tetrahedral sites and 2a octahedral sites are located
within the S block; the 2b and 4f2 octahedral sites are
located in the interface between the R and S block. Therefore, it is expected that thedFe3+(4f1)\dFe3+(2a). Because 4f1and 2a are entirely within the spinel block, as
well as also it is expected that theHhf(2a)[Hhf(4f1) and
that thedFe3+(12k)[dFe3+(4f1). As it is can be verified in Table6, sample BFO90 only follows the same sequence, that is, d (4f1= 0.211 mm/s)\d (2a = 0.058), d (12k = 0.320 mm/s)[d (4f1= 0.211 mm/s) e Hhf (2a = 51.60 T)[Hhf(4f1= 43.70 T). While the other samples present
d(4f1)[d(2a), but they remain withd(12k)[d(4f1) and Hhf (2a)[Hhf(4f1).
According to Evans et al. [28], there are no comparison data for eitherd?or Hhffor the trigonal bipyramidal Fe3+
2b site. However, there is a general correlation between coordination number and isomer shift, we might expect the isomer shit of Fe3+(2b) to occupy an intermediate position between those of Fe3+ (12k) and Fe3+ (4f1). But in this case, the general correlation between isomer shift and coordination number for Fe3+ oxides should be applied with caution as there no significant change in internuclear separation in going from the octahedral to the trigonal bipyramidal site in MFe12O19.
3.4.1 Hyperfine field (Hhf)
The variation ofHhfwithxis shown in Fig.6a. The values
ofHhfin almost all cases are constant, except whenxvaries
from 0.9 to 1.0.Hhfin this case, is seen to decreases with
substitution, andDHhf/Dxis negative for the 4f2followed
by 2a site, while it has positive value for 4f1,2b and 12k sites.
3.4.2 Isomer shift (d)
The study of isomer shift (d) gives information on valence
state and chemical bonding of the sample. The Fig.6b gives the variation of d with x. From this value we can
conclude that Fe exists only in the 3+ state. For Fe in the 2+ state, thed is typically in the range 0.9–1.5 mm/s [34]. A
sharp decrease in thedis observed whenxvaries from 1.0
to 0.3 in 12k site. In general theddecreases with increasing
the lattice constant. The d value is maximum for the
octahedral site (12k).
3.4.3 Quadrupole splitting(D)
The Fig.6c gives the variation ofDwithx. No significant differences in the dependence on xof the D values were observed, except when xvaries from 0.0 to 0.9 at the 2b site. For this site there is an increase of theDvalue, with the increase of the Sr ion presence in the sample. The value of D is 1.90 mm/s for BFO100 (x= 1) and increase to 2.7 mm/s for BFO90 (x= 0.9). With the increase in Sr presence, theDvalue is stable. One can conclude that the magnetic moments of the Fe3+ions remain axially aligned for values ofxfrom 1.0 to 0.1.
3.5 Dielectric function and loss studies
The values of dielectric constant (e0), dielectric loss tangent
(tgd) of BaxSr1–xFe12O19hexaferrites in the frequencies of
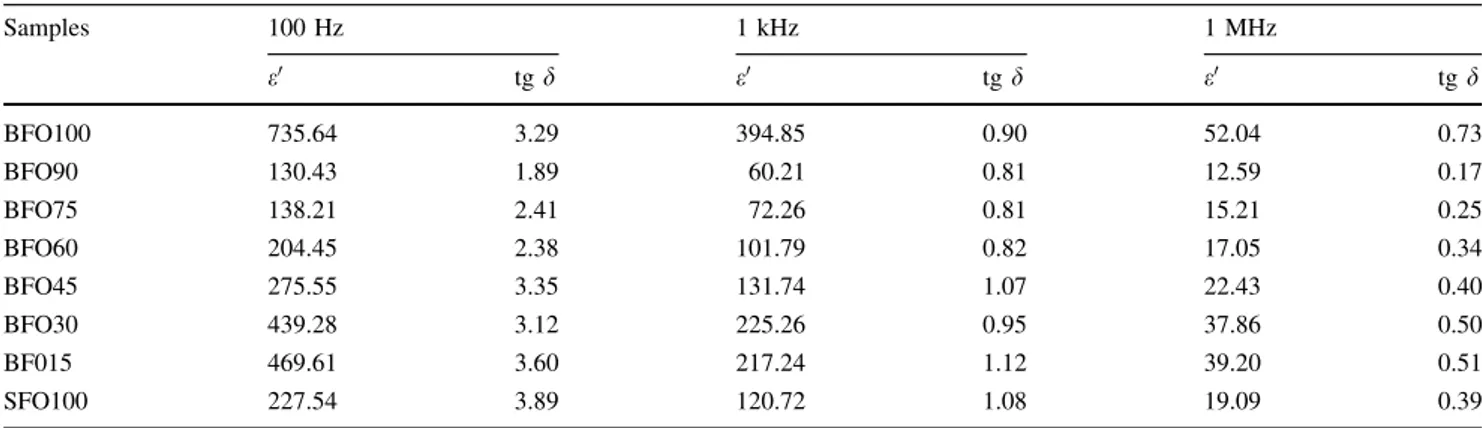
100 Hz, 1 kHz and 1 MHz are given in Table7(data from Fig.7a, b). The variation of dielectric constant and dielectric loss as a function of frequency are presented in Fig.7a, b.
As it can be seen in the Fig.7a the dielectric permit-tivity e0 of all the samples in the range of 100 Hz to
40 MHz was studied. For all the samples there is a decrease of the e0 value with frequency for this range of studied
frequencies. One can observe that for the BFO100 sample the dielectric constante0is higher compared to the SFO100
sample for frequencies below 10 MHz. However for the samples where the BFO and SFO form an alloy ceramic, the dielectric constant is also decreasing with frequency.
One can say that the BFO100 sample is presenting a higher value of e0 at 100 Hz (735.64) compared to the
effect, where the composite ceramic is not following the linear dielectric model with ae0 value around 130.43 (see
Fig.8). This is a strong suggestion that a nonlinear mixing effect between the two phases is taking place.
In Fig.7b one has the dielectric loss for these samples. At 1 MHz the loss is lower for the BFO90 sample (0.17) and higher for the BFO100 sample (0.73).
The classic treatment applied for two or more phases present in a dielectric are associated to the dielectric mixing rules that fix a limit to the dielectric constant that can be achieved with the mixed phase. The empirical logarithmic rule for the dielectric constant e0 and relative
volumes (VI) of the individual phases (I= 1 and 2 for BFO
and SFO) is given by:
loge0¼X
I
VIloge0
I ð1Þ
In Fig. 8one has the plot of the dielectric constant (e0) as a
function of the sample composition for the medium fre-quency (MF) region and for several frequencies, based in Eq. 1. The dotted lines are associated to the value of e0
Table 7 Dielectric constant (e0) and dielectric loss (tg d) of the bulks in BaxSr1–xFe12O19 hexaferrites sintered at 1.100°C/5 h at room
temperature
Samples 100 Hz 1 kHz 1 MHz
e0 tgd e0 tgd e0 tgd
BFO100 735.64 3.29 394.85 0.90 52.04 0.73
BFO90 130.43 1.89 60.21 0.81 12.59 0.17
BFO75 138.21 2.41 72.26 0.81 15.21 0.25
BFO60 204.45 2.38 101.79 0.82 17.05 0.34
BFO45 275.55 3.35 131.74 1.07 22.43 0.40
BFO30 439.28 3.12 225.26 0.95 37.86 0.50
BF015 469.61 3.60 217.24 1.12 39.20 0.51
SFO100 227.54 3.89 120.72 1.08 19.09 0.39
Fig. 7 Dielectric properties of the BaxSr1–xFe12O19 hexaferrites,
sintered at 1.100°C/5 h: (a) Dielectric constant (e0) and (b) dielectric loss (tgd)
obtained from Eq. 1, at 100 Hz, 1 kHz and 1 MHz. The experimental points (for the frequencies 100 Hz, 1 kHz, 1 MHz) of the samples are also indicated in the figure. One can easily conclude that the increase of the BFO phase in the BaxSr1–xFe12O19alloy is increasing thee0of the sample
at all the frequencies. Forx\40% the dielectric constant is above the expected result (based in Eq. 1). Forx[60% the dielectric constant is below the expected value. For x= 75% the experimental value of the dielectric constant is much lower (e0 = 138.21) when compared to the expected
value suggested by Eq. 1 (e0*600) at 100 Hz. This is an
unexpected behavior. It means that the alloy is not fol-lowing the linear regime of the model. This behavior is also present for 100 Hz and 1 kHz (see Fig.8).
This amazing behavior observed for the alloy sample, where one has higher and lower values of e0 values
compared to the pure states (see Fig.8), is probably associated with the sizes of the grains in both phases and to the interface between these grains. We are now looking the presence of this effect in the microwave region as well.
In summary, three different composite substrates of BaxSr1–xFe12O19 were studied in the MF range of the
spectra.
4 Conclusions
The M-type barium hexaferrite BaxSr1–xFe12O19 (where
0£x£1) alloys were prepared by a new ceramic proce-dure. The control of parameters like milling time, temperature of calcination and sintering, was used to obtain the desired alloys phases in the hexaferrite system BaxSr1–x Fe12O19.
The X-ray pattern for the prepared BaxSr1–xFe12O19
hexaferrites, indexes well on the hexagonal magneto-plumbite (M-type) structure of space group P63/mmc,
except for a very small amount of Fe2O3.
The IR spectra of the SFO100 and BFO100 samples and the alloys are in good agreement with data reported in the literature.
The X-ray diffraction corresponding to BFO100 sample showed that only one phase is present, however for the SFO100 sample, peaks were identified by JCPDS file number 33-1340 and also can be seen diffraction lines characteristic of the a-Fe2O3 by the peak at 33.11° (2h),
identified by JCPDS file number 72-0469.
The intermediate samples (BFO15, BFO30, BFO45, BFO60, BFO75 and BFO90) present diffractions peaks associated to the main phase in these samples, and a small amount of one a secondary phase (a-Fe2O3). According to
the Rietveld refinement analysis the SFO100 and BFO100 samples presented a hexagonal structure belonging to a
space group P63/mmc, with two molecules in the unity cell
(Z= 2).
The SEM measurements shows that the samples present a heterogeneously distribution of grain sizes. The grains appear to stick each other and agglomerate in different masses throughout the micrograph. The grains tend to acquire sharp edges and some of them gain hexagonal shapes. The BFO100 sample presented a more compact grain distribution and larger grains compared to SFO100 in average, with 304.83 and 261.8 nm respectively. The EDX analysis showed that the amount of elements was approx-imately the same as the predicted theoretical amount.
Mo¨ssbauer spectroscopy has been performed on BaxSr1–x Fe12O19(0 £x£1) hexaferrite, at room temperature. The
main hyperfine parameters for the 57Fe nuclei in the five iron sublattices have been determined. From the measuredd
value, we can conclude that Fe exists only in the 3+ state. We also observe that the d value is maximum for the
octahedral site (12k).
The value of D is 1.90 mm/s for BFO100 (x= 1) and increase to 2.7 mm/s for BFO90 (x= 0.9). With the increase in Sr presence, the D value is stable. One can conclude that the magnetic moments of the Fe3+ ions remain axially aligned for values of xfrom 0.0 to 0.9.
The values of dielectric constant (e0), dielectric loss (tg d) of BaxSr1–xFe12O19 hexaferrites in the frequency range
of 100 Hz to 40 MHz was studied. The value of dielectric of constant and dielectric loss tangent decreases with the increases of the frequency. At 1 MHz the loss is lower for the BFO90 sample (0.17) and higher for the BFO100 sample (0.73).
It was also observed that the alloys samples are not following the classic treatment applied for two or more phases present in a dielectric through the dielectric mixing rule.
For the alloys samples the obtained values are below or above the expected result in the dielectric constant at low frequencies.
This amazing behavior observed for the composite sample, where one has higher and lower values ofe0values
compared to the pure states (see Fig.8), is probably associated with the sizes of the grains in both phases and to the interface between these grains. We are now looking the presence of this effect in the microwave region as well.
Looking now for highe0and low loss film, which is the
best options for use in microwave devices like dielectric resonators, one has to find a balance between high dielectric constant and low loss. In a general view, the presence of the alloy structure of BaxSr1–xFe12O19 is
This strongly suggests that the composites BaxSr1–x Fe12O19are good candidates for applications where one is
looking for high e0 materials with low loss in
radio-fre-quency range.
Acnowledgements This work partly sponsored by CAPES, CNPq and FUNCAP (Brazilian agencies) and The U. S. Air Force Office of Scientific Research (AFOSR) (FA9550-06-1-0543).
References
1. S.R. Janasi, D. Rodrigues, F.J.G. Landgraf, M. Emura, IEEE Trans. Magn.36, 3327–3329 (2000)
2. L. Lechevallier, J.M. Le Breton, J. Magn. Magn. Mater.290–291, 1237–1239 (2005)
3. L. Lechevallier, J.M. Le Breton, J.F. Wang, I.R. Harris, J. Magn. Magn. Mater.269, 192–196 (2004)
4. A. Tucciarone, J. Magn. Magn. Mater.20(2), 111–133 (1980) 5. V. Enz, in Ferromagnetic Materials, vol. 3, ed. by W.P.
Wohlfarth (North-Holland, Amsterdam, 1982), p. 3–35 6. M. Naoe, S. Hasunuma, S. Yamanaka, IEEE Trans. Magn.
MAG-17, 3184 (1982)
7. V. Berbenni, A. Marini, Mat. Res. Bull.37, 221–234 (2002) 8. J. Ding, D. Maurice, W.F. Miao, P.G. McCormick, R. Street,
J. Magn. Magn. Mater.150, 417–420 (1995)
9. Z. Jin, W. Tang, J. Zhang, H. Lin, Y. Du, J. Magn. Magn. Mater. 182, 231–237 (1998)
10. G. Mendoza-Sua´rez, J.A. Matutes-Aquino, J.I. Escalante-Garcı´a, H. Mancha-Molinar, D. Rı´os-Jara, K.K. Johal, J. Magn. Magn. Mater.223, 55–62 (2001)
11. H.M. Rietveld, Acta Cryst.22, 151–152 (1967) 12. H.M. Rietveld, J. Appl. Cryst.2, 65–67 (1969)
13. R.A. Young, The Rietveld Method, (Oxford University Press/ IUCr, Oxford, 1996), p. 1–38
14. R.A. Young, A. Sakthivel, T.S. Moss, C.O. Paiva-Santos, J. Appl. Cryst.28, 366–367 (1995)
15. R. Martinez-Garcia, E. Reguera Ruiz, E. Estevez Rams, Mater. Lett.50, 183–187 (2001)
16. M. Sivakumar, A. Gedanken, W. Zhong, Y.W. Du, D. Bhat-tacharya, Y. Yeshurun, I. Felner, J. Magn. Magn. Mater. 286, 95–104 (2004)
17. S. Ram, Phys. Rev. B.51(10), 6280–6282 (1995)
18. H.A. Elkady, M.M. Abou-Sekkina, K. Nagorny, Hyperf. Inter. 128, 423–432 (2000)
19. J. Huang, H. Zhuang, W. Li, Mater. Res. Bull. 38, 149–159 (2003)
20. JOINT COMMITTEE ON POWDER DIFFRACTION STAN-DARD (JCPDS), International Center for Diffraction Data, (JCPDS 84-0757)
21. JOINT COMMITTEE ON POWDER DIFFRACTION STAN-DARD (JCPDS), International Center for Diffraction Data, (JCPDS 33-1340)
22. JOINT COMMITTEE ON POWDER DIFFRACTION STAN-DARD (JCPDS), International Center for Diffraction Data, (JCPDS 72-0469)
23. J. Durbin, G.S. Watson, Biometrika37, 409–428 (1950) 24. J. Durbin, G.S. Watson, Biometrika38, 159–178 (1951) 25. J. Durbin, G.S. Watson, Biometrika58, 1–19 (1971)
26. R.J. Hill, H.D. Flack, J. Appl. Crystallogr.20, 356–361 (1987) 27. V.K. Sankaranarayanan, D.C. Khan, J. Magn. Magn. Mater.153,
337–346 (1996)
28. B.J. Evans, F. Grandjean, A.P. Lilot, R.H. Vogel, A. Ge´rard, J. Magn. Magn. Mater.67, 123–129 (1987)
29. G. Albanese, J. Magn. Magn. Mater.147, 421–426 (1995) 30. H.A. Elkady, M.M. Abou-Sekkina, K. Nag, Hyperf. Interact.116,
149–157 (1998)
31. G.K. Thompson, B.J. Evans, J. Appl. Phys.73(10), 6295–6297 (1993)
32. T.M. Meaz, C. Bender Koch, Egypt. J. Sol. 26(2), 197–203 (2003)
33. S.J. Campbell, W.A. Kaczmarek, E. Wu, K.D. Jayasunya, IEEE Trans. Magn.30(2), 742–745 (1994)