INTRODUCTION
After the discovery of the Sr2FeMoO6 compound [1], the electromagnetic ceramics open a new ield of investigation about magnetoresistance effect under low-magnetic ield at room temperature. These oxide compounds, labeled as double perovskites, exhibit a large magnetic and electronic properties due to strong interplay between crystallographic structure, charge and spin ordering [2], which improve the use of this compound in magnetoeletronic devices [3].
The structure of the A2BB’O6 double perovskite, proposed by Longo and Ward [4] in 1961, is very similar to ABO3 simple perovskite. However, the double perovskite presents a solid ordered solution of the BO6 and B’O6 octahedral. The ideal structure is based on the adapted tolerance factor t of simple perovskite [5] taking into account the mixed A-site A2-xA’xBB’O6 [6], as can be seen in equation (A):
t = 1- A + A’ + g0
y g
x
2 x2
√2 gB+ + g0 2
gB’ 2
(A)
where gA, gA,gB and gB’ are the ionic radii of the respective ions and g0is the ionic radius of oxygen. According to the value of t, the double perovskite may take different structures: a hexagonal structure for t > 1.05, a cubic structure with Fm3m space group for 1.05 > t > 1.00, a I4/m tetragonal space group for 1.00 > t > 0.97 and P21/n monoclinic space group or orthorhombic for 0.97 > t [7].
As reported by Philipp et al. [8] and Popov et al. [9], there is a correlation between the A-site cation size and the magnetic moment saturation of the double perovskites. Other properties have been investigated as a function of doping A-site [10-12], in Sr2FeMoO6 the Curie temperature (TC)
Structural and magnetic investigation of Ca
2MnReO
6doped with Ce
(Investigação estrutural e magnética de Ca
2MnReO
6dopado com Ce)
J. B. Depianti1, M. T. D. Orlando1, A. S. Cavichini1, H. P. S. Corrêa2, V. A. Rodrigues1, J. L. Passamai1, E. L.
O Piedade1, H. Belich1, E. F. Medeiros1, F. C. L.de Melo3
1Universidade Federal do Espírito Santo, Av. Fernando Ferrari 514, Vitória, ES 29075- 910 2Universidade Federal de Mato Grosso do Sul, Campo Grande, MS
3Centro Técnico Aeroespacial - IEA, Pça. Marechal-do-ar Eduardo Gomes, 50, S. José dos Campos, SP 12228-904 Brazil
Abstract
We have studied the properties of Ce doping in Ca-site of Ca2MnReO6 double perovskite up to 10%. These compounds have presented a monoclinic cell with P21/n space group. A small increase of lattice parameters in doped sample were observed through Rietveld reinement of X-ray diffraction pattern. The spectra at the Mn K-edge and Re L3-edge showed a mixed valence for Mn and Re in both samples. We do not observed any variation on Mn K-edge valence in XANES measurements under pressure. However a change was observed for Re L3-edge as a function of applied pressure. The Ce-doped sample showed a magnetic geometric frustration and a small decrease of the temperature frustration as compared with Ca2MnReO6 sample. The decrease of temperature frustration can be related to the MnO6 and ReO6 octahedral distortion.
Keywords: Ce-doping, double perovskite, XANES, pressure.
Resumo
Neste trabalho estudamos as propriedades da dupla perovskita Ca2MnReO6 dopada com até 10% de Ce no sítio do Ca. Estes
compostos apresentaram uma célula monoclínica com grupo espacial P21/n. Através do reinamento do padrão de difração de raios X pelo método de Rietveld observamos um pequeno aumento nos parâmetros de rede para a amostra dopada. Os espectros de absorção de raios X na bordaK do Mn e L3 do Re mostram que o Mn e Re assumem valência mista em ambas as amostras. Nas
medidas de XANES sob pressão não observamos nenhuma variação na valência para a borda K do Mn. No entanto, foi observado um deslocamento da borda L3 do Re para alta energia em função da pressão aplicada. A amostra dopada com Ce apresentou
frustração magnética geométrica. Houve um pequeno decréscimo da temperatura de frustração da amostra dopada em comparação com a amostra Ca2MnReO6. A diminuição da temperatura frustração pode estar relacionada com a distorção octaédrica do MnO6
e do ReO6.
increases with a partial substitution of Sr for rare-earth (Ln) and, in the Sr2CrReO6 TC decreases with Nd+3 doping[13].
In this work we investigate the effects on Ca2MnReO6 crystal structure and magnetism as a function of partial substitution up to 10% of Ce4+ on Ca2+ site.
EXPERIMENTAL DETAILS
Synthesis procedure
Polycrystalline Ca2MnReO6 and Ca1.8Ce0.2MnReO6 samples were prepared by solid state reaction of CaO, CeO2 (Sigma Aldrich 99.995%), MnO2 (Alfa Aesar, Puratronic 99.9%) and ReO2 (Sigma Aldrich 99.7%) oxides. The CaO was obtained by decomposition of CaCO3 (Alfa Aesar, Puratronic 99.999%) heated at 980 ºC in O2 atmosphere for 24 h. Before synthesis procedure, the oxides were heated at 400 ºC for 24 h to remove any impurities and humidity. The powder were mixed and pressed in pellets, which were wrapped in gold foil (Alfa Aesar, Puratronic 99.999%) and sealed in a evacuated (10−2 torr) quartz tube. The sealed sample was placed in a tubular furnace and heated at a rate of 100 ºC/h up to 900 ºC, where it remained for 24 h, and then cooled at the same rate down to room temperature. Three intermediate steps of grinding were carried out. The second and third heat treatments were at 980 ºC for 48 h. Finally, for the fourth treatment, the pellets were placed in a crucible instead of wrapped in gold foil, and were heated up to 1300 ºC for 12 h always using the same rate of heating and cooling.
The oxygen stoichiometry was determined by mass variation and the residual oxygen pressure measured in the quartz tube at room temperature after each thermal treatment, and also considering the analytical balance accuracy (0.0001 g) and the pressure measurement setup accuracy (20 mmHg). The inal oxygen stoichiometry was 6.0± 0.1for Ca2MnReO6and 6.0±0.2 for Ca1.8Ce0.2MnReO6.
Sample characterization
The high-resolution X-ray powder diffraction measurement was performed at the XRD1 beamline of the Brazilian Synchrotron Light Laboratory (LNLS), using a wavelength λ = 1.20368 Å, at ambient pressure. A Ge(111) analyzer crystal was placed in a goniometer attached to the 2θ arm, and a scintillation detector was used. NIST standard reference material Al2O3 was measured in the same experimental conditions in order to obtain the instrumental parameters. The GSAS program [14] with the EXPGUI interface [15] was used for the Rietveld analysis and the structure reported by Corrêa et al. [16] was used as the input for the reinement.
The morphology of the particles and their chemical composition were determined using a scanning electron microscope (SEM) together with an X-ray energy dispersive spectrometer (EDS). The SEM observations were carried out at magniications up to 5,000. The electron beam energy
was 20 keV, and probe current of the order of 25 A.
The X-ray absorption spectroscopy (XAS) measurements were carried out onXAFS1 beamline of the Brazilian Synchrotron Light Laboratory with a Si-111 monochromator in transmission mode on powder samples for Mn K-edge and Re L3-edge. More details the XAFS1can be seen in Ref. 17. For precise energy calibration, manganese metallic and ReO3 were used with standards and run with the samples during the measurements. MnO, MnO2, Mn2O3 ReO2 and ReO3thick ilms were used as standard compounds. XAS under pressure was measured in B4C anvil pressure cell using ReO3 as inner pressure gauge only for the doped sample. Details of the B4C anvil pressure cell and the settings coniguration for XAS measurements under pressure are described in Ref. 18. The XANES were normalized to high energy range of spectrum (~ 100 eV beyond the edge) after background subtraction.
Magnetic characterization of the samples was performed in powder form. The AC magnetic susceptibility at ambient pressure was measured with a homemade calibrated and automated device using a driving ield HAC = 6 A/m and a frequency ν = 448 Hz [19, 20]. The induced voltage in the astatic pair of pick up coils was detected by a lock-in ampliier 5210, dual phase, EG&G. A Lake-Shore temperature controller, model 310, was used to set the temperature detected with a calibrated GaAlAs-sensor (GAL 8957).
RESULTS AND DISCUSSION
Crystal structure
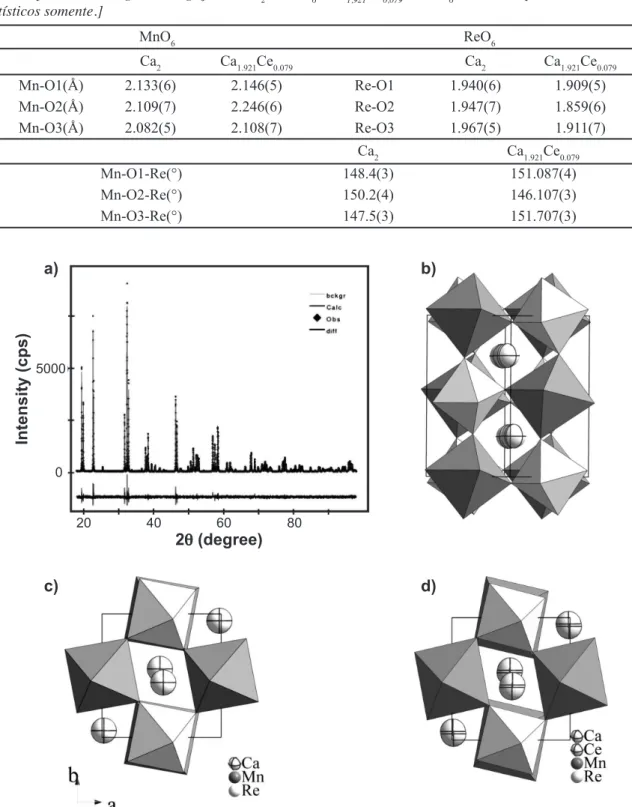
The results of structural reinements are listed in Table I with the full diffraction pattern displayed in Figs.1a and 1b.
The calculus of tolerance factor t through the equation (A) using the ionic radii reported by Shannon [21] for both samples is < 0.97. This result suggests a monoclinic (P21/n) or orthorhombic structure [7]. Then the monoclinic structure with space group P21/n was used to analyze the diffraction pattern in both samples. A major consequence of the distortion is that the Mn—O—Re angle is considerably lower than 180º. The relevant bond-lengths and angles are shown in Table II.
No secondary phases or impurities were observed in the diffraction pattern of Ca2MnReO6 and the structural parameters are the same to the ones reported by Corrêa et al. [16] and similar to the ones reported by Kato et al. [22]. Residual traces of CeO2 were found in the Ca1.8Ce0.2MnReO6, which was remarked as second set of tick marks in the diffraction pattern (Fig.1b). The small content of MnO was also detected, but had no inluence in the reinement. The weight percentage was 2.7% for CeO2 by Rietveld reinement.
about ~ 3% in both samples. The results of the Rietveld it for the atomic positions presented in the Table I show that Mn cations occupy the 2d position, Re the 2c position and the Ca/Ce cation and three oxygen anions occupy different 4e
positions. According to Glazer’s notation, there is an a-a-b+ coniguration along the pseudo-cubic axes [23]. A positive superscript would denote the neighboring octahedral tilt in the same direction (in-phase) and a negative superscript
Figure1: (a) Powder x-ray diffraction reinement of Ca2MnReO6 with λ = 1.20368 Å. (Rwp = 0.1093, χ2 = 2.448, R
F2 = 0.0466). (b) Powder x-ray diffraction reinement of Ca1.8Ce0.2MnReO6 with λ = 1.20368 Å. (Rwp=0.1280, χ2 = 2.837, RF2 = 0.0511). The second of set tick marks is for a CeO2 impurity.
[Figura 1: (a) Reinamento do padrão de difração de raios X de pó da amostra Ca2MnReO6 com λ = 1,20368 Å. (Rwp = 0,1093; χ2 = 2,448;
RF2 = 0,0466). (b) Reinamento do padrão de difração de raios X de pó da amostra Ca1,8Ce0,2MnReO6 com λ = 1,20368 Å. (Rwp=0,1280;
χ2 = 2,837; R
F2 = 0,0511).]
a) b)
7500
5500
2500
Intensity (cps)
0
25 50 75 100 120
2q (degree)
Ca2MnReO6 a = 5.44445(2)Å b = 5.63957(3) Å c = 7.77524(3) Å β = 90.18(1)° Occ.
Atom x y z Uiso(Ų)
Ca 0.4859(5) 0.55514(31) 0.25221(29) 0.0037(1) 1
Mn 1/2 0 1/2 0.0037(1) 1
Re 1/2 0 0 0.0037(1) 1
O1 0.3142(12) 0.2872(12) 0.0481(10) 0.0053(12) 1
O2 0.2124(12) 0.8025(12) 0.0478(10) 0.0053(12) 1
O3 0.5950(11) -0.0414(12) 0.2443(8) 0.0053(12) 1
Ca1.921Ce0.079MnReO6 a = 5.4578 (3)Å b = 5.6494 (2) Å c = 7.7948 (2) Å β = 90.17(1)° Occ.
Atom x y z Uiso(Ų)
Ca 0.4868(6) 0.55037(26) 0.25231(28) 0.0073(5) 0.961
Ce 0.492(5) 0.5700(19) 0.2515(23) 0.0073(5) 0.039
Mn 1/2 0 1/2 0.0039(3) 1
Re 1/2 0 0 0.0060(1) 1
O1 0.3172(11) 0.2824(10) 0.041(1) 0.0083(17) 1
O2 0.2103(11) 0.8370(11) 0.0412(10) 0.0083(17) 1
O3 0.5855(10) -0.0264(11) 0.2371(7) 0.0083(17) 1
Table I - Rietveld it results of the lattice and atomic parameters of samples Ca2MnReO6 and Ca1.921Ce0.079MnReO6. Both samples are monoclinic (P21/n).The errors represent the standard deviation (statistical only).
Figure 2: Schematic structure of (a) Ca2MnReO6 and (b) Ca1.921Ce0.079MnReO6.View of the unit cell along the crystallographic (110) direction corresponding to a pseudocubic a orb axis. The dark grey octahedral represent MnO6and the light grey octahedral represent ReO6; opposite rotations of the octahedral along the viewing direction can be seen. (c) Ca2MnReO6 and (d) Ca1.921Ce0.079MnReO6. View along the crystallographic (001) direction showing in-phase rotations.
[Figura 2: Esquema da estrutura do (a) Ca2MnReO6 e (b) Ca1,921Ce0,079MnReO6. Vista de célula unitária ao longo da direção cristalográica (110) que corresponde a um pseudocúbico eixo a ou b. O octaedro cinza escuro representa o MnO6 e o octaedro cinza claro representa o ReO6; rotações apostas dos octaedros ao longo da direção podem ser vistas. (c) Ca2MnReO6 e (d) Ca1,921Ce0,079MnReO6. Vista ao longo da direção cristalográica (001) mostrando as rotações em fase.]
Table II - Length and bond angles of Ca2MnReO6 and Ca1.921Ce0.079MnReO6. The errors represent one standard deviation and are statistical only.
[Tabela II - Comprimentos e ângulos de ligação do Ca2MnReO6 e Ca1,921Ce0,079MnReO6. Os erros representam o desvio padrão e são estatísticos somente.]
MnO6 ReO6
Ca2 Ca1.921Ce0.079 Ca2 Ca1.921Ce0.079
Mn-O1(Å) 2.133(6) 2.146(5) Re-O1 1.940(6) 1.909(5)
Mn-O2(Å) 2.109(7) 2.246(6) Re-O2 1.947(7) 1.859(6)
Mn-O3(Å) 2.082(5) 2.108(7) Re-O3 1.967(5) 1.911(7)
Ca2 Ca1.921Ce0.079
Mn-O1-Re(°) 148.4(3) 151.087(4)
Mn-O2-Re(°) 150.2(4) 146.107(3)
Mn-O3-Re(°) 147.5(3) 151.707(3)
5000
0
20 40 60 80
2q (degree)
Intensity (cps)
a)
c)
b)
implies in tilts of neighboring octahedral in opposite directions (out of phase). The view in Fig. 2a and c along the pseudo-cubic a (or b) axis shows octahedral rotations with opposite sign and Figs. 2b and d show the view along the crystallographic c axis with the in-phase rotation of the octahedral.
It was observed that a, b and c parameters of Ca1.921Ce0.079MnReO6 exhibit an increment as compared with Ca2MnReO6.
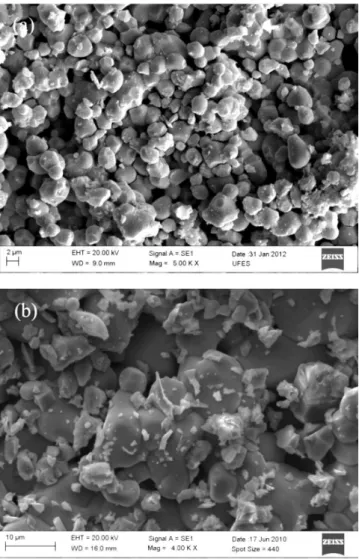
A visual inspection of the image (Fig. 3a) indicates that the particles have sizes ranging between 1 and 3 micrometers for Ca2MnReO6 sample. We can see at the image that there is no impurity in this sample conirming the result of X-ray diffraction data. In the Ca1.921Ce0.079MnReO6 sample image (Fig. 3b) we see that the impurities are at the grain boundaries, which is in agreement with data from X-ray diffraction.
The average oxidation state of Mn and Re was determined by the chemical shift of the atomic absorption edge to high energy, with increasing formal oxidation state of atom. Fig.
4 shows the Mn K-edge of the ordered double perovskite compounds Ca2MnReO6 and Ca1.921Ce0.079MnReO6 including MnO (Mn2+), Mn
2O3 (Mn3+) and MnO2 (Mn4+) standards. Near to normalized absorption equal 1 it is observed a closeness of the Mn edge and prominent indicated by “A” for both samples similar to MnO standard. This visual analysis shows Mn2+ assignments. However we concluded that the Mn shows a mixed valence in the samples. Through a linear behavior between the Mn K-edge shifts with oxidation state [24, 25] the valence of Mn was evaluated as +2.3 for the undoped sample and +2.2 for the doped sample. In addition, the prominent “B” indicates that the coordination of Mn-O octahedral in both samples is similar to MnO standard.
Fig. 5 shows the XANES spectra of the Ca2MnReO6 and Ca1.921Ce0.079MnReO6 samples at the Re L3-edge including ReO3 (+6) and ReO2 (+4) standards. The L3 edge for transitions metals has a high intensity white line due to transitions into inal d states [6], which can be correlated to the number of d holes and the oxidation state [13]. However, we used the notion of irst moment (Em) of the white-line proposed by Alp et al. [26] to estimate the chemical shift. This notion also was used by Popov et al. [6] and Corrêa
et al. [16]. The values found were ~ +5.7 and ~ +5.8 to Ca2MnReO6 and Ca1.921Ce0.079MnReO6 samples, respectively. These valences are in agreement with the visual analysis among white line centers of ReL3-edges present in ReO3 (+6) and the samples.
We can observe in the XANES spectra (Fig. 6) that white line centers of Re L3-edges shift to high energy. It is associated with the increment of Re valence up to +7 as a pressure function. We can also observe a broadening of ReL3-edge white line with increase the pressure. The shift and shape change of the white line is related with the electronic density and Re—O, which is associated
Figure 3: Secondary electron image of (a) Ca2MnReO6 and (b) Ca1.921Ce0.079MnReO6 samples.
[Figura 3: Imagem das amostras (a) Ca2MnReO6 e (b)
Ca1,921Ce0,079MnReO6 utilizando os elétrons secundários.]
Figure 4: XANES spectra of Ca2MnReO6, Ca1.921Ce0.079MnReO6 and MnO, Mn3O2, MnO2 standards at the MnK-edge.
[Figura 4: Borda K do Mn nos compostos Ca2MnReO6 e
Ca1,921Ce0,079MnReO6 desenhada em conjunto com os padrões de
comparação MnO, Mn3O2 e MnO2.]
2.0
1.0 1.5
0.5
0.0 6540
Energy (eV)
Normalized absorption (a.u.)
6560
to octahedral distortion due to doping with Ce. However, the XANES spectra measurements of MnK-edge under different pressures showed no change in the valence of Ca1.921Ce0.079MnReO6.
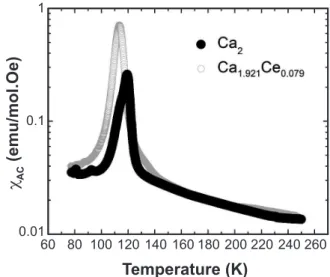
The magnetic behavior of our samples is very similar to those of Sr2CaReO6 [27] and Sr2MgReO6 [28] compounds.
These compounds present geometrical frustration, which is associated to a strong competition between antiferromagnetic and ferromagnetic interactions and the absence of B and B’ disorder [27-29]. One can notice in Fig. 7 a small decrease of frustration temperature in the doped sample that can be related with the increase of distortion from MnO6 and ReO6
octahedral.
CONCLUSIONS
The solid solution of Ce doping in Ca-site of the Ca2MnReO6 double perovskite is limited up to ~5% by solid reaction. This solid solution was conirmed by Rietveld reinement, which indicated a monoclinic unit cell with rock-salt order of the Mn and Re ions, space group P21/n in both samples (doped end undoped). A small amount of Ce added in Ca-site induce a small increase of lattice parameters a, b,c and Mn and Re valences.The XANES measurement of Ca1.921Ce0.079MnReO6 showed increment of Re valence up to +7 as a pressure function. However, the Mn valences do no change with pressure. Both doped and undoped samples presented a geometric frustration, and the frustration temperature showed a small decrease in Ca1.921Ce0.079MnReO6. The MnO6 and ReO6 octahedral distortion can be related with frustration temperature decreasing.
ACKNOWLEDGEMENTS
We thank LNLS for concession of beamlines (XRD1 and XAFS1) and Arcelor Mittal Co.. This work was supported by CAPES, FAPESP and CNPq, Brazil.
REFERENCES
[1] K. -I. Kobayashi, T. Kimura, H. Sawada, K. Terakura and Y. Tokura, Nature 395 (1998) 677.
[2] J. M. D. Coey, Adv. Phys. 48, 2 (1999) 167.
[3] S. A. Wolf, D. D. Awschalom, R. A. Buhram, J. M. Daughton, S. von Molnár, M. L. Roukes, A. Y. Chtchelkanova, D. M. Treger, Science 294 (2001) 1488. [4] J. Longo, R. Ward, J. Am. Chem. Soc. 83, 8 (1961) 2816.
Figure 5: Re L3-edge of the Ca2MnReO6 and Ca1.921Ce0.079MnReO6
compound, plotted together with the standards.
[Figura 5: Borda L3 do rênio nos compostos Ca2MnReO6 e
Ca1,921Ce0,079MnReO6, desenhada em conjunto com os padrões de
comparação.]
Figure7: AC magnetic susceptibility of Ca2MnReO6 and
Ca1.921Ce0.079MnReO6 samples as function temperature with
magnetic ield HAC = 6 A/m and a frequency ν = 448 Hz.
[Figura 7: Susceptibilidade magnética AC das amostras Ca2MnReO6 e Ca1,921Ce0,079MnReO6 em função da temperatura,
campo magnético HAC = 6 A/m e uma freqüência ν = 448 Hz.]
2.0 3.0
1.0 1.5 2.5
0.5
0.0
105301053610542 10548 10600 10650 10700
Energy (eV)
Normalized absorption (a.u.)
Figure 6: Re L3-edge of Ca1.921Ce0.079MnReO6 compound at room
pressure and under pressure up to 1.2 GPa plotted together with the
ReO2 and ReO3 standards.
[Figura 6: Borda L3 do rênio do composto Ca1,921Ce0,079MnReO6 à
pressão ambiente e sob pressão de até 1.2 GPa desenhada com os padrões ReO2 e ReO3.]
2.0 3.0
1.0 1.5 2.5
0.5
0.0
10530 10535 10540 10545 10550 10555
Energy (eV)
Normalized absorption (a.u.)
60 1
0.1
0.01
Temperature (K) c AC
(emu/mol.Oe)
[5] M. W. Lufaso, P. W. Barnes, P. M. Woodward, Acta Cryst. B 62 (2006) 384.
[6] G. Popov, M. Greenblatt, M. Croft, Phys. Rev. B 87 (2003) 024406.
[7] D. Serrate, J. M. De Teresa, M. R. Ibarra, J. Phys.: Cond. Matt. 19 (2007) 023201.
[8] J. B. Philipp, P. Majewski, L. Alff, A. Erb, R. Gross, T. Graf, M. S. Brant, J. Simon, T. Walther, W. Mader, D. Topwal, D. D. Sarma, Phys. Rev. B 68 (2003) 14443. [9] G. Popov, M. V. Lobanov, E. V. Tsiper, M. Greenblatt, E. N. Caspi, A. Borissov, V. Kiryukhin, J. W. Lynn, J. Phys.: Cond. Matt. 16 (2004) 135.
[10] J. Navarro, C. Frontera, Ll. Balcells, B. Martínez, J. Fontcuberta, Phys. Rev. B 64 (2001) 092411.
[11] D. Serrate, J. M. De Teresa, J. Blasco, M. R. Ibarra, L. Morellón, C. Ritter, Appl. Phys. Lett. 80, 24 (2002) 4573. [12] D. Serrate, J. M. De Teresa, J. Blasco, M. R. Ibarra, L. Morellón, C. Ritter, Eur. Phys. J. B 39, 1 (2004) 35.
[13] J. Blasco, J. M. Michalik, J. García, G. Subías, J. M. Teresa, Phys. Rev. B 76 (2007) 144402.
[14] L. Lutterotti, P. Scardi, P. Maistrelli, J. Appl. Crystallography 25 (1992) 459.
[15] B. H. Toby, J. Appl. Crystallography 34 (2001) 210. [16] H. P. Corrêa, J. P. Cavalcante, D. O. Souza, E. Z. Santos, M. T. D. Orlando, H. Belich, F. J. Silva, E. F. Medeiro, J. M. Pires, J. L. Passamai, L. G. Martinez, J. L. Rossi, Cerâmica
56 (2010) 193.
[17] H. C. N. Tolentino, A. Y. Ramos, M. C. M. Alves, R. A.
Barrea, E. Tamura, J. C. Cezar, N. Watanabe, J. Synchrotron Rad. 8 (2001) 1040.
[18] F. Ferreira, H. Correa, M. Orlando, J. Passamai Jr, C. Orlando, I. Cavalcante, F. Garcia, E. Tamura, L. Martinez, J. Rossi, F. C. L. de Melo, J. Synchrotron Rad. 16 (2008) 48. [19] L. Gomes, M. M. Vieira, S. L. Baldochi, N. B. Lima, M. Novak, N. D. Vieira Jr., S. P. Morato, A. Braga, C. Cesar, A. Penna, J. Mendes F., J. Appl. Phys. 63 (1988) 5044.
[20] M. T. D. Orlando, Master’s Thesis, Institute of Physics, USP, S. Paulo, SP, Brazil (1991).
[21] R. D. Shannon, Acta Crystallogr. Sect. A: Cryst. Phys. Diffr.Theor. Gen. Crystallogr. 32 (1976) 751.
[22] H. Kato , T. Okuda, Y. Okimoto, Y. Tomioka, Phys. Rev. B 69 (2004) 184412.
[23] A. M. Glazer, Acta Crystallogr. B 28 (1972) 3384. [24] J. Herrero-Martín, G. Subías, J. Blasco, J. García, M. C. Sánchez, J. Phys.: Cond. Matter 17 (2005) 4963.
[25] J. García, M. C. Sánchez, G. Subías, J. Blasco, J. Phys.: Cond. Matter 13 (2001) 3229.
[26] E. E. Alp, G. L. Goodman, L. Soderholm, S. M. Mini, M. Ramanathan, G. K. Shenoy, A. S. Bommannavar, J. Phys.: Cond. Matter 1 (1989) 6463.
[27] C. R. Wiebe, J. E. Greedan, G. M.Luke, Phys. Rev. B
65 (2002) 144413.
[28] C. R. Wiebe, J. E. Greedan, P. P. Kyriakou, G. M. Luke, J. S. Gardner, A. Fukaya, I. M. Gat-Malureanu, P. L. Russo, A. T. Savici, Y. J. Uemura, Phys. Rev. B 68 (2003) 134410. [29] A. P. Ramirez, Annu. Rev. Mater. Sci. 24 (1994) 453.