A
r
t
ic
le
*e-mail: [email protected]
Chemical Characterization of BiFeO
3Obtained by Pechini Method
Elídia A. Vetter Ferri,a Ivair A. Santos,b Eduardo Radovanovic,a
Rafaelle Bonzaninic and Emerson Marcelo Girotto*,a
a Departamento de Química, Universidade Estadual de Maringá, Av. Colombo 5790, 87020-900 Maringá-PR, Brazil
b Departamento de Física, Universidade Estadual de Maringá, Av. Colombo 5790, 87020-900, Maringá-PR, Brazil
c Instituto de Química, Universidade Estadual de Campinas, CP 6154, 13083-970 Campinas-SP, Brazil
Este trabalho descreve a síntese e a caracterização de BiFeO3 obtido a partir da rota Pechini, utilizando-se nitrato de bismuto e nitrato de ferro como precursores. Os pós foram calcinados a 800 °C em ar durante 2 h. Os difratogramas de raios X mostraram que o material apresenta duas fases, BiFeO3 (95%) e α-Bi2O3 (5%). A transição de fase ferroelétrica da amostra em 821 °C foi detectada por análise térmica diferencial. Os resultados das análises por microscopia eletrônica de varredura (SEM), espectroscopia de energia dispersiva (EDS) e fluorescência de raios X por dispersão de energia (EDX) mostraram que a amostra é quimicamente homogênea. As imagens de microscopia eletrônica de transmissão revelaram que a amostra é uniforme e apresenta partículas com formato esférico e tamanho médio de 30 nm.
This work describes the synthesis and characterization of BiFeO3 obtained by the Pechini route using bismuth nitrate and iron nitrate as precursors. The powders were annealed at 800 °C in air for 2 h. X-ray diffraction patterns showed that the material presents two phases, BiFeO3 (95%) and α-Bi2O3 (5%). The ferroelectric transition of the sample at 821 °C was detected by differential thermal analysis. Results of analyses by scanning electron microscopy (SEM), energy dispersive spectroscopy (EDS) and energy dispersive X-ray fluorescence (EDX) showed that the sample is chemically homogeneous. Transmission electron microscopy images revealed that the sample is uniform and contains spherical particles with an average size of 30 nm.
Keywords: Pechini method, X-ray diffraction, ferroelectricity, magnetic properties
Introduction
Multiferroic magnetoelectric materials are known to exhibit magnetic (ferro, anti, or ferri) and electric (ferro)
ordering simultaneously at room temperature,1 as
well as interesting physical properties with possible practical applications, as in new memory devices whose polarization and magnetization states and coupling can be
simultaneously exploited.2-6 BiFeO
3 is one of these few
materials, along with YMnO3 and BiMnO3,that have all
the potential applications of both their parent ferroelectric and ferromagnetic materials.
Bismuth ferrite, BiFeO3, belongs to the perovskite class
of materials with a rhombohedrally distorted unit cell. It has
the polar R3c space group, whose ions are displaced along
the [111] direction relative to the ideal centrosymmetric
positions.7,8 Detailed structural investigations of BiFeO
3 can
be found elsewhere.9,10 The interest in this compound is due
to its ferroelectric behavior with a high Curie temperature
(TC ca.1100 K) and its antiferromagnetic behavior with a
relatively high Néel temperature (TN ca. 650 K).7,11 Both
BiFeO3 thin films and ceramics have been intensively
investigated in the last years.11-19
Multiferroic BiFeO3 was discovered in the 1960s and
its properties have been extensively studied. However,
the electrical properties of pure BiFeO3 have rarely been
In order to understand the properties of BiFeO3, it is very important to establish a synthesis procedure in a manner such as to avoid impurity phases. There are
several reports on the synthesis of BiFeO3. Recently,
BiFeO3 ceramic samples have been synthesized by
methods like pulsed laser deposition,12 sol-gel, 12-13 solid
state reaction,14 simple precipitation,15 rapid liquid phase
sintering,16 chemical solution deposition17 and high-energy
ball milling.18
For electronic materials and other applications such as optics, catalysis and thermomechanics, the precise control of the manufacturing process is always crucial, because many physical properties
depend on the manufacturing process closely.19 In
this context, it becomes apparent that the traditional solid state reaction processes do not ensure either high compositional homogeneity or suitable purity, or allow a morphological or microstructural control. In contrast, low-temperature manufacture methods referred to as “soft chemistry”, such as the Pechini method, produce more homogeneous, purer, and more reproducible phases whose microstructure and morphology may be controlled
practically at will.19,20 These aspects play a major role
in determining the overall electronic, optical, magnetic and catalytic properties, as well as the applicability of multiple-oxide materials. Besides saving energy and being cost effective, the Pechini method is a versatile process that allows the simple and quick preparation of
ceramic materials.21
In the present research, BiFeO3 powders were
synthesized by the Pechini method using nitrates as precursors and citric acid as a chelating agent. The samples were characterized by X-ray diffractometry, thermal analysis, EDS, EDX, FTIR and transmission electron microscopy. Besides obtaining a 95% pure multiferroic material through the Pechini method, the main goal of this work was to identify the chemical aspects that affect its stoichiometry and thus its physical properties.
Experimental
Synthesis of BiFeO3
All reagents were of analytical grade and were used without further purification or treatment. Deionized water was used in the preparation of all samples. Bismuth ferrite was prepared by thermal decomposition of polymeric mixed-metal precursor gels. The polymeric precursor
solution was prepared by the Pechini method.21 The
process was based on metal citrate polymerization with ethylene glycol. A hydrocarboxylic acid, such as citric
acid, was added to the aqueous solution to chelate cations. The addition of a polyalcohol, such as ethylene glycol, led to the formation of an organic ester. Polymerization was promoted by heating and resulted in a homogeneous resin with metal ions uniformly distributed throughout the organic matrix. The sols were prepared by dissolving citric acid in deionized water with constant stirring and kept at
60-70 °C. Then, bismuth nitrate [Bi(NO3)3⋅5H2O] (98%)
(Aldrich) and ferric nitrate [Fe(NO3)3⋅9H2O] (> 99%)
(Aldrich), 1:1 molar ratio, were added to the mixture. After their total dissolution, citric acid/ethylene glycol (Synth) was added at 60:40 mass ratio. The temperature was raised up to 90-110 °C to promote esterification. The orange gel formed at the end of the reaction was dried overnight at 100 °C to remove excess water. The gel was heat-treated at 800 °C in air for 2 h to form the oxide. During the annealing procedure, the furnace heating and
cooling rates were kept at 10 °C min-1 and 20 °C min-1
(accuracy of ± 1 °C), respectively.
X-ray diffraction analysis
Powder X-ray diffraction (XRD) measurements were carried out with a Shimadzu XD-3A, model VG-108R
apparatus with Cu Kα radiation. The profile was refined
using FullProf Suite software22 and the hexagonal unit cell
corresponded to the R3c space group.
FTIR analysis
The FTIR spectra of the samples (prepared as KBr pellets) were recorded on a Bomem spectrophotometer, model MB-100. Thermogravimetric and differential thermal analyses were carried out on a SDTQ600 TA Instruments apparatus from room temperature to 1000 °C
at 10 °C min-1 in synthetic air.
TEM and SEM analyses
Results and Discussion
The X-ray diffraction pattern suggests the formation of
highly crystalline BiFeO3 (R3c space group), Figure 1. Most
of the powder (95%, determined by Rietveld refinement,
R factors: RP = 14.0, RWP = 19.1, REXP = 9.35, RB = 18.7)
was the rhombohedrally distorted perovskite BiFeO3, with
lattice parameters a = b = 5.5832 Å and c = 13.8804 Å.
The XRD patterns are in excellent accord with the JCPDS Card No. 14-0181 powder data. In addition, the formation
of a spurious phase α-Bi2O3 (5%) was evidenced, which
may contribute to degrade the ferroelectric response of
ceramics and thin films composed of the BiFeO3+Bi2O3
mixture, whereas the electrical conductivity of devices containing this mixture will certainly be higher than
that of pure BiFeO3. However, the magnetic properties
of the material are not intensely affected. In this way, in electro-electronic devices (prototypal thin films in random
access memories, for example) in which BiFeO3+Bi2O3 is
submitted to magnetic fields, their performance will hardly be affected.
The infrared spectrum (Figure 2) shows a curvature
from 1000 to 4000 cm-1,which is characteristic of
semiconductors.23 The bands at around 3400 cm-1 and
1600 cm-1 are assigned to water absorbed after calcination.
The strong peak at ca. 550 cm-1 may be assigned to Fe-O
interaction.24
TGA-DTA experiments (Figure 3) were used to investigate thermal degradation and phase transition characteristics. The small endothermic peak in the DTA
trace at ca. 821 °C has been assigned to
ferroelectric-to-paraelectric phase transition. It must be mentioned that there is no agreement on the value of the Curie point of
bismuth ferrite processed by different methods, i.e., 823,17
821,6 830.9,25 and 836 °C.26 It seems that the Curie transition
temperature of bismuth ferrite may vary slightly depending on sample processing conditions and the synthesis methods.
As the melting point of Bi2O3 is 817-825 °C, this transition
may also be assigned to the melting of this compound.14
TGA analysis showed 0.2% of weight loss up to ca. 650 °C,
probably due to the loss of residual compounds after
calcination, probably trapped nitrates27 (also confirmed
from FTIR traces in the 1340-1440 cm-1 range, Figure 2).
The weight loss above 805 °C may be assigned to the
sublimation of residual Bi2O3.14
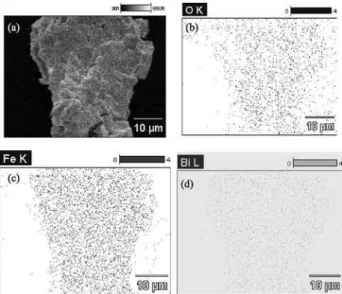
Figure 4a shows the distribution of Bi, Fe, and O within an agglomerate of nanoparticles. It was possible to verify that Bi, Fe (Figure 4b), and O are well distributed in the sample. Energy dispersive X-ray fluorescence (EDX) analysis disregarding O and C indicated 82% of Bi and 18% of Fe in atomic percentage. These percentages show that the sample is almost chemically homogeneous (regarding Bi:Fe = 1:1) with a Bi/Fe atomic percent ratio equal to
Figure 1. XRD patterns and Rietveld refinement of BiFeO3 powder
annealed at 800 ºC.
Figure 2. FTIR spectrum of BiFeO3 powder.
1.1. This ratio means that ca. 10% excess Bi is present
(or Fe is lacking). In fact, the residual α-Bi2O3 identified
through XRD analysis can be explained considering this stoichiometric deviation. Considering that iron nitrate is hygroscopic, a fraction of the precursor could contain more water molecules than indicated in the flask label. In fact, its thermogravimetric analysis (not shown) revealed
10.84 H2O molecules per Fe(NO3)3 unit. Thus, iron nitrate
used in the synthesis had more water than presumed; in other words, the weighed mass had a lower amount of iron than thought. Although this conclusion may sound common place, an exam of the literature shows that no explanations for the existence of impurities and/or unexpected phases in Pechini synthesis had been offered yet. However, we have grounds to propose that unexpected amounts of water in the precursors are a possible cause of impurities and/or unexpected phases in multiple oxide materials. Furthermore, this finding also evidences the key role of fine synthesis precursor stoichiometry in Pechini method, an aspect so far disregarded. In addition to the stoichiometry, it is necessary to mention that parameters such as calcination temperature, non-ideal calcination atmosphere, and precursor and solvent purity require some attention as well. We are currently investigating these
parameters to optimize the BiFeO3 synthesis. These results
will be published shortly.
Figure 5 displays a TEM image of the BiFeO3 sample.
Since the particles are superimposed onto an agglomerate core, the boundary limit of each nanoparticle is diffuse. Thus, it is not possible to measure the size of each individual particle accurately. However, particles with a mean size
of ca. 30 nm in diameter with a grain size distribution
centered at 32 nm (normal distribution shown in the inset) and with low dispersion may be seen in the TEM images. Although the Pechini route is one of the most widely used methods to prepare ceramics with improved properties comparatively to those of ceramics prepared through
conventional procedures,28,29 nanosized powder preparation
control has not been achieved yet. Thus, the preparation of the nanosized particles by the Pechini method achieved in this work is an extra advantage over traditional solid state routes.
Conclusions
The synthesis of BiFeO3 through the Pechini method
resulted in the formation of a highly crystalline BiFeO3
perovskite, homogeneously distributed and with a low
grain size. An unexpected phase (5% of Bi2O3) was
identified and attributed mainly to pre-calcination precursor stoichiometry. DTA analysis indicates a ferroelectric phase transition temperature of 821 °C.
Acknowledgments
The authors thank Fundação Araucária (protocols 8772 and 7437) and CNPq (processes 470862/2006-8 and 556542/2005-3) for financial support, as well as UNICAMP for XRD measurements and Prof. M. C. Gonçalves for TEM images. E. V. F. and R. B. thank CAPES and CNPq for fellowships.
Figure 4. (a) Microparticle micrograph. (b), (c), and (d) are O(K), Fe(K),
and Bi(L) EDS mappings, respectively.
Figure 5. TEM image of nanocrystalline BiFeO3 calcined at 800 ºC. Inset:
References
1. Hill, N. A.; J. Phys. Chem. B2000, 104, 6694.
2. Kim, J. K.; Kim, S. S.; Kim, W.-J.; Mater. Lett.2005, 59,
4006.
3. Zhu, W. M.; Ye, Z.–G.; Ceram. Int.2004, 30, 1435.
4. Hur, N.; Park, S.; Sharma, P. A.; Ahn, J. S.; Guha, S.; Cheong, S.-W.; Nature2004, 429, 392.
5. Kimura, T.; Kawamoto, S.; Yamada, I.; Azuma, M.; Takano, M.; Tokura, Y.; Phys. Rev. B 2003, 67, 180401.
6. Dho, J.; Leung, C. W.; MacManus-Driscoll, J. L.; Blamire, M. G.; J. Cryst. Growth2004,267, 548.
7. Ederer, C.; Spaldin, N. A.; Phys. Rev. B2005,71, 224103.
8. Li, Y. W.; Sun, J. L.; Chen, J.; Meng, X. J.; Chu, J. H.; J. Cryst. Growth2005, 285, 595.
9. Kubel, F.; Schmid, H.; J. Cryst. Growth1993, 129, 515.
10. Kubel, F.; Schmid, H.; Acta Cryst. Sect. B: Struct. Sci.1990,
46, 698.
11. Wang, Y.; Jiang, Q.-h.; He, H.-c.; Nan, C.-W.; Appl. Phys. Lett.
2006,88, 142503.
12. Gosh, S.; Dasgupta, S.; Sen, A.; Maiti, H. S.; Mater. Res. Bull.
2005,40, 2073.
13. Liu, H.; Liu, Z.; Liu, Q.; Yao, K.; Thin Solid Films2005, 500,
105.
14. Pradhan, A. K.; Zang, K.; Hunter, D.; Dadson, J. B.; Loutts, G. B.; Bhattacharya, P.; Katiyar, R.; Zhang, J.; Sellmyer, D. J.; Roy, U. N.; Cui, Y.; Burger, A.; J. Appl. Phys. 2005, 97, 093903.
15. Thapa, D.; Palkar, V. R.; Kurup, M. B.; Malik, S. K.; Mater. Lett.2004, 58, 2692.
16. Wang, Y. P.; Zhou, L.; Zhang, M. F.; Chen, X. Y.; Liu, J. -M.; Liu, Z. G.; Appl. Phys. Lett.2004, 84, 1731.
17. Iakovlev, S.; Solterbeck, C.-H.; Kuhnke, M.; Es-Souni, M.; J. Appl. Phys. 2005, 97, 094901.
18. Santos, I. A.; Grande, H. L. C.; Freitas, V. F.; de Medeiros, S. N.; Paesano Jr., A.; Cótica, L. F.; Radovanovic, E.; J. Non-Cryst. Solids2006, 352, 3721.
19. Rousset, A.; Solid State Ionics 1996, 84, 293.
20. Fernández, J. D. G.; Melo, D. M. A.; Zinner, L. B.; Salustiano, C. M.; Silva, Z. R.; Martinelli, A. E.; Cerqueira, M.; Júnior, C. A.; Longo, E.; Bernardi, M. I. B.; Mater. Lett.2002, 53, 122.
21. Pechini, M. P.; U.S. pat. 3,330,6971967.
22. Rodríguez-Carvajal, J.; Phys. B1993,192, 55.
23. Nakamoto, K.; Infrared and Raman Spectra of Inorganic and Coordination Compounds. 5th ed., Wiley: New York, 1997.
24. Sócrates, G.; Infrared and Raman Characteristic Group Frequencies. 3rd ed., Wiley: New York, 2001.
25. Wang, Y. P.; Yuan, G. L.; Chen, X. Y.; Liu, J. -M.; Liu, Z. G.;
J. Phys. D: Appl. Phys. 2006, 39, 2019.
26. Kumar, M. M.; Palkar, V. R.; Srinivas, K.; Suryanarayana, S.;
Appl. Phys. Lett.2004, 76, 2764.
27. Nakagawa, I.; Walter, J. L.; J. Chem. Phys. 1969, 51, 1389.
28. Kahoul, A.; Nkeng, P.; Hammouche, A.; Nâamoune, F.; Poillerat, G.; J. Solid State Chem.2001, 161, 379.
29. Xu, Y. B.; Yuan, X.; Huang, G. H.; Long, H.; Mater. Chem. Phys.2005,90, 333.
Received: October 8, 2007 Web Release Date: July 23, 2008